This study examined a visualized protocol for ChatGPT-assisted English as a foreign language writing instruction. The two-class comparison showed larger writing-score changes and higher post-intervention feedback-judgment accuracy in the protocol class. Class confounding and measurement limitations limit interpretation.
Forschungsartikel
From ChatGPT to Classroom Practice: A Visualized Protocol for Generative AI-Supported Feedback, Critical Thinking, and EFL Writing Instruction
In diesem Artikel
Zusammenfassung
Zusammenfassung
This study examined associations between Visualized Protocol-guided ChatGPT Writing Instruction (VP-CGWIP), writing-score trajectories, critical-thinking dispositions, and post-intervention feedback judgment in an English as a foreign language (EFL) course. Two intact second-year university classes completed a ten-week intervention and four-week follow-up. The complete-case sample included 43 experimental and 42 control participants. Writing was assessed using the International English Language Testing System (IELTS) Task 2 criteria, and dispositions using the Critical Thinking Disposition Inventory–Chinese Version (CTDI-CV). The judgment task was administered only at the immediate (T1) and delayed (T2) posttests. The experimental-minus-control differences in overall-writing change were 0.48 points at T1 (pointwise 95% confidence interval [CI], 0.26–0.70) and 0.44 at T2 (0.22–0.66). The overall score and all four writing dimensions had interaction p values below 0.05 after post hoc Holm adjustment across 18 tests. Among seven disposition dimensions, only analyticity had an adjusted interaction p value below 0.05; the total score also met this threshold. Judgment accuracy was higher in the experimental class at both posttests, whereas the adjusted p values for perception–gain correlations exceeded 0.05. Log and journal summaries provided descriptive context. Because one class represented each condition, participant-level models cannot separate condition from class. These exploratory findings describe observed associations over the four-week follow-up; measurement limitations constrain their interpretation.
Einleitung
Generative AI tools, such as ChatGPT, can generate feedback on student writing and have been studied in English as a foreign language (EFL) instruction1,2. Their availability creates opportunities for revision and iterative improvement, but fluent feedback is not necessarily accurate or appropriate to a writer's intended meaning. Instruction must therefore address how students evaluate suggestions as well as how they obtain them.
AI-assisted composing places new demands on learners' decision-making3. A grammatically plausible suggestion may conflict with the surrounding argument, while a fluent reformulation may alter the writer's stance. Research on ChatGPT-assisted EFL writing and feedback describes both opportunities and challenges4,5. A classroom protocol should make the grounds for accepting, modifying, or rejecting feedback explicit.
Existing work has examined course design, AI-assisted writing activities, and learners' thinking processes6,7,8. Protocol-based instruction is not new: Ghafouri et al. described a three-phase ChatGPT-based writing instruction protocol that combined planning, instruction, and assessment over 10 weeks9. The present study builds on this direction by making feedback verification, Accept, Modify, or Reject decisions, and written rationales explicit within a seven-step cycle. The present protocol combines and evaluates these activities; it does not represent the first use of a structured ChatGPT writing protocol. Collaborative processing of ChatGPT feedback has also been studied as a distinct instructional arrangement10.
Critical-thinking disposition and performance on a specific judgment task are related but distinct constructs. A disposition inventory asks about a tendency to engage in critical thinking; a feedback judgment task samples decisions about particular suggestions. Research on the assessment of critical thinking through feedback provides a methodological basis for distinguishing these constructs11. The present task focuses on judgments about AI-generated writing feedback.
VP-CGWIP organizes independent conceptualization, drafting, AI feedback, verification, judgment, revision, and reflection into a visible cycle. The study asks whether the two instructional conditions differ in writing-score trajectories, whether they differ in selected critical-thinking dispositions and post-intervention feedback judgments, and how participants in the experimental class describe their engagement with the protocol. Because the design includes only one class per condition, these questions concern exploratory associations. They do not identify a causal effect or establish that any single protocol component is responsible for the observed differences.
Protokoll
Ethical approval
The study protocol was approved by the Ethics Committee of Guangzhou Vocational University of Science and Technology (approval number 2026120130404). All participants provided informed consent before enrollment and were informed that they could withdraw without academic consequence.
Study design
This study employed a quasi-experimental, two-group, three-time-point mixed-methods design to examine immediate and delayed between-group trajectory differences associated with VP-CGWIP in EFL learners' writing performance and critical thinking disposition. Learner perceptions of usefulness, ease of use, and behavioral intention (BI) were assessed descriptively in the experimental group at T1 rather than treated as intervention outcomes. The design followed a quantitatively driven, qualitatively embedded logic (QUAN(qual)): quantitative data formed the primary evidentiary chain for estimating group-by-time differences, while qualitative data were embedded throughout the intervention to illuminate the cognitive and behavioral processes accompanying those differences. The two strands were integrated at the interpretive stage through a joint display12. Because one intact class represented each condition, class membership and instructional condition could not be statistically separated; accordingly, all between-group findings were interpreted as exploratory associations rather than definitive causal effects.
A quasi-experimental rather than a fully randomized design was adopted because the writing course was organized around two pre-existing intact classes and no student-level randomization was conducted. One intact class received VP-CGWIP and the other served as the control condition. Baseline comparisons were used to describe the comparability of the final analytic sample, but were not treated as proof of equivalence or as a means of eliminating class-level confounding. Three measurement points were established: a baseline pretest (T0, one week before the intervention), an immediate posttest (T1, during the final week of the ten-week intervention), and a delayed posttest (T2, four weeks after the intervention concluded). The control condition was matched to the experimental condition in AI access, writing-task load, and scheduled instructional hours. Because VP-CGWIP combined protocol visualization, structured Accept/Modify/Reject judgment, critical dialogue, adoption-log recording, and reflective activity, the between-group contrast estimated the association with the combined intervention rather than the isolated contribution of any single component.
The software, instruments, platforms, and study-specific materials used in this protocol are summarized in the Table of Materials.
Preregistration and analysis status
The study was not prospectively preregistered. The outcome hierarchy and multiplicity correction were specified retrospectively. All inferential analyses are exploratory.
Participants and sampling
From January to April 2026, participants were recruited from two intact classes of second-year university students who were not English majors enrolled in an EFL writing course at Guangzhou Vocational University of Science and Technology, Guangzhou, Guangdong, China. One class received VP-CGWIP and the other received the control instruction; no student-level randomization occurred. Eligibility required a College English Test Band 4 (CET-4) score of at least 425 and no previous systematic training in structured AI-assisted writing. Observed completer CET-4 scores ranged from 449 to 532. Each class initially included 50 students. Seven experimental and eight control participants were excluded for attendance or delayed-assessment reasons, leaving 43 and 42 participants, respectively; 15 of 100 participants (15.0%) were excluded. Figure 2 summarizes exclusions for missing at least two sessions (experimental, 4; control, 5) or not completing T2 (3 in each class). The complete-case sample contributed outcomes at T0, T1, and T2. Baseline tests concern completers only. Additional descriptive baseline summaries for the excluded students are reported in the Results; these summaries do not rule out selective attrition.
The VP-CGWIP intervention
The experimental class received the ten-week VP-CGWIP intervention shown in Figure 1. During weeks 1–2, the instructor presented the seven-step cycle and introduced prompt construction and checks of factual accuracy, logical consistency, and rhetorical appropriateness. During weeks 3–8, students submitted independently written drafts to ChatGPT, recorded individual suggestions in an AI Feedback Adoption Log, and classified each suggestion as Accept, Modify, or Reject with a written reason. Classroom dialogue addressed disagreements with AI feedback. During weeks 9–10, students continued judgment and logging activities and combined self-assessment, teacher feedback, and log entries in final revisions. Reflective journals followed the six elements of Gibbs' cycle: description, feelings, evaluation, analysis, conclusion, and action plan13. Students accessed ChatGPT through the official OpenAI web interface (chatgpt.com) using ChatGPT Plus accounts. Browsing, file-upload, and other auxiliary tool functions were disabled during the instructional activities. No temperature or other model-generation parameters were manually specified; the platform-default settings were retained.
Operational sequence and fidelity
Use an independent plan and first draft as the inputs to the cycle. For each AI suggestion, compare the proposal with the intended meaning, relevant language evidence, and the task requirements before assigning Accept, Modify, or Reject. Record the suggestion, the decision, the reason, and any resulting revision in the log; retain a reason for non-adoption. Discuss unresolved or competing judgments in class and revisit them during revision and reflection.
Control group design
The control class completed the same writing tasks and scheduled instructional hours, had access to ChatGPT, and received conventional teacher feedback. The experimental class additionally used the visualized cycle, structured judgment, and adoption logs, critical dialogue, and reflection activities. The same instructor taught both classes. Each class had two 90 min sessions per week for ten weeks, corresponding to 20 sessions and 30 scheduled instructional hours. The amount of teacher feedback and the actual time on task were not available for comparison. Equal scheduled hours do not establish equal instructional intensity. The contrast concerns the integrated package, and additional attention or practice may partly account for the observed class difference.
Study procedure and timeline
The intervention and follow-up covered 14 weeks: ten intervention weeks followed by four weeks without further intervention input. Baseline assessment (T0) occurred one week before the intervention; the interval from baseline to T2 was therefore approximately 15 weeks. T0 included timed writing, CTDI-CV, and background information. At T1 (intervention week 10), both classes completed writing, CTDI-CV, and the AI-feedback judgment task; only the experimental class completed the Technology Acceptance Model (TAM) questionnaire. At T2 (week 14), both classes repeated writing, CTDI-CV, and the judgment task to examine four-week maintenance. No baseline judgment task was administered. Adoption logs covered weeks 3–10, and reflective journals covered weeks 9–10. Figure 2 distinguishes the assessment schedule from participant flow.
Outcome measures and instruments
Table 1 summarizes the outcomes and measurement occasions. Overall writing score is the main outcome emphasized in this report; the four writing dimensions and the remaining outcomes are secondary or exploratory. Two IELTS-certified raters, blinded to group assignment, used the Task 2 dimensions Task Response (TR), Coherence and Cohesion (CC), Lexical Resource (LR), and Grammatical Range and Accuracy (GRA). The IELTS Task 2 band descriptors specify these four criteria14; published work on AI-assisted accuracy assessment provides additional context15. The administered CTDI-CV comprised 70 items, with ten items per dimension and a six-point response scale (1–6). It assessed seven self-reported disposition dimensions: truth-seeking, open-mindedness, analyticity, systematicity, critical-thinking self-confidence, inquisitiveness, and cognitive maturity. The feedback judgment task sampled responses to valid suggestions and deliberately flawed or contextually inappropriate suggestions at T1 and T2. It is treated as task-specific performance, not a validated general measure of critical thinking. The experimental-class adoption logs and journals describe classroom processes. At T1, an adapted TAM questionnaire measured perceived usefulness (PU), perceived ease of use (PEOU), and BI in the experimental class16. The TAM instrument contained 15 items rated on a five-point scale (1–5): six PU items, six PEOU items, and three BI items.
Data collection procedures
Writing assessments lasted 40 min and were completed in a classroom without AI assistance. Different prompts were used at T0, T1, and T2. Overall writing score was the arithmetic mean of the four criterion scores. Electronic questionnaires recorded response durations, and logs and journals were submitted through a writing platform. Process summaries concern the 43 experimental-class completers. Limitations of prompt comparability and measurement reliability are considered in the discussion.
Judgment task development
The judgment task comprised 20 items: ten trap-feedback items and ten valid-feedback items. Parallel forms were used at T1 and T2. Three EFL instructors reviewed the task, and it was piloted with 20 students who were excluded from the main study. Judgment scores are expressed as percentages. The task measures performance on the selected feedback items.
Quantitative analysis
All statistical analyses were conducted in R. The complete-case analysis included 85 participants and 255 repeated observations. A unique group-plus-participant identifier linked observations across time. Gaussian linear mixed-effects models were fitted using lme417, with inferential tests implemented using lmerTest18: outcome ~ group * time + (1 | uid), where group and time are categorical, Ctrl and T0 are the reference levels, and uid uniquely identifies each participant. Restricted maximum likelihood (REML), Satterthwaite denominator degrees of freedom, independent constant-variance residuals, and participant random intercepts were used. This structure implies compound-symmetric marginal covariance. The two interaction coefficients quantify experimental-minus-control differences in change from T0 to T1 and T0 to T2; pointwise 95% t intervals are reported. All 13 outcome models converged without singular fits. A sensitivity analysis added grand-mean-centered CET-4 as a fixed covariate. Continuous baseline comparisons and judgment comparisons used two-sided Welch t tests; sex counts used Pearson’s chi-square test without continuity correction. Judgment Cohen’s d used pooled sample SD. TAM associations used Pearson correlations with T1-minus-T0 overall writing change and Fisher z CIs. Aggregate baseline characteristics of excluded participants were summarized descriptively. No missing-data imputation or individual-level attrition sensitivity analysis was performed. Participant-level models cannot separate the effects of class and condition.
Multiple testing
Post hoc Holm adjustment was applied to 18 nominal p values: five writing interactions, eight CTDI-CV interactions, two judgment comparisons, and three TAM correlations19. Baseline tests and CET-4 sensitivity models were not included in this family. Pointwise contrast and correlation intervals were not adjusted for multiplicity; adjusted omnibus p values do not test a particular T1 contrast. All analyses are exploratory.
Qualitative analysis and integration strategy
The analysis in NVivo 20 followed Braun and Clarke's thematic-analysis framework20. Codes combined deductive categories from TAM, CTDI-CV, and content, process, and premise reflection with inductive categories arising from the logs and journals. Two coders worked independently, with disagreements resolved through discussion. All qualitative summaries concern the 43 experimental-class completers. The joint display places aggregate qualitative descriptions alongside quantitative results as contextual complements. Individual-level convergence and causal mechanisms were not tested; limitations of coding reliability and case selection are considered in the Discussion.
Ergebnisse
Baseline comparability in the complete-case analytic sample
Table 2 summarizes baseline characteristics. The experimental and control completers had mean ages of 19.19 years ± 0.39 years and 19.19 years ± 0.40 years, CET-4 scores of 489.02 ± 29.04 and 491.00 ± 29.11, and weekly AI use of 2.45 h ± 0.90 h and 2.40 h ± 0.90 h. Female counts were 22/43 (51.2%) and 21/42 (50.0%). Continuous values are mean ± sample standard deviation (SD). All baseline-test p values exceeded 0.05, which does not establish equivalence, remove class confounding, or describe the 15 excluded students. Baseline summaries for the seven excluded experimental-class students were age 19.14 years ± 0.38 years, four female students (57.1%), CET-4 484.6 ± 27.8, overall writing 5.18 ± 0.49, CTDI-CV total 287.9 ± 19.8, and weekly AI use 2.31 h ± 0.88 h. Corresponding summaries for the eight excluded control-class students were age 19.25 years ± 0.46 years, four female students (50.0%), CET-4 486.9 ± 31.2, overall writing 5.21 ± 0.57, CTDI-CV total 290.5 ± 21.3, and weekly AI use 2.35 h ± 0.92 h. These aggregate values describe the excluded students; the effect of exclusions on outcome estimates could not be assessed from aggregate baseline characteristics alone.
Writing performance across measurement occasions
Overall writing means were 5.23 ± 0.52, 5.83 ± 0.49, and 5.72 ± 0.54 in the experimental class at T0, T1, and T2, versus 5.29 ± 0.55, 5.41 ± 0.58, and 5.34 ± 0.61 in the control class (Table 3; mean ± SD). The omnibus group x time interaction was F(2, 166) = 11.16, p = 0.000028; Holm-adjusted p = 0.000424. Experimental-minus-control differences in change were 0.48 points at T1 (SE = 0.113; pointwise 95% CI, 0.257–0.703) and 0.44 points at T2 (SE = 0.113; 95% CI, 0.217–0.663). These estimates are participant-based associations, with class and condition inseparable. The decrease from 5.83 at T1 to 5.72 at T2 shows that the observed mean difference remained present at the four-week follow-up.
All four writing-dimension omnibus interaction p values were below 0.05 after the 18-test Holm adjustment (adjusted p = 0.000612 for each, after rounding). TR and CC had F(2, 166) = 10.57; LR and GRA had F(2, 166) = 10.67. Each dimension showed a 0.48-point differential change at T1 and 0.44 at T2. Table 3 gives the means, SDs, model SEs, and pointwise intervals. The results do not establish component-specific mechanisms.
Adding centered CET-4 to the random-intercept model left the overall-writing interaction essentially unchanged (F(2, 166) = 11.16, p = 0.000028). This sensitivity analysis used the participant-level CET-4 values. Covariate adjustment cannot separate class and condition.
Figure 3A shows overall writing means and participant-based pointwise 95% t intervals (mean ± t(0.975, n − 1) × SD/√n) at T0, T1, and T2. Figure 3B shows all 85 individual trajectories and the corresponding class means (experimental n = 43; control n = 42). All participants in this analytic sample have scores at all three occasions. The participant trajectories show variation around each class mean. They describe the observed sample and do not establish that responses generalize beyond the two classes.
Trajectories of critical thinking disposition
Table 4 presents the CTDI-CV results. After Holm adjustment across 18 tests, analyticity was the only one of seven subdimensions with an adjusted interaction p value below 0.05 (F(2, 166) = 6.04; nominal p = 0.002932; adjusted p = 0.029321). Adjusted p values were 0.060375 for systematicity, 0.140335 for self-confidence, 0.371395 for cognitive maturity, and 1.000000 for each of the other three dimensions. The total-score interaction was F(2, 166) = 17.64 (nominal p < 0.000001; adjusted p = 0.000002). This pattern does not support a general improvement across disposition dimensions or validate transfer to critical-thinking performance.
Figure 4A displays differences in change and the Holm-adjusted omnibus interaction p values. T0-to-T1 differential changes are 3.2 points for analyticity, 2.9 for systematicity, 2.6 for self-confidence, 2.0 for cognitive maturity, 1.5 for inquisitiveness, 1.1 for truth-seeking, and 1.0 for open-mindedness. The displayed p values test the three-occasion omnibus interactions, not the specific T1 contrasts. Model-based SEs and pointwise intervals for T1 and T2 contrasts are provided in Table 4.
Figure 4B displays mean ± SD trajectories for the seven CTDI-CV subdimensions and total score. Experimental total means were 289.6, 306.7, and 303.1; control means were 292.8, 295.6, and 291.4 at T0, T1, and T2. The SD is approximately 20.56 for each total-score mean. SD bars describe between-participant dispersion and are not interaction CIs. Subdimension and total scales remain separate, and follow-up is limited to four weeks.
AI feedback judgments and post-intervention task performance
The AI Feedback Adoption Log for the 43 experimental-class completers contained 1,148 entries during the eight-week guided-use period (intervention weeks 3–10), corresponding to 26.7 entries per analyzed participant. Modify was the most frequent judgment (43.6%), followed by Accept (35.9%) and Reject (20.5%) (Table 5). Among the 736 Modify or Reject entries included in the rationale analysis, linguistic evidence was the most common rationale (39.3%), followed by contextual or rhetorical appropriateness (32.7%), conflict with personal writing intent (18.6%), and intuitive or unspecified rationale (9.4%). These descriptive results characterize the process records of the analyzed experimental-group completers and were not treated as a between-group outcome.
At T1, accuracy was 71.4 ± 14.2% versus 52.6 ± 16.8% (experimental versus control), with Welch’s t-test result of t(80.11) = 5.566, p < 0.000001. The difference was 18.8 percentage points (SE = 3.378; pointwise 95% CI, 12.078–25.522; pooled-SD Cohen’s d = 1.210). At T2, accuracy was 68.9 ± 15.1% versus 49.3 ± 17.5% (experimental versus control), with Welch’s t-test result of t(80.67) = 5.523, p < 0.000001. The difference was 19.6 percentage points (SE = 3.549; pointwise 95% CI, 12.538–26.662; pooled-SD Cohen’s d = 1.200). Both Holm-adjusted p values were approximately 0.000006 (Table 5). These results are exploratory participant-based comparisons, not class-adjusted estimates. No T0 judgment measure was collected; baseline comparability and improvement in judgment therefore cannot be established.
Figure 5A summarizes 1,148 logged judgments from the 43 experimental-group completers included in the process analysis. Modify was the most frequent category (501 entries, 43.6%), followed by Accept (412, 35.9%) and Reject (235, 20.5%). The predominance of modification over either unqualified acceptance or outright rejection indicates that learners most often adapted AI feedback conditionally. Because these are single-group process records, the distribution is descriptive and does not constitute a between-group intervention effect.
Figure 5B describes the rationale distribution within the 736 Modify/Reject entries. Linguistic evidence (289 entries, 39.3%) and contextual or rhetorical appropriateness (241, 32.7%) together accounted for 72.0% of coded rationales, suggesting that most non-acceptance decisions were supported by text-focused or task-contextual grounds. Conflict with personal intent accounted for 137 entries (18.6%), while intuitive or unspecified rationales were least frequent (69, 9.4%). Because this panel is restricted to Modify/Reject records, its rationale distribution should not be generalized to the 412 Accept judgments.
Thematic analysis of reflective journals
The coding summary contained 612 reflective-journal segments from the 43 experimental-class completers: 267 content-reflection segments (43.6%), 218 process-reflection segments (35.6%), and 127 premise-reflection segments (20.8%) (Table 6). Content reflection described specific revisions, process reflection addressed the reasons for using feedback, and premise reflection questioned assumptions such as dependence on AI phrasing. Segment percentages do not indicate the percentage of students who reached each reflection level, and the illustrative paraphrases are not verbatim quotations.
Learner perception results
TAM summaries for 43 experimental-class completers were PU = 3.98 ± 0.54, PEOU = 3.71 ± 0.62, and BI = 3.85 ± 0.58 (five-point scale). Pearson correlations with T1-minus-T0 overall writing change were 0.386 (p = 0.010573), 0.175 (p = 0.261682), and 0.413 (p = 0.005915), respectively (Table 7). Holm-adjusted p values were 0.074008, 1.000000, and 0.053231; none was below 0.05. These single-class associations do not establish directionality: better performance may affect perceptions, or common influences may affect both.
Integrated quantitative and qualitative findings
Table 8 presents four illustrative qualitative summaries and an integration display. The summaries describe contextual, linguistic, intuitive, and personal-intent rationales. Integration is at the aggregate level: logs and journals provide context for the quantitative findings. The display does not link individual writing gains to particular qualitative cases and cannot establish a causal mechanism.
DATA AVAILABILITY:
Participant-level study data are available in Zenodo at https://zenodo.org/records/21967508.
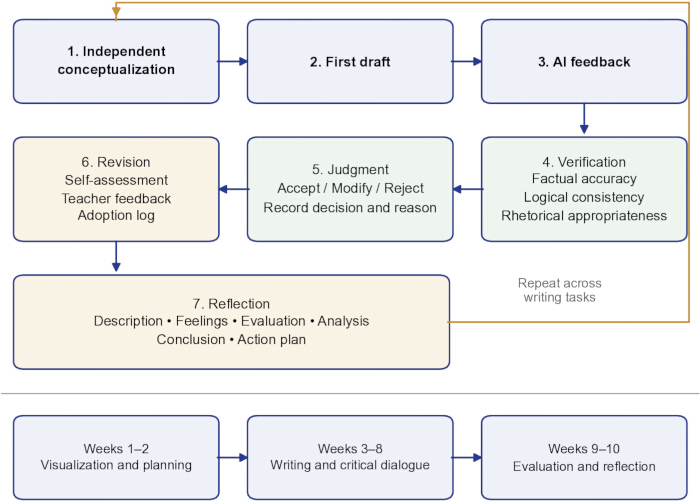
Figure 1: Seven-part VP-CGWIP cycle and implementation sequence. The cycle comprises independent conceptualization, first drafting, AI feedback, verification, judgment, revision, and reflection. The lower sequence shows the activities conducted during weeks 1–2, weeks 3–8, and weeks 9–10. Abbreviations: AI = artificial intelligence; VP-CGWIP = Visualized Protocol-guided ChatGPT Writing Instruction. Please click here to view a larger version of this figure.
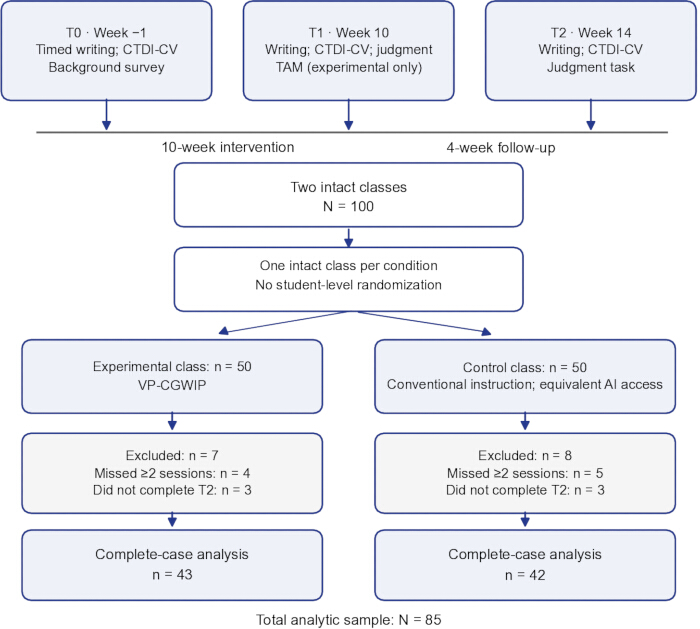
Figure 2: Assessment schedule and participant flow. Assessments were conducted at baseline (T0), immediately after the 10-week intervention (T1), and after the four-week follow-up (T2). Of the 100 enrolled students, 43 experimental-class and 42 control-class participants were included in the complete-case analysis. Abbreviations: CTDI-CV = Critical Thinking Disposition Inventory–Chinese Version; n = class sample size; N = total sample size; TAM = Technology Acceptance Model; VP-CGWIP = Visualized Protocol-guided ChatGPT Writing Instruction. Please click here to view a larger version of this figure.
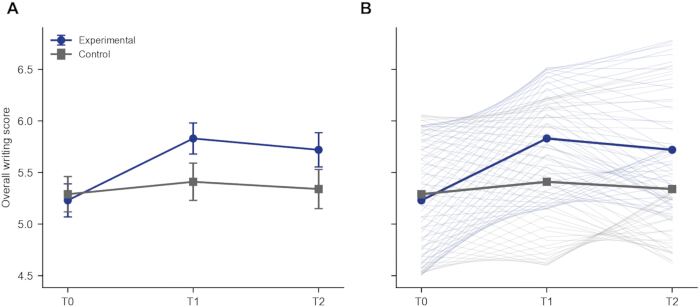
Figure 3: Overall writing-score trajectories. (A) Mean overall writing scores and pointwise 95% CIs at T0, T1, and T2 for the experimental and control classes. (B) Individual trajectories for all 85 participants, with class means superimposed. Blue circles represent the experimental class, and gray squares represent the control class. Abbreviations: CI = confidence interval; T0 = baseline assessment; T1 = immediate posttest; T2 = delayed posttest. Please click here to view a larger version of this figure.
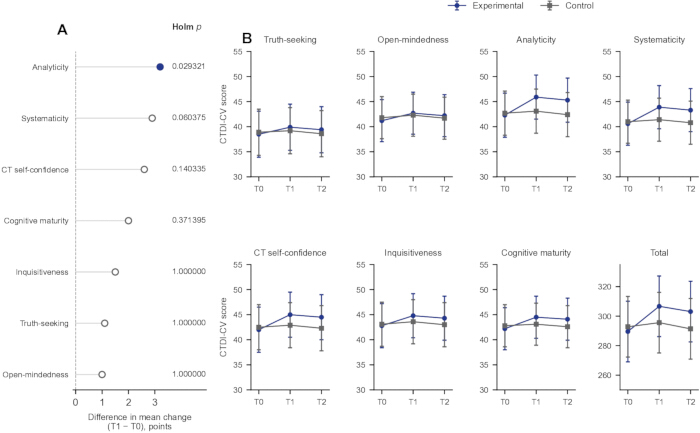
Figure 4: CTDI-CV contrasts and score trajectories. (A) Experimental-minus-control differences in mean change from T0 to T1, with Holm-adjusted p values for the corresponding three-occasion group-by-time interactions. The filled point indicates adjusted p < 0.05; open points indicate adjusted p ≥ 0.05. (B) Mean CTDI-CV scores ± SD at T0, T1, and T2 for the experimental (n = 43) and control (n = 42) classes. The total score is displayed on a separate scale. Abbreviations: CTDI-CV = Critical Thinking Disposition Inventory–Chinese Version; SD = standard deviation; T0 = baseline assessment; T1 = immediate posttest; T2 = delayed posttest. Please click here to view a larger version of this figure.
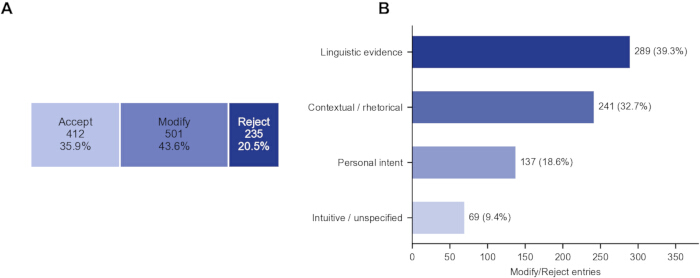
Figure 5: Experimental-class feedback decisions and rationales. (A) Distribution of 1,148 feedback decisions recorded by 43 experimental-class participants during weeks 3–10. (B) Distribution of rationale categories among the 736 Modify or Reject entries. Panel B excludes the 412 Accept entries. Percentages are based on entries rather than individual participants. Please click here to view a larger version of this figure.
| Outcome category | Specific indicator | Time point | Instrument/method | Applicable group |
| Writing performance | Overall writing score; TR, CC, LR, GRA | T0/T1/T2 | IELTS Task 2 rubric, two raters blind to group assignment | Both groups |
| Critical thinking disposition | Seven subdimension scores and total score | T0/T1/T2 | CTDI-CV (Chinese version) | Both groups |
| AI-feedback judgment performance | AI-feedback judgment accuracy (%) | T1/T2 | Study-specific 20-item AI-feedback judgment task (10 trap + 10 valid items); parallel forms at T1/T2 | Both groups |
| Critical judgment process | Accept/Modify/Reject ratio and rationale type | Weeks 3-10 | AI Feedback Adoption Log | Experimental group only |
| Reflective depth | Reflective level coding | Weeks 9-10 | Structured reflective journal | Experimental group only |
| Learner perception | PU, PEOU, BI | T1 | Adapted 15-item TAM questionnaire (6 PU, 6 PEOU, 3 BI; 5-point scale) | Experimental group only |
Table 1: Outcomes, instruments, and measurement occasions. The experimental and control classes included 43 and 42 participants, respectively. Logs, reflective journals, and TAM measures were collected from the experimental class only. Abbreviations: AI = artificial intelligence; BI = behavioral intention; CC = Coherence and Cohesion; CTDI-CV = Critical Thinking Disposition Inventory–Chinese Version; GRA = Grammatical Range and Accuracy; IELTS = International English Language Testing System; LR = Lexical Resource; PEOU = perceived ease of use; PU = perceived usefulness; T0 = baseline assessment; T1 = immediate posttest; T2 = delayed posttest; TAM = Technology Acceptance Model; TR = Task Response.
| Variable | Experimental (n = 43) | Control (n = 42) | Statistic | p value |
| Age, years | 19.19 ± 0.39 | 19.19 ± 0.40 | Welch t(82.91) = -0.052 | 0.958963 |
| Female, % | 51.2% (22/43) | 50.0% (21/42) | χ²(1) = 0.011 | 0.914627 |
| CET-4 score | 489.02 ± 29.04 | 491.00 ± 29.11 | Welch t(82.94) = -0.313 | 0.754757 |
| T0 writing score (0–9) | 5.23 ± 0.52 | 5.29 ± 0.55 | Welch t(82.47) = -0.517 | 0.606835 |
| T0 CTDI-CV total | 289.60 ± 20.56 | 292.80 ± 20.56 | Welch t(82.95) = -0.717 | 0.475165 |
| Weekly AI use, hours | 2.45 ± 0.90 | 2.40 ± 0.90 | Welch t(82.95) = 0.256 | 0.798522 |
Table 2: Baseline characteristics of the complete-case sample. Continuous values are presented as mean ± SD. Continuous variables were compared using two-sided Welch’s t-tests, and sex distributions were compared using Pearson’s chi-square test without continuity correction. Abbreviations: AI = artificial intelligence; CET-4 = College English Test Band 4; CTDI-CV = Critical Thinking Disposition Inventory–Chinese Version; n = sample size; SD = standard deviation; T0 = baseline assessment.
| Dimension | T0 Exp | T0 Ctrl | T1 Exp | T1 Ctrl | T2 Exp | T2 Ctrl | Group x time F(2,166) | Nominal p | T1 difference in change | T2 difference in change | Holm p (18 tests) | T1 SE; 95% CI | T2 SE; 95% CI |
| Task Response | 5.31 ± 0.53 | 5.37 ± 0.56 | 5.91 ± 0.50 | 5.49 ± 0.59 | 5.80 ± 0.55 | 5.42 ± 0.62 | 10.57 | 0.000048 | 0.48 | 0.44 | 0.000612 | 0.116; [0.251, 0.709] | 0.116; [0.211, 0.669] |
| Coherence and Cohesion | 5.33 ± 0.53 | 5.39 ± 0.56 | 5.93 ± 0.50 | 5.51 ± 0.59 | 5.82 ± 0.55 | 5.44 ± 0.62 | 10.57 | 0.000048 | 0.48 | 0.44 | 0.000612 | 0.116; [0.251, 0.709] | 0.116; [0.211, 0.669] |
| Lexical Resource | 5.11 ± 0.53 | 5.17 ± 0.56 | 5.71 ± 0.50 | 5.29 ± 0.59 | 5.60 ± 0.55 | 5.22 ± 0.62 | 10.67 | 0.000044 | 0.48 | 0.44 | 0.000612 | 0.115; [0.252, 0.708] | 0.115; [0.212, 0.668] |
| Grammatical Range and Accuracy | 5.17 ± 0.53 | 5.23 ± 0.56 | 5.77 ± 0.50 | 5.35 ± 0.59 | 5.66 ± 0.55 | 5.28 ± 0.62 | 10.67 | 0.000044 | 0.48 | 0.44 | 0.000612 | 0.115; [0.252, 0.708] | 0.115; [0.212, 0.668] |
| Overall score | 5.23 ± 0.52 | 5.29 ± 0.55 | 5.83 ± 0.49 | 5.41 ± 0.58 | 5.72 ± 0.54 | 5.34 ± 0.61 | 11.16 | 0.000028 | 0.48 | 0.44 | 0.000424 | 0.113; [0.257, 0.703] | 0.113; [0.217, 0.663] |
Table 3: Writing scores across measurement occasions. Values are presented as mean ± SD for 43 experimental-class and 42 control-class participants. Gaussian participant-random-intercept models were fitted using REML. Differences in change represent experimental-minus-control differences from T0 to T1 or T2. CIs are pointwise and were not adjusted for multiplicity. Holm-adjusted p values were calculated across the prespecified family of 18 tests. Abbreviations: CI = confidence interval; Ctrl = control class; Exp = experimental class; SE = standard error; SD = standard deviation; T0 = baseline assessment; T1 = immediate posttest; T2 = delayed posttest.
| Dimension | T0 Exp | T0 Ctrl | T1 Exp | T1 Ctrl | T2 Exp | T2 Ctrl | Group x time F(2,166) | Nominal p | T1 difference in change | T2 difference in change | Holm p (18 tests) | T1 SE; 95% CI | T2 SE; 95% CI |
| Truth-seeking | 38.50 ± 4.60 | 38.90 ± 4.60 | 39.90 ± 4.60 | 39.20 ± 4.60 | 39.40 ± 4.60 | 38.60 ± 4.60 | 0.70 | 0.500244 | 1.10 | 1.20 | 1.000000 | 1.129; [-1.129, 3.329] | 1.129; [-1.029, 3.429] |
| Open-mindedness | 41.20 ± 4.20 | 41.80 ± 4.20 | 42.70 ± 4.20 | 42.30 ± 4.20 | 42.20 ± 4.20 | 41.70 ± 4.20 | 0.70 | 0.499855 | 1.00 | 1.10 | 1.000000 | 1.031; [-1.035, 3.035] | 1.031; [-0.935, 3.135] |
| Analyticity | 42.30 ± 4.40 | 42.70 ± 4.40 | 45.90 ± 4.40 | 43.10 ± 4.40 | 45.30 ± 4.40 | 42.40 ± 4.40 | 6.04 | 0.002932 | 3.20 | 3.30 | 0.029321 | 1.080; [1.068, 5.332] | 1.080; [1.168, 5.432] |
| Systematicity | 40.60 ± 4.30 | 41.00 ± 4.30 | 43.90 ± 4.30 | 41.40 ± 4.30 | 43.30 ± 4.30 | 40.80 ± 4.30 | 5.03 | 0.007547 | 2.90 | 2.90 | 0.060375 | 1.055; [0.816, 4.984] | 1.055; [0.816, 4.984] |
| CT self-confidence | 42.00 ± 4.50 | 42.50 ± 4.50 | 45.00 ± 4.50 | 42.90 ± 4.50 | 44.50 ± 4.50 | 42.30 ± 4.50 | 3.84 | 0.023389 | 2.60 | 2.70 | 0.140335 | 1.105; [0.419, 4.781] | 1.105; [0.519, 4.881] |
| Inquisitiveness | 42.80 ± 4.40 | 43.10 ± 4.40 | 44.80 ± 4.40 | 43.60 ± 4.40 | 44.30 ± 4.40 | 43.00 ± 4.40 | 1.38 | 0.255062 | 1.50 | 1.60 | 1.000000 | 1.080; [-0.632, 3.632] | 1.080; [-0.532, 3.732] |
| Cognitive maturity | 42.20 ± 4.20 | 42.80 ± 4.20 | 44.50 ± 4.20 | 43.10 ± 4.20 | 44.10 ± 4.20 | 42.60 ± 4.20 | 2.64 | 0.074279 | 2.00 | 2.10 | 0.371395 | 1.031; [-0.035, 4.035] | 1.031; [0.065, 4.135] |
| Total | 289.60 ± 20.56 | 292.80 ± 20.56 | 306.70 ± 20.56 | 295.60 ± 20.56 | 303.10 ± 20.56 | 291.40 ± 20.56 | 17.64 | <0.000001 | 14.30 | 14.90 | 0.000002 | 2.840; [8.692, 19.908] | 2.840; [9.292, 20.508] |
Table 4: CTDI-CV scores across measurement occasions. Values are presented as mean ± SD for 43 experimental-class and 42 control-class participants. Gaussian participant-random-intercept models were fitted using REML. Differences in change represent experimental-minus-control differences from T0 to T1 or T2. CIs are pointwise and were not adjusted for multiplicity. Holm-adjusted p values were calculated across the prespecified family of 18 tests. Abbreviations: CI = confidence interval; CT = critical thinking; CTDI-CV = Critical Thinking Disposition Inventory–Chinese Version; Ctrl = control class; Exp = experimental class; SE = standard error; SD = standard deviation; T0 = baseline assessment; T1 = immediate posttest; T2 = delayed posttest.
| Measure | Category | Experimental | Control | Statistic | p value | Difference, percentage points (SE) | Pointwise 95% CI, percentage points | Cohen's d | Holm p (18 tests) |
| Judgment distribution (1,148 entries; n = 43) | Accept | 412 (35.9%) | N/A | — | — | ||||
| Modify | 501 (43.6%) | N/A | — | — | |||||
| Reject | 235 (20.5%) | N/A | — | — | |||||
| Modify/Reject rationales (736 entries; n = 43) | Linguistic evidence | 289 (39.3%) | N/A | — | — | ||||
| Contextual/rhetorical appropriateness | 241 (32.7%) | N/A | — | — | |||||
| Conflict with personal intent | 137 (18.6%) | N/A | — | — | |||||
| Intuitive/unspecified | 69 (9.4%) | N/A | — | — | |||||
| AI-feedback judgment accuracy, T1 | — | 71.4 ± 14.2% | 52.6 ± 16.8% | Welch t(80.11) = 5.566 | <0.000001 | 18.8 (3.378) | 12.078 to 25.522 | 1.21 | 0.000006 |
| AI-feedback judgment accuracy, T2 | — | 68.9 ± 15.1% | 49.3 ± 17.5% | Welch t(80.67) = 5.523 | <0.000001 | 19.6 (3.549) | 12.538 to 26.662 | 1.20 | 0.000006 |
Table 5: Feedback decisions, rationale categories, and AI-feedback judgment accuracy. The judgment distribution comprised 1,148 entries from 43 experimental-class participants. The rationale analysis included the 736 entries classified as Modify or Reject and excluded the 412 Accept entries. Judgment-accuracy values are presented as mean ± SD. Between-class comparisons used two-sided Welch’s t-tests. CIs are pointwise, and Holm-adjusted p values were calculated across the family of 18 tests. Abbreviations: AI = artificial intelligence; CI = confidence interval; n = sample size; SD = standard deviation; SE = standard error; T1 = immediate posttest; T2 = delayed posttest.
| Reflective level | Coded segments | Percentage | Representative content (paraphrased) |
| Content reflection | 267 | 43.60% | Operational description of lexical or syntactic revisions made per AI suggestions |
| Process reflection | 218 | 35.60% | Comparison of AI reasoning against classroom grammar or rhetorical standards before adoption |
| Premise reflection | 127 | 20.80% | Questioning whether reliance on AI phrasing undermines personal authorial voice |
| Total | 612 | 100% | Cohen’s κ = 0.81 reported for two-coder agreement; disagreements resolved through discussion |
Table 6: Reflective-journal coding summary. The analysis included 612 coded segments from the 43 experimental-class participants. Counts and percentages refer to coded segments rather than individual students. Representative content is paraphrased rather than quoted verbatim. Intercoder agreement was Cohen’s κ = 0.81; disagreements were resolved through discussion.
| Dimension | Mean ± SD | Cronbach's α | r with writing gain | Nominal p (two-sided) | Pointwise 95% CI for r | Holm p (18 tests) |
| Perceived usefulness | 3.98±0.54 | 0.86 | 0.386 | 0.010573 | [0.097, 0.615] | 0.074008 |
| Perceived ease of use | 3.71±0.62 | 0.83 | 0.175 | 0.261682 | [-0.132, 0.452] | 1.000000 |
| Behavioral intention | 3.85±0.58 | 0.88 | 0.413 | 0.005915 | [0.129, 0.635] | 0.053231 |
Table 7: TAM subscale scores and correlations with writing gain. The analysis included 43 experimental-class participants. Writing gain was calculated as the T1 overall writing score minus the T0 score. Values are presented as mean ± SD. Correlations are Pearson’s r with pointwise 95% CIs calculated using the Fisher z transformation. The intervals were not adjusted for multiplicity. Holm-adjusted p values were calculated across the family of 18 tests; none was below 0.05. Abbreviations: BI = behavioral intention; CI = confidence interval; PEOU = perceived ease of use; PU = perceived usefulness; SD = standard deviation; T0 = baseline assessment; T1 = immediate posttest; TAM = Technology Acceptance Model.
| A. Illustrative qualitative summaries | |||
| Case | Dominant rationale type | Reflective depth level | Pattern summary |
| Case A | Contextual/rhetorical appropriateness | Premise reflection | Sustained skeptical engagement with AI suggestions, reflection touching personal writing stance |
| Case B | Linguistic evidence | Process reflection | Systematic comparison of AI judgments against classroom grammar rules before adoption |
| Case C | Intuitive/unspecified | Content reflection | Vague rationale, reflection largely confined to specific revision operations |
| Case D | Conflict with personal intent | Content reflection | Tendency to reject AI suggestions based on subjective preference, with little substantive justification |
| B. Aggregate integration | |||
| Aggregate qualitative pattern | Quantitative finding | Descriptive interpretation | Boundary of inference |
| Modify: 501/1,148 decisions (43.6%); Reject: 235/1,148 (20.5%). | Overall-writing difference in change: 0.48 at T1 and 0.44 at T2; Holm interaction p = 0.000424. | Conditional use of feedback provides classroom context for the writing trajectories. | No individual case-to-gain linkage; class and condition are confounded. |
| Linguistic and contextual/rhetorical reasons: 530/736 Modify/Reject entries (72.0%). | Analyticity: Holm interaction p = 0.029321; other six disposition subdimensions have adjusted p ≥ 0.05. | Recorded reasons provide descriptive context for analytic engagement. | Rationale categories do not validate a disposition mechanism or explain a specific student outcome. |
| Content: 267/612 segments; process: 218/612; premise: 127/612. | Judgment accuracy: 71.4% vs 52.6% at T1; 68.9% vs 49.3% at T2. | Reflection categories contextualize post-intervention feedback judgments. | Segment counts are not student counts; no baseline judgment task was administered. |
| Logs and journals were collected only in the experimental class. | All three TAM–writing-gain correlations have Holm-adjusted p ≥ 0.05. | The qualitative records describe engagement within the experimental class. | These data do not establish that perceptions cause writing gains. |
Table 8: Illustrative qualitative summaries and integration with quantitative findings. (A) Illustrative summaries of feedback-decision rationales and reflective depth. The summaries are paraphrased rather than quoted verbatim, and the case labels are not linked to individual writing-score changes. (B) Aggregate integration of qualitative patterns and quantitative findings. The integration is descriptive and does not establish individual-level convergence or a causal mechanism. Abbreviations: TAM = Technology Acceptance Model; T0 = baseline assessment; T1 = immediate posttest; T2 = delayed posttest.
Diskussion
The analysis describes different trajectories in two intact EFL writing classes. Adjusted interaction p values were below 0.05 for all writing outcomes, analyticity, and the CTDI-CV total, but not the other six disposition dimensions. Judgment accuracy differed at both posttests, with no baseline judgment measurement. Logs and journals describe recorded decisions and reasons. Together these findings motivate further evaluation of the integrated protocol, while neither participant-level models nor aggregate qualitative summaries can separate protocol from class-specific influences.
The feedback judgment task addresses a practical concern: whether learners can identify plausible suggestions that are incorrect or inappropriate for their text. The reported posttest gaps were approximately 19 and 20 percentage points, but baseline differences cannot be excluded because the task was not administered at T0. Independent evidence of scoring validity and parallel-form comparability is limited. Research on internal feedback and comparisons of AI and human feedback highlights the importance of the feedback context21,22,23. Accordingly, the task is interpreted as post-intervention performance in the observed classes.
The distinction between disposition and task performance prevents a single conclusion about critical thinking. In the multiplicity-adjusted analysis, analyticity was the only subdimension with an adjusted interaction p value below 0.05; systematicity, self-confidence, and cognitive maturity did not meet that threshold. Verification and written justification may encourage analytic engagement, but this is a theoretical interpretation rather than a tested mechanism. The total-score association does not imply change in all component dispositions. Studies of metacognitive awareness, feedback engagement, and critical-thinking associations provide interpretive context24,25,26,27, while transfer and causal pathways require direct evaluation.
VP-CGWIP combines visualization, feedback verification, judgment decisions, classroom dialogue, adoption logs, self-assessment, teacher feedback, and reflection. Work on AI-supported feedback literacy and dialogic activities provides a rationale for integrating these practices28,29, while model-text and motivational studies examine other forms of AI engagement30,31. The present comparison cannot identify which component matters, whether components interact, or whether additional instructional attention explains the difference. A dismantling or factorial design with multiple classes per condition would address these questions. The TAM findings are also exploratory: ratings were collected once, in one class, and none of the correlation tests had a p value below 0.05 after the 18-test Holm adjustment. PU may follow better performance rather than precede it; the data do not test this direction.
Several limitations constrain interpretation. First, one class represented each condition, so condition and class membership are completely confounded. Participant random effects and nonsignificant baseline tests do not resolve this problem; peer, motivation, and differences in classroom implementation remain plausible explanations despite the shared instructor. Second, excluding 15% of the original cohort may favor more engaged or higher-performing students. Aggregate baseline summaries cannot establish the impact of attrition on outcome estimates. Third, measurement reliability, scoring transformations, and parallel-form comparability could not be fully assessed. CTDI-CV variables had identical within-group SDs across measurement occasions, and item-level measurement properties were not independently evaluated. Judgment-task and disposition findings therefore require cautious interpretation. Fourth, actual feedback and practice exposure, coding reliability, and case-selection procedures could not be fully evaluated, limiting conclusions about implementation and individual-level qualitative convergence. Fifth, multiple exploratory tests and the absence of prospective preregistration limit confirmatory interpretation. Finally, a single institutional setting, second-year non-English majors, and a four-week follow-up restrict generalizability. The CET-4 eligibility threshold was 425, and completer scores ranged from 449 to 532. Findings may not generalize to learners outside this proficiency range or to settings with different educational systems, AI access, and institutional policies.
Future studies should recruit multiple classes per condition, use an allocation strategy that separates instructional condition from classroom context, and retain participants with incomplete follow-up whenever a justified analysis permits. A longer follow-up can examine whether the decline from T1 to T2 stabilizes or continues. Component-focused designs, validated judgment forms administered at baseline and follow-up, and transparent integration of discrepant qualitative cases would strengthen the evidence. Reviews of ChatGPT engagement and second language (L2) feedback research provide broader context for these priorities32,33.
The seven-step protocol makes classroom decisions about AI feedback explicit and offers an instructional sequence for further testing. The two-class comparison showed associations with writing trajectories, selected critical-thinking dispositions, and post-intervention feedback judgments. These findings support further evaluation in studies that separate class from condition, strengthen measurement evidence, and extend follow-up.
Offenlegungen
The authors have nothing to disclose.
Danksagungen
The authors thank the participating students for their time and cooperation. This research received no specific grant from any funding agency in the public, commercial, or not-for-profit sectors.
Materialien
| Name | Unternehmen | Katalognummer | Kommentare |
|---|---|---|---|
| Critical Thinking Disposition Inventory–Chinese Version (CTDI-CV) | Chinese-language study instrument / instrument authors | N/A | 70-item inventory; 7 dimensions; 10 items per dimension; 6-point response scale (1–6); administered at T0, T1, and T2. |
| ChatGPT | OpenAI | N/A | Official OpenAI web interface (chatgpt.com), accessed using ChatGPT Plus accounts. Browsing, file-upload, and other auxiliary tools disabled during instruction. Platform-default generation settings retained; no manual temperature or other generation parameters. |
| R statistical software | R Foundation for Statistical Computing | N/A | R 4.6.0; used for quantitative statistical analyses. |
| lme4 package for R | CRAN / lme4 developers | N/A | Version 1.1-37; used to fit Gaussian linear mixed-effects models by restricted maximum likelihood (REML), with participant-specific random intercepts. |
| lmerTest package for R | CRAN / lmerTest developers | N/A | Version 3.1-3; used for inferential tests and Satterthwaite approximations for denominator degrees of freedom. |
| NVivo | Lumivero (formerly QSR International) | N/A | NVivo 20; used for thematic coding and qualitative analysis of adoption-log rationales and reflective journals. |
| IELTS Academic Writing Task 2 band descriptors | IELTS | N/A | Official Task 2 scoring criteria for Task Response, Coherence and Cohesion, Lexical Resource, and Grammatical Range and Accuracy; used by two IELTS-certified raters. |
| College English Test Band 4 (CET-4) | National College English Testing Committee, China | N/A | English-proficiency eligibility measure; inclusion threshold ≥425; participant scores also used in sensitivity analysis. |
| AI Feedback Adoption Log | Study team | N/A | Intervention process record used during weeks 3–10 to record each AI suggestion, Accept/Modify/Reject decision, rationale, and resulting revision. |
| AI-feedback judgment task | Study team | N/A | 20-item task: 10 trap-feedback items and 10 valid-feedback items; parallel forms at T1 and T2; reviewed by three EFL instructors and piloted with 20 students excluded from the main study. |
| Reflective journal prompts | Study team; structured with Gibbs' reflective cycle | N/A | Used during weeks 9–10; prompts covered description, feelings, evaluation, analysis, conclusion, and action plan. |
| Technology Acceptance Model (TAM) questionnaire | Study team; adapted from Davis (1989) | N/A | 15 items on a 5-point scale: 6 perceived usefulness (PU), 6 perceived ease of use (PEOU), and 3 behavioral intention (BI) items; experimental class at T1 only. |
| Electronic questionnaire / writing submission platform | Study institution | N/A | Used to administer CTDI-CV and TAM, record response duration, and collect AI Feedback Adoption Logs and reflective journals. |
| VP-CGWIP seven-step visualized protocol | Study team | N/A | Instructional scaffold: independent conceptualization, drafting, AI feedback, verification, judgment, revision, and reflection. |
Referenzen
- Mahapatra S. Impact of ChatGPT on ESL students' academic writing skills: A mixed methods intervention study. Smart Learn Environ. 2024;11:9. https://doi.org/10.1186/s40561-024-00295-9.
- Guo K, Wang D. To resist it or to embrace it? Examining ChatGPT's potential to support teacher feedback in EFL writing. Educ Inf Technol. 2024;29(7):8435-63. https://doi.org/10.1007/s10639-023-12146-0.
- Liu M, Zhang LJ, Biebricher C. Investigating students' cognitive processes in generative AI-assisted digital multimodal composing and traditional writing. Comput Educ. 2024;211:104977. https://doi.org/10.1016/j.compedu.2023.104977.
- Tsai CY, Lin YT, Brown IK. Impacts of ChatGPT-assisted writing for EFL English majors: Feasibility and challenges. Educ Inf Technol. 2024;29(17):22427-45. https://doi.org/10.1007/s10639-024-12722-y.
- Poláková P, Ivenz P. The impact of ChatGPT feedback on the development of EFL students' writing skills. Cogent Educ. 2024;11(1):2410101. https://doi.org/10.1080/2331186X.2024.2410101.
- Tseng YC, Lin YH. Enhancing English as a foreign language (EFL) learners' writing with ChatGPT: A university-level course design. Electron J e-Learn. 2024;22(2):78-97. https://doi.org/10.34190/ejel.21.5.3329.
- Boudouaia A, Mouas S, Kouider B. A study on ChatGPT-4 as an innovative approach to enhancing English as a foreign language writing learning. J Educ Comput Res. 2024;62(6):1289-317. https://doi.org/10.1177/07356331241247465.
- Kartal G. The influence of ChatGPT on thinking skills and creativity of EFL student teachers: A narrative inquiry. J Educ Teach. 2024;50(4):627-42. https://doi.org/10.1080/02607476.2024.2326502.
- Ghafouri M, Hassaskhah J, Mahdavi-Zafarghandi A. From virtual assistant to writing mentor: Exploring the impact of a ChatGPT-based writing instruction protocol on EFL teachers' self-efficacy and learners' writing skill. Lang Teach Res. 2024. Published online. https://doi.org/10.1177/13621688241239764.
- Yan D. Comparing individual vs. collaborative processing of ChatGPT-generated feedback: Effects on L2 writing task improvement and learning. Lang Learn Technol. 2024;28(1):1-19. https://doi.org/10.64152/10125/73597.
- Tang T, et al. Unveiling the efficacy of ChatGPT in evaluating critical thinking skills through peer feedback analysis: Leveraging existing classification criteria. Think Skills Creat. 2024;53:101607. https://doi.org/10.1016/j.tsc.2024.101607.
- Creswell JW, Plano Clark VL. Designing and conducting mixed methods research. 3rd ed. SAGE Publications; Thousand Oaks, CA; 2018.
- Gibbs G. Learning by doing: A guide to teaching and learning methods. Further Education Unit, Oxford Polytechnic; Oxford; 1988.
- IELTS. IELTS writing band descriptors. 2023. https://ielts.org/cdn/ielts-guides/ielts-writing-band-descriptors.pdf.
- Mizumoto A, Shintani N, Sasaki M, Teng MF. Testing the viability of ChatGPT as a companion in L2 writing accuracy assessment. Res Methods Appl Linguist. 2024;3(2):100116. https://doi.org/10.1016/j.rmal.2024.100116.
- Davis FD. Perceived usefulness, perceived ease of use, and user acceptance of information technology. MIS Q. 1989;13(3):319-40. https://doi.org/10.2307/249008.
- Bates D, Mächler M, Bolker B, Walker S. Fitting linear mixed-effects models using lme4. J Stat Softw. 2015;67(1):1-48. https://doi.org/10.18637/jss.v067.i01.
- Kuznetsova A, Brockhoff PB, Christensen RHB. lmerTest package: Tests in linear mixed effects models. J Stat Softw. 2017;82(13):1-26. https://doi.org/10.18637/jss.v082.i13.
- Holm S. A simple sequentially rejective multiple test procedure. Scand J Stat. 1979;6(2):65-70. https://doi.org/10.2307/4615733.
- Braun V, Clarke V. Using thematic analysis in psychology. Qual Res Psychol. 2006;3(2):77-101. https://doi.org/10.1191/1478088706qp063oa.
- Tam ACF. Interacting with ChatGPT for internal feedback and factors affecting feedback quality. Assess Eval High Educ. 2025;50(2):219-35. https://doi.org/10.1080/02602938.2024.2374485.
- Muñoz Muñoz BC, Nassaji H, Bello Carrillo FI. ChatGPT-generated versus human direct corrective feedback on L2 writing. System. 2025;134:103805. https://doi.org/10.1016/j.system.2025.103805.
- Zou S, Guo K, Wang J, Liu Y. Investigating students' uptake of teacher- and ChatGPT-generated feedback in EFL writing: A comparison study. Comput Assist Lang Learn. 2025. Published online. https://doi.org/10.1080/09588221.2024.2447279.
- Teng MF. Metacognitive awareness and EFL learners' perceptions and experiences in utilising ChatGPT for writing feedback. Eur J Educ. 2025;60(1):e12811. https://doi.org/10.1111/ejed.12811.
- Zhan Y, Yan Z. Students' engagement with ChatGPT feedback: Implications for student feedback literacy in the context of generative artificial intelligence. Assess Eval High Educ. 2025:1-14. https://doi.org/10.1080/02602938.2025.2471821.
- Yeung S. University students' engagement with generative AI-supported automated writing evaluation (AWE) feedback. J Second Lang Writ. 2025;68:101203. https://doi.org/10.1016/j.jslw.2025.101203.
- Shen X, Teng MF. Three-wave cross-lagged model on the correlations between critical thinking skills, self-directed learning competency and AI-assisted writing. Think Skills Creat. 2024;52:101524. https://doi.org/10.1016/j.tsc.2024.101524.
- Lu Q, et al. Exploring the impact of a GenAI-supported feedback practice on student feedback literacy in L2 writing. Comput Assist Lang Learn. 2026. Published online. https://doi.org/10.1080/09588221.2025.2605541.
- Zhang Y, Liu Y. Designing ChatGPT-mediated feedback activities in EFL writing: A design-based study of the dialogic feedback triangle. Assess Eval High Educ. 2026;51(1):137-60. https://doi.org/10.1080/02602938.2025.2571846.
- Lu DJ, Zeng Y. Exploring the use of ChatGPT-generated model texts as a feedback instrument: EFL students' text quality and perceptions. Innov Lang Learn Teach. 2025. Published online. https://doi.org/10.1080/17501229.2025.2525341.
- Zare J, Al-Issa A, Ranjbaran Madiseh F. Interacting with ChatGPT in essay writing: A study of L2 learners' task motivation. ReCALL. 2025;37(3):385-402. https://doi.org/10.1017/s0958344025000035.
- Lo CK, Hew KF, Jong MSY. The influence of ChatGPT on student engagement: A systematic review and future research agenda. Comput Educ. 2024;219:105100. https://doi.org/10.1016/j.compedu.2024.105100.
- Crosthwaite P, Sun S. Generative AI and L2 written feedback studies: A scoping review. RELC J. 2026;57(1):207-19. https://doi.org/10.1177/00336882251386530.