This study presents an exploratory, integrative analysis that prioritizes AKT1, CASP9, and EIF2S1 as candidate genes for paraptosis in painful diabetic peripheral neuropathy (PDPN).
Forschungsartikel
Integrated Bulk and Single-Cell Transcriptomic Analysis Prioritizes Candidate Paraptosis-Related Genes in Painful Diabetic Peripheral Neuropathy
In diesem Artikel
Zusammenfassung
Zusammenfassung
Painful diabetic peripheral neuropathy (PDPN) is among the most disabling complications of diabetes, but its molecular features and underlying biological mechanisms remain incompletely understood. Paraptosis, a non-canonical form of programmed cell death characterized by endoplasmic reticulum/mitochondrial swelling and cytoplasmic vacuolization, is associated with endoplasmic reticulum and mitochondrial stress, processes that are also implicated in diabetic neuropathy, but its potential involvement in PDPN remains unclear. This study applied an exploratory integrative strategy that combined peripheral blood bulk transcriptomic data from 12 patients with PDPN and 12 healthy controls, together with publicly available single-cell transcriptomic data from human peripheral nerve tissue (GSE266026), comprising samples from patients with DPN and traumatic limb amputation (TLA) comparators. Candidate genes were identified by intersecting differentially expressed genes with a paraptosis-related gene set, and were prioritized using LASSO, SVM-RFE, and random forest. The biological context of the prioritized genes was further explored through immune infiltration analysis, two-sample Mendelian randomization, single-cell characterization, and scTenifoldKnk-based computational virtual knockout analysis. Fifteen paraptosis-related differentially expressed genes were identified, with a significantly elevated paraptosis-related score in PDPN. AKT1, CASP9, and EIF2S1 were prioritized by all three machine-learning methods. Computational immune-cell deconvolution estimated increased the estimated neutrophil abundance and decreased the estimated CD8⁺ T-cell and resting memory CD4⁺ T-cell abundance in PDPN blood, with distinct correlations between the three candidate genes and inferred immune-cell profiles. Mendelian randomization provided evidence consistent with a potential association between genetically proxied higher AKT1 expression and diabetic polyneuropathy risk. Single-cell analysis revealed cell type-specific expression patterns of the three candidate genes, while computational virtual knockout analyses predicted gene-regulatory perturbations involving immune-inflammatory, neuronal structural, and cell-adhesion pathways within the respective network backgrounds. This exploratory integrative analysis prioritizes AKT1, CASP9, and EIF2S1 as candidate paraptosis-related genes associated with PDPN and provides a biological context for further mechanistic and experimental investigation.
Einleitung
Diabetic peripheral neuropathy (DPN) is one of the most common and disabling chronic complications of diabetes. It predominantly affects the distal peripheral nerves of the limbs and clinically manifests as paresthesia, numbness, pain, and progressive sensory loss. As the global burden of diabetes continues to rise, DPN has become a major driver of foot ulceration, falls, limb amputation, and impaired quality of life, imposing substantial clinical and socioeconomic burdens1. Painful diabetic peripheral neuropathy (PDPN) represents a clinically important subtype of DPN and is characterized by neuropathic pain symptoms such as burning pain, stabbing pain, electric shock-like pain, and mechanical allodynia2. In addition to peripheral nerve structural and functional injury, the painful phenotype may involve neuroimmune dysregulation, cellular stress responses, and remodeling of pain-related neural circuits3. However, the molecular mechanisms underlying PDPN remain incompletely understood, and its clinical assessment still relies largely on symptoms, neurological signs, and functional testing, with few objective molecular measures available to complement current approaches4,5.
Accumulating evidence indicates that sustained hyperglycemia, oxidative stress, mitochondrial dysfunction, endoplasmic reticulum stress, axonal degeneration, microvascular injury, and inflammatory activation jointly contribute to the development and progression of DPN and PDPN6,7. Although pharmacological treatments for neuropathic pain can provide partial symptomatic relief, current therapeutic strategies are largely analgesic and show limited efficacy. More importantly, they rarely reverse established peripheral nerve damage8. Therefore, characterizing molecular alterations linking cellular stress, nerve injury, and immune dysregulation may improve our understanding of PDPN and provide hypotheses for future mechanistic studies.
Paraptosis is a form of programmed cell death distinct from apoptosis, necrosis, and autophagy. Morphologically, it is characterized by swelling of the endoplasmic reticulum and mitochondria, together with extensive cytoplasmic vacuolization9. Mechanistically, paraptosis is closely associated with disrupted proteostasis, endoplasmic reticulum stress, mitochondrial injury, MAPK signaling activation, and cellular metabolic stress10. Programmed cell-death pathways have increasingly been implicated in diabetic neuropathy. Previous studies have demonstrated the involvement of apoptosis, dysregulated autophagy, pyroptosis, ferroptosis, and necroptosis in diabetes-induced neuronal and Schwann-cell injury, with oxidative stress, mitochondrial dysfunction, endoplasmic reticulum stress, and inflammatory signaling acting as important upstream mechanisms11,12. Notably, the pathological milieu of PDPN is marked by chronic hyperglycemic stimulation, enhanced oxidative stress, impaired mitochondrial function, and disruption of endoplasmic reticulum homeostasis. These features substantially overlap with the core biological characteristics of paraptosis. However, paraptosis has not been specifically characterized in diabetic neuropathy, and it remains unknown whether PDPN is associated with a paraptosis-related transcriptional signature in peripheral blood or how genes within such a signature are distributed across peripheral-nerve cell types.
The rapid development of high-throughput sequencing and bioinformatics has made bulk RNA sequencing, single-cell RNA sequencing, and machine learning powerful approaches for dissecting the molecular architecture of complex diseases13,14. Peripheral blood bulk transcriptomics offers a minimally invasive approach for characterizing systemic transcriptional alterations and may capture immune-inflammatory and cellular stress signals associated with PDPN. In contrast, single-cell RNA sequencing enables cell type-resolved characterization of transcriptional programs within peripheral nerve tissues, thereby overcoming the limited ability of bulk transcriptomics to resolve cellular sources15. In addition, Mendelian randomization can provide genetically informed evidence regarding potential relationships between candidate gene expression and disease risk, subject to instrumental-variable assumptions16, whereas virtual knockout analysis allows the predicted network consequences of gene perturbation to be explored within single-cell gene regulatory networks17.
This study hypothesized that PDPN is associated with an altered paraptosis-related transcriptional signature in peripheral blood. Accordingly, we sought to characterize this signature and prioritize candidate paraptosis-related genes in PDPN peripheral blood, and to further explore their immune associations, genetic evidence, cell type-specific expression patterns, and predicted regulatory context using complementary computational analyses. This integrative framework was intended to provide a biological context for the PDPN-associated paraptosis signature and to generate hypotheses for future mechanistic investigation.
Protokoll
The peripheral blood transcriptomic data used in this study were obtained from a prospective observational cohort conducted at China-Japan Friendship Hospital. The study was approved by the Ethics Committee of China-Japan Friendship Hospital (Ethics Approval No. 2022-KY-200) and registered in the Chinese Clinical Trial Registry (ChiCTR2300068445). Written informed consent was obtained from all participants. Publicly available datasets were analyzed in accordance with their original ethical approvals and data-use policies.
Data sources
Peripheral blood transcriptomic data were obtained from a prospective observational cohort study conducted at China-Japan Friendship Hospital (Ethics Approval No. 2022-KY-200; Clinical Trial Registration No. ChiCTR2300068445). Detailed information regarding cohort design and sample collection has been reported in a previous preprint study18. The previously reported transcriptomic cohort included 20 patients with DPN and 20 nondiabetic healthy controls. The DPN and healthy-control samples were processed in two sequencing batches: the first batch comprised 8 patients with DPN and 8 healthy controls, whereas the second batch comprised 12 patients meeting the PDPN criterion (Douleur Neuropathique 4 [DN4] score ≥ 4) and 12 healthy controls matched for age, sex, and years of education. The present study analyzed the complete second batch (12 PDPN and 12 healthy controls). Thus, the 24 bulk-transcriptomic samples analyzed here represent a phenotype-focused subset of the previously reported cohort. The previous study focused on general DPN and integrated transcriptomic features with multimodal brain imaging, whereas the present study specifically examined a paraptosis-related transcriptional signature in PDPN and performed the paraptosis-related differential-expression, candidate-gene prioritization, immune-infiltration, Mendelian-randomization, peripheral-nerve single-cell, and virtual-knockout analyses reported here.
Single-cell transcriptomic data
Publicly available single-cell RNA sequencing (scRNA-seq) data were downloaded from the Gene Expression Omnibus (GEO) database under the accession number GSE26602619. This dataset contains single-cell transcriptomic profiles of human peripheral nerve tissues from 4 patients with DPN and 3 traumatic limb amputation (TLA) controls and was used to characterize the cell type-specific expression patterns of candidate genes and the peripheral nerve microenvironment at single-cell resolution. Given the absence of pain-specific phenotyping, this dataset was used for tissue and cellular contextualization rather than for PDPN-specific validation. Furthermore, the TLA samples were treated as comparator nerve tissues rather than as representative healthy peripheral nerves.
Mendelian randomization data
For the two-sample Mendelian randomization analysis, exposure data were obtained from whole-blood cis-expression quantitative trait loci (cis-eQTL) summary statistics released by the eQTLGen Consortium20. cis-eQTL single-nucleotide polymorphisms (SNPs) significantly associated with the expression levels of AKT1, CASP9, and EIF2S1 were selected as genetic instrumental variables. Outcome data were obtained from the FinnGen R12 database for the diabetic polyneuropathy phenotype (finn-b-DM_POLYNEURO)21.
Whole-blood RNA sequencing and preprocessing
Peripheral venous whole blood (2.5 mL per participant) was collected into blood RNA stabilization tubes, gently mixed with the RNA-stabilizing reagent, and stored vertically at −80 °C until RNA extraction. Total RNA was isolated from RNA-stabilized whole blood. Because of the high abundance of globin transcripts in whole blood, globin mRNA depletion was performed before library preparation. Polyadenylated mRNA was subsequently enriched using oligo(dT) magnetic beads, followed by mRNA fragmentation, cDNA synthesis, end repair, adapter ligation, PCR amplification, library quality control, circularization, and DNA-nanoball generation. Qualified libraries were sequenced on the DNBSEQ-T7 platform. Raw sequencing reads were filtered using SOAPnuke (v2.1.9) to remove adapter-contaminated reads, reads containing >5% unknown bases (N), and low-quality reads in which bases with quality scores <15 accounted for >20% of the read length (`-l 15 -q 0.2 -n 0.05`). Clean reads were aligned to the GRCh38/hg38 human reference genome using HISAT2 (v2.1.0), and to the reference gene set using Bowtie2 (v2.3.4.3). Gene-level expression was quantified using RSEM (v1.3.1). An average of 6.38 GB of raw sequencing data was generated per sample (45.24 million raw reads per sample).
All 24 samples included in the present analysis passed the prespecified sequencing-quality criteria and were retained for downstream analysis; no sample was excluded after sequencing. Although the broader transcriptomic cohort was generated in two sequencing batches, all 24 samples analyzed in the present study belonged to the same second batch. Therefore, there was no within-analysis batch variation, and batch was not included as a covariate in the differential-expression model.
Differential expression analysis
Differential expression analysis between the control and PDPN groups was performed using DESeq2 (v1.4.5) with raw gene-level counts as input. DESeq2 size-factor normalization based on the median-of-ratios method was applied to account for differences in sequencing depth and library composition. The complete primary design formula was design = ~ group, where group represented PDPN versus healthy-control status, with the healthy-control group used as the reference. Age, sex, and years of education were controlled through matching at the study-design stage and were not additionally included as covariates in the primary DESeq2 model. Blood-cell composition was not included as a covariate because independent differential blood-cell counts or flow-cytometric measurements were unavailable for all samples. Differentially expressed genes (DEGs) were identified using the thresholds of |log2 FC| > 0.585 and adjusted P value < 0.05. A set of 65 paraptosis-related genes (PRGs) was obtained from the previously published study by Zhou and Chen22, in which the gene set was compiled from previous studies and provided in Supplementary Table 1. The published gene set was used without further addition or removal of genes. The complete list of the 65 PRGs used in the present analysis is provided in Supplementary Table 1. Membership in this literature-derived set was treated as an annotation of reported paraptosis association rather than evidence that each gene is a specific or core regulator of paraptosis. In particular, genes with well-established roles in apoptosis or broader cellular-stress pathways, including CASP3 and CASP9, were retained because they were included in the prespecified published gene set and were not selectively removed post hoc. The intersection between PDPN-associated DEGs and the paraptosis gene set was defined as paraptosis-related DEGs. Principal component analysis was performed to evaluate the global transcriptomic differences between the control and PDPN groups. A paraptosis score was calculated based on the paraptosis-related DEGs using single-sample gene set enrichment analysis (ssGSEA), and intergroup comparisons were performed using the Wilcoxon rank-sum test.
Functional enrichment analysis
Gene Ontology (GO) and Kyoto Encyclopedia of Genes and Genomes (KEGG) pathway enrichment analyses of paraptosis-related DEGs were performed using the clusterProfiler R package. An adjusted p-value <0.05 was considered statistically significant. Gene set enrichment analysis (GSEA) based on Hallmark gene sets was conducted using all genes ranked by differential expression between the control and PDPN groups. Enrichment direction was quantified by the normalized enrichment score (NES), with |NES| > 1 and adjusted p value <0.05 considered significant.
Protein-protein interaction network analysis
A protein-protein interaction (PPI) network of paraptosis-related DEGs was constructed using the STRING database (v12.0), with the organism set to Homo sapiens and a combined confidence score threshold >0.4. Network construction and topological analysis were performed in R. Protein interaction data were retrieved using the STRINGdb package, node degree centrality was calculated using the igraph package, and network visualization was performed using the ggraph package with the Fruchterman-Reingold layout. Genes were ranked in descending order according to degree values to visualize their topological importance within the paraptosis-related interaction network.
Machine learning-based prioritization of candidate genes
To identify candidate genes from the 15 paraptosis-related DEGs, three complementary machine learning algorithms were applied in parallel. Least absolute shrinkage and selection operator (LASSO) regression was performed using the glmnet R package, and the optimal penalty parameter λ was determined by 10-fold cross-validation using the λ.1se criterion; genes with non-zero coefficients were retained. Support vector machine-recursive feature elimination (SVM-RFE) was performed using the e1071 and caret R packages, with iterative removal of the least informative features to minimize classification error. Random forest analysis was conducted using the randomForest R package; variable importance was evaluated by mean decrease accuracy, and the optimal number of features was determined based on the minimum out-of-bag error. Genes shared by all three algorithms were prioritized as candidate genes and used for subsequent immune infiltration, MR, single-cell, and virtual knockout analyses.
Immune infiltration analysis
Peripheral blood immune cell composition was inferred using the CIBERSORT algorithm with the LM22 signature matrix and 1,000 permutations. Only samples with deconvolution p-values <0.05 were retained for downstream analyses23. Between-group differences in CIBERSORT-estimated immune cell fractions were assessed using the Wilcoxon rank-sum test, with effect sizes expressed as rank-biserial correlation coefficients (r_rb). p-values were adjusted for multiple comparisons using the Benjamini-Hochberg method. In parallel, the MCP-counter algorithm was used to independently estimate the abundance scores of eight immune cell populations and two stromal cell populations24. Both analyses were implemented using the IOBR R package25. Correlations between candidate gene expression and immune cell fractions or abundance scores were assessed using Spearman rank correlation analysis, with Benjamini-Hochberg-adjusted p values <0.05 considered statistically significant. In addition, an inflammation-related marker gene set was curated from published literature, and correlations between these marker genes and immune cell estimates were analyzed using the same approach. Spearman correlation coefficients were hierarchically clustered and visualized as heatmaps.
Mendelian randomization
Two-sample Mendelian randomization was performed as an exploratory analysis to assess whether genetically predicted expression of AKT1, CASP9, and EIF2S1 was associated with the risk of diabetic polyneuropathy. The analysis was based on three core assumptions for instrumental variables: relevance, indicating that the genetic instruments are strongly associated with the exposure; independence, indicating that the instruments are independent of confounders; and exclusion restriction, indicating that the instruments affect the outcome only through the exposure. Exposure and outcome datasets were harmonized to align effect alleles. Palindromic SNPs and SNPs directly associated with the outcome were excluded to reduce the risk of horizontal pleiotropy and reverse causality. The primary effect estimate was estimated using the inverse variance weighted (IVW) method, with MR-Egger regression, weighted median, weighted mode, and simple mode methods applied as sensitivity analyses. Effect estimates were expressed as odds ratios (ORs) with 95% confidence intervals (CIs). Multiple testing was corrected using the Benjamini-Hochberg false discovery rate (FDR) method. Heterogeneity, horizontal pleiotropy, and the influence of individual SNPs were assessed using Cochran’s Q test, the MR-Egger intercept test, and leave-one-out analysis, respectively. All analyses were performed using the TwoSampleMR R package26.
Single-cell RNA-seq data analysis
Quality control, dimensionality reduction, and clustering of scRNA-seq data were performed using Seurat (v5.0)27. Quality control was conducted independently for each sample. Cells were retained if they contained 200–6,000 detected genes, 500–50,000 UMI counts, and <20% mitochondrial gene content. Doublets were identified and removed using DoubletFinder with an expected doublet rate of 7.5%, adjusted for the homotypic doublet proportion28. Ambient RNA contamination was evaluated using decontX29, and cells with contamination scores ≥0.2 were excluded. After quality control, data from all samples were merged and processed sequentially using NormalizeData, highly variable feature selection with the top 2,000 genes, and ScaleData, followed by principal component analysis. Batch effects across samples were corrected using the Harmony algorithm. A K-nearest neighbor graph was constructed based on Harmony-corrected embeddings, and cell clusters were identified using the Louvain algorithm. Uniform manifold approximation and projection (UMAP) was used for two-dimensional visualization. Cell clusters were manually annotated according to canonical marker genes reported in the literature. The expression distributions of candidate genes across cell types were visualized using DotPlot and grouped heatmaps. Given the limited number of biological donors, cell-level observations were not considered independent donor-level replicates, and between-group cell-composition and candidate-gene expression patterns were interpreted as descriptive and hypothesis-generating.
Virtual knockout analysis
Computational virtual knockout of candidate genes was performed using the scTenifoldKnk framework. Gene regulatory networks (GRNs) were constructed separately for the TLA control and DPN groups. A condition-specific virtual knockout strategy was adopted according to the direction of candidate-gene expression, consistent with previous scTenfoldKnk-based analyses30. AKT1 and CASP9, which were upregulated in PDPN, were virtually knocked out in the DPN network to explore the predicted consequences of reducing genes elevated in the disease-associated state. In contrast, EIF2S1, which was downregulated in PDPN, was virtually knocked out in the TLA control network to examine the predicted consequences of its loss from the comparator state. Tensor decomposition and Euclidean distance were used to quantify the displacement of each gene within the network before and after virtual knockout, expressed as a Z score. Differentially perturbed genes (DPGs) were defined using the thresholds of |Z| > 2 and Benjamini-Hochberg-adjusted P value < 0.05. Perturbation intensity was quantified using mean |Z| and Σ|Z|. GO and KEGG enrichment analyses were then performed on DPGs to characterize biological pathways predicted to be associated with the virtual knockout of each candidate gene.
Statistical analysis
All statistical analyses were performed in R (v4.3). Continuous variables were compared between groups using either the Wilcoxon rank-sum test or the independent-samples t-test, depending on data distribution. Correlation analyses were performed using Spearman's rank correlation. Multiple comparisons were adjusted using the Benjamini-Hochberg FDR method. A p value < 0.05 was considered statistically significant.
Ergebnisse
Identification of paraptosis-related differentially expressed genes in peripheral blood from patients with PDPN
The peripheral blood transcriptomic profiles between the control group (CN, n = 12) and the PDPN group (n = 12)were first compared. A total of 3,414 differentially expressed genes (DEGs) were identified in PDPN compared with CN, including 1,515 upregulated and 1,899 downregulated genes (Figure 1A). Principal component analysis revealed a clear separation trend between CN and PDPN samples at the global transcriptomic level (Figure 1B). By intersecting PDPN-associated DEGs with a curated paraptosis-related gene set, we identified 15 paraptosis-related DEGs, including CSF1, MARK4, AKT1, CTDSP2, MKNK2, CASP9, MAP2K2, MYLK, TNFRSF19, EIF2S1, PDCD5, HACD2, MAPK8, CASP3, and CDKN3 (Figure 1C). Heatmap analysis showed that these genes effectively distinguished CN from PDPN samples (Figure 1D). Among them, CSF1, MARK4, AKT1, CTDSP2, MKNK2, CASP9, MAP2K2, and MYLK were upregulated in the PDPN group, whereas TNFRSF19, EIF2S1, PDCD5, HACD2, MAPK8, CASP3, and CDKN3 were downregulated. In addition, the paraptosis score was significantly higher in the PDPN group than in the CN group (p < 0.001), indicating an enhanced paraptosis-related molecular signature in the peripheral blood of patients with PDPN (Figure 1E). Boxplot analysis further confirmed the differential expression patterns of these 15 candidate genes between the two groups (Figure 1F).
Functional enrichment and protein-protein interaction network analyses of paraptosis-related DEGs
GO enrichment analysis was performed for the 15 paraptosis-related DEGs. At the biological process (BP) level, these genes were mainly enriched in stress-related processes, including response to UV, response to light stimulus, cellular response to environmental stimulus, and cellular response to abiotic stimulus. At the cellular component (CC) level, the enriched terms included glial limiting end-foot, CSF1-CSF1R complex, apoptosome, and death-inducing signaling complex. At the molecular function (MF) level, the genes were primarily enriched in protein serine/threonine kinase activity, protein serine kinase activity, and protein serine/threonine/tyrosine kinase activity, with protein serine/threonine kinase activity showing the strongest enrichment (Figure 2A). KEGG pathway analysis showed that these genes were mainly enriched in Alzheimer's disease, pathways of neurodegeneration, the MAPK signaling pathway, apoptosis, TNF signaling pathway, and lipid and atherosclerosis (Figure 2B). A protein-protein interaction (PPI) network was then constructed using the STRING database with a confidence score threshold > 0.4. AKT1 and CASP3 were positioned at the center of the network (Figure 2C), and candidate gene ranking was consistent with the network topology analysis (Figure 2D). Hallmark GSEA further revealed that apical junction, coagulation, heme metabolism, IL6-JAK-STAT3 signaling, hypoxia, inflammatory response, complement, apoptosis, p53 pathway, and TNFα signaling via NF-κB were significantly positively enriched in the PDPN group. In contrast, E2F targets, MYC targets V1, G2M checkpoint, and oxidative phosphorylation were significantly negatively enriched (Figure 2E).
Machine learning-based prioritization of candidate paraptosis-related genes
To further prioritize candidate paraptosis-related genes associated with PDPN, machine learning analysis was performed based on the 15 paraptosis-related DEGs. LASSO regression identified the optimal penalty parameter through cross-validation, and five candidate genes were selected under the λ.1se criterion: AKT1, CASP9, EIF2S1, HACD2, and MAP2K2 (Figure 3A,B). SVM-RFE analysis selected 10 candidate genes, namely EIF2S1, AKT1, MAP2K2, MKNK2, CASP9, TNFRSF19, CSF1, MARK4, HACD2, and PDCD5 (Figure 3C). Random forest analysis ranked candidate genes according to mean decrease in accuracy and identified six feature genes, including CASP9, EIF2S1, MKNK2, AKT1, CTDSP2, and MARK4 (Figure 3D). By intersecting the results of the three algorithms, three candidate genes were prioritized: CASP9, EIF2S1, and AKT1 (Figure 3E). Intergroup expression analysis showed that AKT1 and CASP9 were significantly upregulated in the PDPN group, whereas EIF2S1 was significantly downregulated (Figure 3F).
Immune-cell deconvolution and candidate-gene correlations
To evaluate alterations in peripheral blood immune cell composition in PDPN, immune cell fractions were first compared between the CN and PDPN groups using CIBERSORT. All 24 peripheral blood transcriptomic samples (12 CN and 12 PDPN) met the CIBERSORT deconvolution quality criterion (p < 0.05) and were included in the analysis. The proportion of neutrophils was significantly increased in the PDPN group (r_rb = 0.764, adjusted p = 0.018), whereas the proportions of resting memory CD4 T cells(r_rb = −0.944, adjusted p = 0.0018), CD8 T cells (r_rb = −0.639, adjusted p = 0.033), and memory B cells (r_rb = −0.458, adjusted p = 0.0470) were significantly decreased. No significant differences were observed for the remaining immune cell types between the two groups (Figure 4A). Correlation analysis between candidate genes and CIBERSORT-derived immune cell fractions showed that AKT1 and CASP9 were significantly positively correlated with neutrophils, but negatively correlated with resting memory CD4 T cells and CD8 T cells (Figure 4B). In contrast, EIF2S1 showed the opposite correlation pattern, being negatively correlated with neutrophils and positively correlated with resting memory CD4 T cells and CD8 T cells. MCP-counter analysis showed broadly concordant patterns between candidate gene expression and selected immune cell abundance scores (Figure 4C). This concordance was interpreted as consistency between two deconvolution approaches rather than independent biological validation. The correlations between candidate genes and inflammation-related marker genes were further analyzed (Figure 4D). AKT1 and CASP9 displayed similar correlation patterns: both were positively correlated with TGFB1, CD4, and CSF1, but negatively correlated with IFNG, CROT, SCP2, IL15, IL7, and HLA-DRA. By contrast, EIF2S1 was positively correlated with IFNG, CROT, SCP2, IL15, IL7, HLA-DRA, and TGFB3, and negatively correlated with TGFB1, CD4, and CSF1.
Mendelian randomization analysis of genetically predicted candidate-gene expression and diabetic polyneuropathy risk
To explore potential associations between genetically predicted expression of AKT1, CASP9, and EIF2S1 and the risk of diabetic polyneuropathy, we performed two-sample Mendelian randomization using eQTL genetic variants as instrumental variables and diabetic polyneuropathy from the FinnGen R12 database (finn-b-DM_POLYNEURO) as the outcome. Using a genome-wide significance threshold of p < 5 × 10⁻8, we selected cis-eQTL SNPs for AKT1 (n = 16), CASP9 (n = 26), and EIF2S1 (n = 3) as instrumental variables. All instruments had F statistics greater than 10, indicating a low likelihood of weak instrument bias. The primary MR analysis provided evidence consistent with a potential association between genetically predicted higher AKT1 expression and increased diabetic polyneuropathy risk (IVW: OR = 2.13, 95% CI = 1.53–2.97, p = 1.12 × 10⁻5). This association was further supported by the weighted median method (OR = 2.01, 95% CI = 1.27–3.19, P = 2.40 × 10⁻3), suggesting that genetically predicted higher AKT1 expression may be associated with increased diabetic polyneuropathy risk (Figure 5A). In contrast, the IVW estimates for CASP9 and EIF2S1 were not statistically significant (CASP9: OR = 1.00, p = 9.70 × 10⁻1; EIF2S1: OR = 2.03, p = 1.73 × 10⁻1), indicating insufficient evidence of associations between genetically predicted expression of these two genes and DPN risk under the current sample size and instrument availability. Sensitivity analyses showed no evidence of significant horizontal pleiotropy for AKT1 based on the MR-Egger intercept test (p > 0.05). Although Cochran’s Q test indicated moderate heterogeneity among instrumental variables, the robustness of the weighted median estimate supported the reliability of the primary finding. Scatter plots showed consistent effect directions across different MR methods for AKT1 (Figure 5B). Leave-one-out analysis further demonstrated that the direction and statistical significance of the IVW estimate remained stable after sequential removal of each SNP, suggesting that the observed association was not driven by any single SNP (Figure 5C).
Cell type-specific expression patterns of candidate genes in the DPN single-cell transcriptomic dataset
To further characterize the cell type-specific distribution of the candidate genes in peripheral nerve tissues, we analyzed the publicly available single-cell dataset GSE266026. Based on canonical marker genes, 11 major cell types were identified, including Schwann cells, fibroblasts, neutrophils, macrophages, T cells, monocytes, SMC/pericytes, endothelial cells, mast cells, NK cells, and B cells (Figure 6A). The expression patterns of the marker genes used for cell type annotation are shown in Figure 6C.
Cell composition analysis showed descriptive differences in cellular proportions between the TLA control and DPN groups. Compared with the TLA control group, the DPN group showed relatively increased proportions of fibroblasts, monocytes, macrophages, Schwann cells, and T cells, whereas the proportions of neutrophils and endothelial cells were relatively decreased (Figure 6B).
The expression distributions of AKT1, CASP9, and EIF2S1 were next examined across cell types (Figure 6D). AKT1 was most prominently expressed in fibroblasts and also showed relatively high expression in macrophages, monocytes, and endothelial cells. CASP9 displayed a highly cell-type-specific pattern, with predominant expression in monocytes, followed by SMC/pericytes. EIF2S1 showed the highest expression in fibroblasts and was broadly expressed in Schwann cells, endothelial cells, monocytes, and SMC/pericytes. Grouped heatmap analysis further revealed cell type-specific expression patterns in candidate gene expression between the TLA control and DPN groups (Figure 6E). Compared with the TLA control, AKT1 and EIF2S1 were downregulated in fibroblasts and Schwann cells in the DPN group. In monocytes, AKT1 and CASP9 were upregulated, and CASP9 consistently showed the highest expression in this cell type. CASP9 showed lower expression in SMC/pericytes, whereas EIF2S1 showed higher expression in endothelial cells in the DPN group relative to TLA controls. These results indicate that AKT1, CASP9, and EIF2S1 have distinct cell type-specific expression distributions and show descriptive expression differences between DPN and TLA control peripheral nerve samples.
Perturbation effects of candidate gene virtual knockout on gene regulatory networks in peripheral nerve tissue
To explore the predicted regulatory effects associated with the candidate genes at the gene regulatory network level, virtual knockout analysis was performed on the GSE266026 single-cell dataset using the scTenifoldKnk framework. Based on their differential-expression directions, AKT1 and CASP9 were virtually knocked out in the DPN network, whereas EIF2S1 was knocked out in the TLA control network. Virtual knockout of AKT1 and CASP9 in the DPN network and EIF2S1 in the TLA control network produced distinct predicted network-perturbation profiles (Figure 7A–C). Functional enrichment analysis revealed distinct pathway-enrichment patterns associated with the predicted perturbations of the three candidate genes (Figure 7D). Genes predicted to be perturbed after AKT1 knockout were enriched in leukocyte chemotaxis and cytokine–cytokine receptor interaction. CASP9 knockout-associated perturbed genes were enriched in axonogenesis, neuron projection guidance, and ECM–receptor interaction. EIF2S1 knockout-associated perturbed genes were enriched in cell–substrate adhesion, focal adhesion, and ECM–receptor interaction.
DATA AVAILABILITY:
The de-identified gene-level count matrix for the 24 clinical whole-blood transcriptomic samples analyzed in the present study (12 PDPN and 12 healthy controls) is provided as Supplementary File 1. The single-cell RNA-seq dataset analyzed in this study is publicly available in the Gene Expression Omnibus database under accession number GSE266026. The eQTL data were obtained from the eQTLGen Consortium, and the outcome GWAS data were obtained from the FinnGen R12 database.
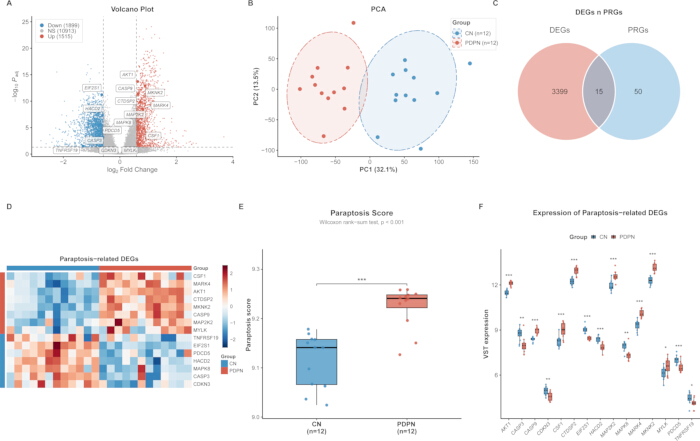
Figure 1: Identification of paraptosis-related DEGs in PDPN peripheral blood. (A) Volcano plot of DEGs between CN and PDPN groups. (B) PCA showing transcriptomic separation between CN and PDPN samples. (C) Venn diagram showing the intersection of PDPN DEGs and paraptosis-related genes. (D) Heatmap of the 15 paraptosis-related DEGs. (E) Comparison of paraptosis scores between CN and PDPN groups. (F) Expression levels of the 15 paraptosis-related DEGs in CN and PDPN samples. CN, control normal; PDPN, painful diabetic peripheral neuropathy; DEGs, differentially expressed genes. *p < 0.05, **p < 0.01, ***p < 0.001. Please click here to view a larger version of this figure.
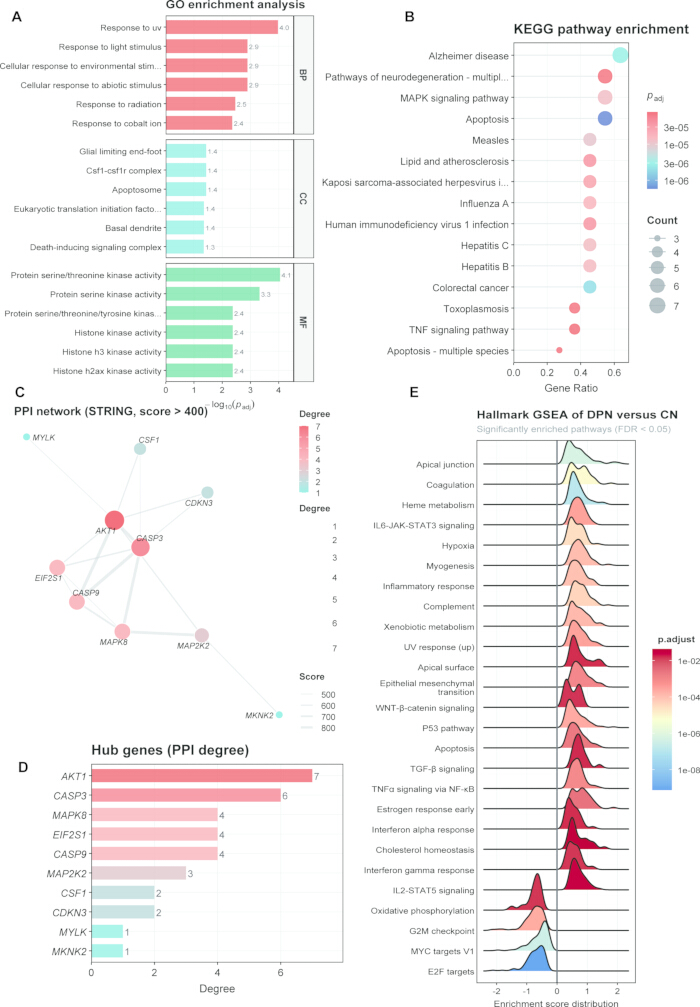
Figure 2: Functional enrichment and PPI analysis of paraptosis-related DEGs. (A) GO enrichment analysis of the 15 paraptosis-related DEGs. (B) KEGG pathway enrichment analysis. (C) PPI network constructed using the STRING database. (D) Candidate gene ranking based on network topology. (E) Hallmark GSEA showing representative pathways enriched in PDPN. Please click here to view a larger version of this figure.
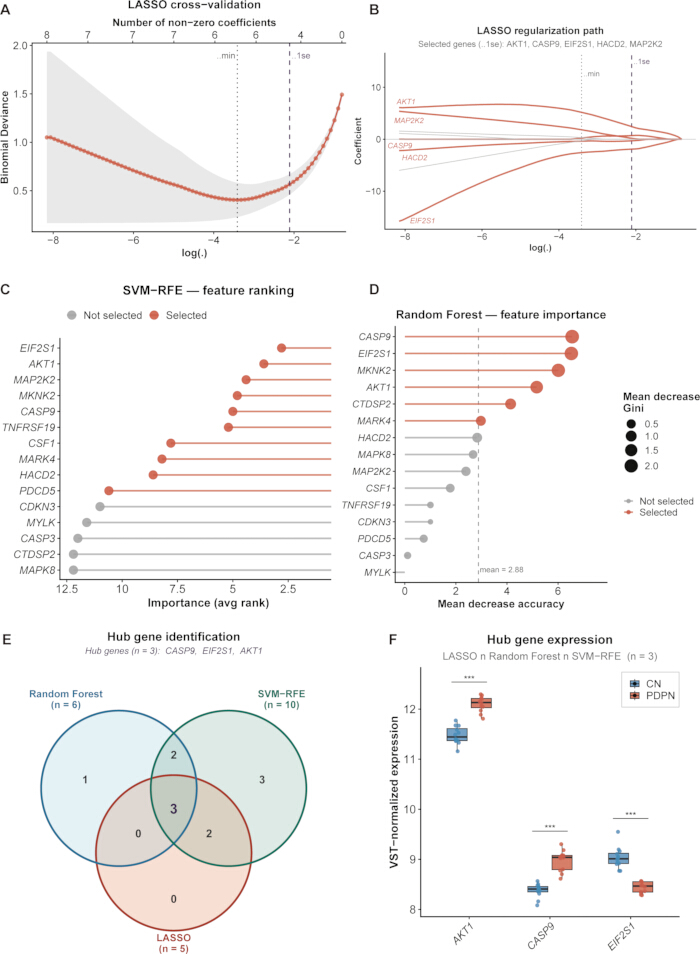
Figure 3: Machine learning-based prioritization of candidate paraptosis-related genes. (A,B) LASSO regression for candidate gene selection. (C) SVM-RFE analysis identifying optimal feature genes. (D) Random forest ranking of gene importance. (E) Intersection of genes selected by LASSO, SVM-RFE, and random forest. (F) Expression of the three candidate genes in CN and PDPN groups. Please click here to view a larger version of this figure.
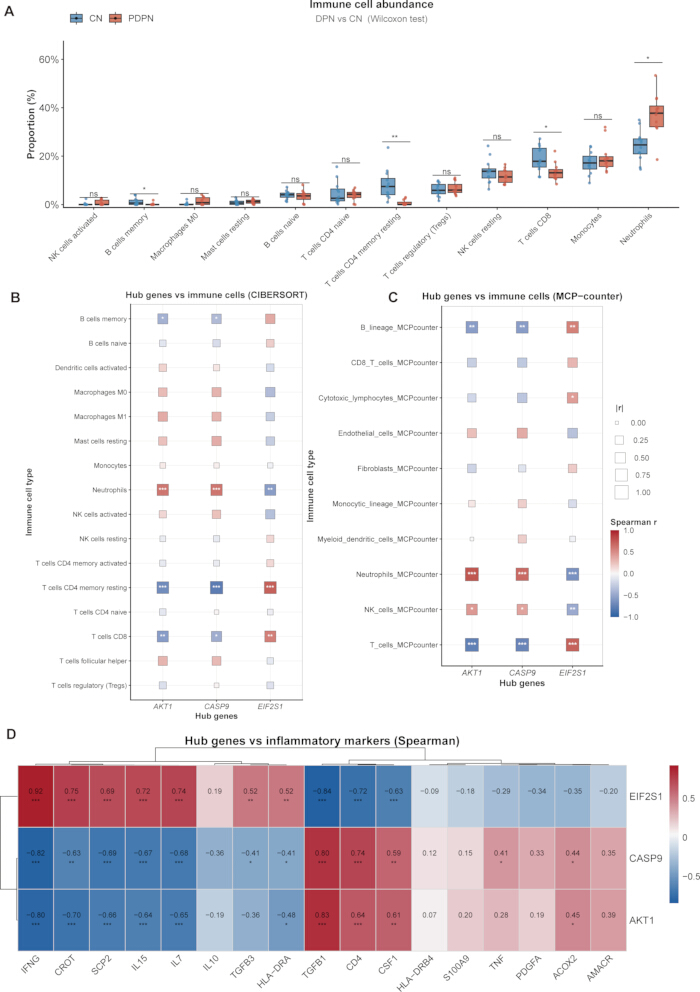
Figure 4: Immune infiltration characteristics of candidate genes. (A) CIBERSORT analysis of immune cell proportions in CN and PDPN groups. (B) Correlations between candidate genes and CIBERSORT-derived immune cells. (C) Correlations between candidate genes and MCP-counter immune abundance scores. (D) Correlations between candidate genes and inflammation-related marker genes. CN, control normal; PDPN, painful diabetic peripheral neuropathy. *adjusted p < 0.05, **adjusted p < 0.01, ***adjusted p < 0.001. Please click here to view a larger version of this figure.
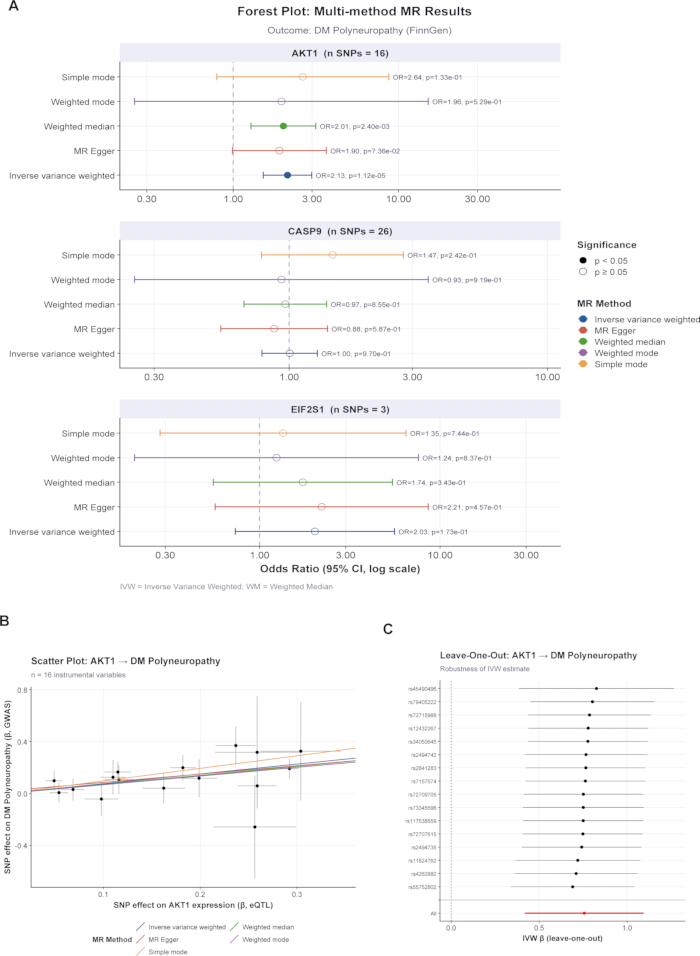
Figure 5: Mendelian randomization analysis of candidate genes. (A) MR estimates for AKT1, CASP9, and EIF2S1 with diabetic polyneuropathy risk. (B) Scatter plots showing SNP effects on gene expression and disease risk. (C) Leave-one-out analysis assessing the influence of individual SNPs. MR, Mendelian randomization; SNP, single-nucleotide polymorphism. Please click here to view a larger version of this figure.
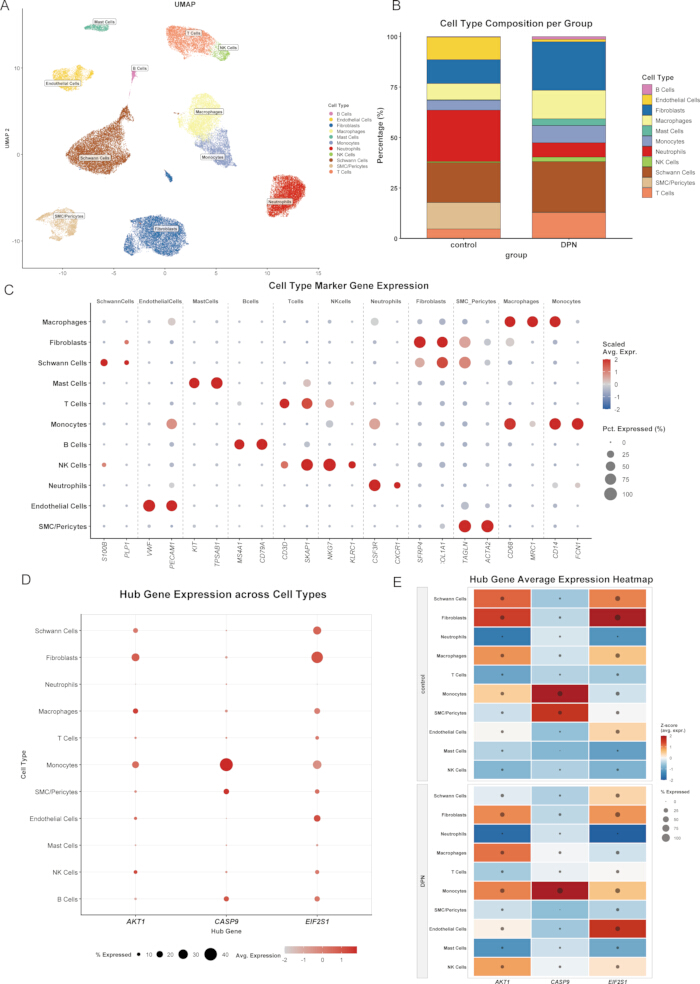
Figure 6: Single-cell expression patterns of candidate genes in DPN and TLA control peripheral nerve tissue. (A) UMAP visualization of annotated cell types. (B) Cell type proportions in TLA control and DPN groups. (C) Expression of canonical marker genes across cell types. (D) DotPlot showing AKT1, CASP9, and EIF2S1 expression across cell types. (E) Grouped heatmap showing between-group patterns of candidate gene expression. Please click here to view a larger version of this figure.
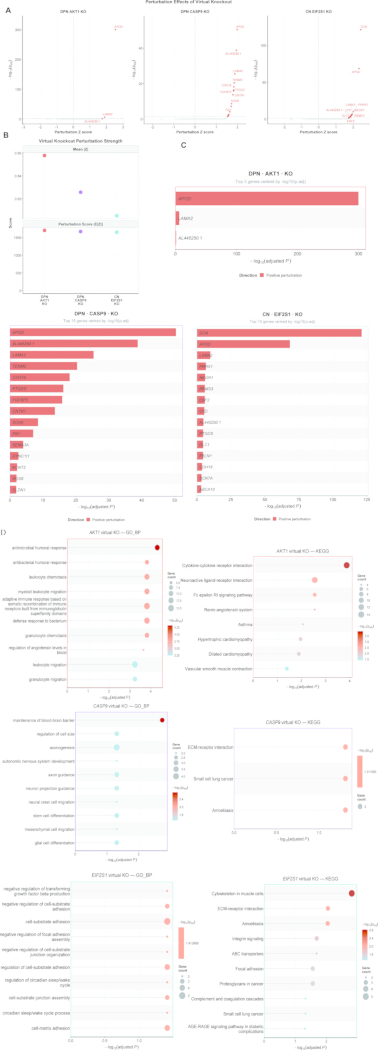
Figure 7: Virtual knockout analysis of candidate genes. (A) Volcano plots showing network-perturbed genes after virtual knockout. (B) Perturbation intensity for each network-specific virtual knockout. (C) Top perturbed genes ranked within each virtual knockout analysis. (D) Functional enrichment of perturbed genes after candidate-gene virtual knockout. Please click here to view a larger version of this figure.
Supplementary Table 1: Paraptosis-related gene set.Please click here to download this file.
Supplementary File 1: Data supporting the findings of this study.Please click here to download this file.
Diskussion
The present study hypothesizes that PDPN is associated with an altered paraptosis-related transcriptional signature in peripheral blood. Consistent with this hypothesis, 15 paraptosis-related differentially expressed genes were identified, and the paraptosis-related score was significantly elevated in the PDPN group. Through the intersection of three machine learning algorithms, namely LASSO, SVM-RFE, and random forest, AKT1, CASP9, and EIF2S1 were prioritized as candidate genes. Subsequent immune, genetic, single-cell, and computational perturbation analyses were used to further characterize the biological context of these candidates. These analyses identify associations, cell type-specific expression patterns, and predicted regulatory perturbations rather than direct mechanistic relationships. Accordingly, the biological interpretations discussed below should be regarded as hypothesis-generating and require experimental validation.
It is important to note that the designation “paraptosis-related” in this study refers to membership in a previously published literature-derived gene set and does not imply that all included genes are specific or core regulators of paraptosis. In particular, CASP3 is primarily recognized as an apoptosis-associated executioner caspase, whereas CASP9 has been implicated in both apoptotic signaling and non-canonical paraptosis-related mechanisms. Accordingly, the observed transcriptomic signature should be interpreted as an overlap with a paraptosis-associated molecular program rather than direct evidence of paraptotic cell death, which was not assessed morphologically or functionally in the present study.
The paraptosis score was significantly elevated in the PDPN group, and the 15 paraptosis-related genes were enriched in MAPK signaling, apoptosis, TNF signaling, and protein serine/threonine kinase activity, supporting the biological plausibility of the findings. Hallmark GSEA revealed significant upregulation of IL6-JAK-STAT3 signaling, TNFα signaling via NF-κB, inflammatory response, complement, and hypoxia pathways in PDPN, whereas oxidative phosphorylation and G2M checkpoint pathways were downregulated. This pattern is highly consistent with current understanding of DPN pathobiology, in which TNF-α, IL-6, and RAGE/NF-κB signaling play central roles in disease initiation and progression31. These transcriptional features are particularly meaningful in the painful subtype, where peripheral inflammation and central sensitization may coexist and sustain pathway activation. Thus, the three candidate genes identified in this study may reflect molecular processes at the interface between cellular stress and inflammation, but their biological and clinical relevance requires further validation.
The biological role of AKT1 is notably context-dependent. On the one hand, the PI3K/AKT axis generally promotes survival and repair in Schwann cells and neurons, and hyperglycemia can impair this pathway, thereby contributing to Schwann cell dysfunction32. On the other hand, AKT1 is also a key mediator of inflammatory cell migration, vascular permeability, and macrophage polarization, and is indispensable for acute inflammation and leukocyte extravasation33. In this study, AKT1 was upregulated in peripheral blood from patients with PDPN and was positively correlated with neutrophils but negatively correlated with resting memory CD4 T cells and CD8 T cells. This suggests that AKT1 may primarily reflect systemic inflammatory cell activation and vascular inflammation, rather than a simple enhancement of protective AKT signaling. In other words, AKT1 may exhibit tissue-dependent roles in PDPN: in neural support cells, AKT inactivation may be detrimental, whereas in circulating myeloid cells, transcriptional upregulation may mark inflammation-driven pathology. Our single-cell data provide tissue-level contextual evidence consistent with this possibility. AKT1 expression showed relatively lower expression in Schwann cells and fibroblasts in DPN, a pattern that may be consistent with altered AKT-related signaling in neural support cells, whereas its relatively higher expression in monocytes/macrophages was consistent with a myeloid inflammatory context. Mendelian randomization further showed that genetically predicted higher AKT1 expression was associated with increased DPN risk, providing preliminary genetic support for the relevance of AKT1 to diabetic polyneuropathy. The FinnGen outcome represented diabetic polyneuropathy rather than PDPN; therefore, this finding should not be interpreted as evidence of PDPN-specific genetic causality.
The role of CASP9 should also not be restricted to its classical function as an initiator of mitochondrial apoptosis. Previous studies have repeatedly reported increased cleaved caspase-9 under hyperglycemic injury, contributing to Schwann cell apoptosis. More recent work has shown that non-apoptotic endothelial caspase-9 can drive neurovascular inflammation and barrier dysfunction, and that the Apaf-1/caspase-9 pathway participates in the processing of axon guidance molecules34,35. This dual nature is consistent with our findings. CASP9 was increased in monocytes but decreased in SMC/pericytes, and a virtual knockout of CASP9 enriched pathways related to axonogenesis, neuron projection guidance, and ECM-receptor interaction. These results suggest that CASP9 may connect mitochondrial stress, neurovascular inflammation, and neuronal structural maintenance. Although paraptosis is usually defined as a caspase-independent form of cell death, caspase-9 can participate in apoptosis-paraptosis fate switching through ERK-mediated phosphorylation36. This does not weaken the classification of CASP9 as paraptosis-related in the present context; rather, it supports the possibility that multiple cell death programs intersect in PDPN. Given that neurovascular inflammation and barrier disruption are considered vascular permeability and endothelial/inflammatory abnormalities have been implicated in diabetic neuropathic pain, non-canonical CASP9-mediated mechanisms may have considerable pathophysiological relevance37.
EIF2S1 encodes eIF2α, a central hub of the integrated stress response (ISR) and unfolded protein response38. Its function depends more on phosphorylation at Ser51 than on transcriptional abundance. Previous studies have shown that the PERK/eIF2α/CHOP axis is activated in Schwann cell injury and that inhibition of this pathway can ameliorate DPN39. Phosphorylation of eIF2α is also closely involved in inflammatory pain regulation, directly linking this axis to the pain mechanisms of PDPN40. In this study, EIF2S1 was downregulated in PDPN peripheral blood, whereas it was upregulated in endothelial cells at the single-cell level. These findings are not contradictory; instead, they likely reflect a complex pattern in which transcriptional downregulation, phosphorylation-dependent activation, cell composition changes, and local compensatory responses coexist across tissues. Consistently, we observed reduced EIF2S1 expression in Schwann cells but significant upregulation in endothelial cells in DPN, further supporting differential regulation of the eIF2α/ISR axis between neural support cells and vascular cells.
By integrating immune infiltration and single-cell results, the three candidate genes showed distinct expression and association patterns within an immune–neural support–matrix–vascular framework. Downregulation of AKT1 and EIF2S1 in Schwann cells may reflect alterations in pro-survival and stress-adaptive pathways related to myelin maintenance and nerve repair. Upregulation of AKT1 and CASP9 in monocytes/macrophages was observed in a cellular context associated with myeloid inflammation. Reduced AKT1 and EIF2S1 expression in fibroblasts, which are involved in matrix support and ECM remodeling in peripheral nerve tissue. Increased EIF2S1 expression in endothelial cells may reflect compensatory ISR activation in response to hyperglycemia, advanced glycation end products, and hypoxia. Decreased CASP9 expression in SMC/pericytes may be related to reduced stability of the blood–nerve barrier. Previous peripheral nerve single-cell studies have shown that endoneurial fibroblasts and Schwann cells are key supportive cells for nerve regeneration, endothelial cells, pericytes, and vascular smooth muscle cells collectively maintain blood–nerve barrier integrity, and neutrophils and macrophages participate in post-injury cell–cell communication41,42. Collectively, these observations provide a hypothesis-generating framework in which immune, cellular-stress, extracellular-matrix, and vascular processes may intersect in diabetic peripheral nerve injury; whether the three candidate genes functionally coordinate these processes remains to be determined.
The scTenifoldKnk virtual knockout analysis further suggested that the three candidate genes may occupy relevant positions within the inferred gene regulatory networks, because virtual knockout of each gene was predicted to perturb predicted gene-regulatory perturbations. Notably, APOD and LAMA2 were consistently predicted to be perturbed across all three knockout conditions. ApoD is a glia-derived lipid carrier protein involved in myelin clearance, ECM remodeling, and axonal regeneration, and is essential for peripheral nerve homeostasis and injury responses43. LAMA2 encodes laminin α2, an important component of the Schwann cell basement membrane that participates in axonal sorting and myelination44. Their emergence as commonly perturbed genes suggests that the three candidate genes may be associated with a shared module involving myelin lipid handling, basement membrane/ECM stability, and permissive conditions for nerve regeneration. The pathways enriched after knockout of the three genes were also consistent with their known biology, and suggested three potentially relevant functional modules: inflammatory trafficking for AKT1, including leukocyte chemotaxis and cytokine-cytokine receptor interaction; neuronal structural control for CASP9, including axonogenesis and neuron projection guidance; and stress-adhesion homeostasis for EIF2S1, including cell-substrate adhesion, focal adhesion, and ECM-receptor interaction. These computational findings provide hypotheses regarding how dysregulation of these pathways may contribute to PDPN and require experimental validation.
From a translational perspective, this study identifies a set of peripheral blood-derived candidate genes with potential biological relevance. PDPN still lacks sensitive, reproducible blood-based molecular tools suitable for early screening. Clinical diagnosis often occurs after nerve injury has already become evident, and current treatments mainly focus on symptom control rather than disease modification45. The exploratory three-gene transcriptional signature comprising AKT1, CASP9, and EIF2S1, derived from peripheral blood and further contextualized using peripheral nerve single-cell evidence, warrants further evaluation in independent cohorts to determine whether it has diagnostic or phenotypic discriminative value in PDPN.Moreover, these genes were associated with three biological axes that may merit further mechanistic investigation: PI3K/AKT-mTOR and myeloid inflammation, mitochondrial stress–neurovascular injury, and ISR/ER stress. Whether these pathways represent actionable therapeutic targets cannot be determined from the present computational analyses and will require experimental perturbation studies and prospective clinical validation.
This study has several limitations. First, the peripheral blood bulk transcriptomic cohort was relatively small and included only patients with PDPN and healthy controls, without diabetes-only or painless-DPN comparator groups. Therefore, the observed transcriptional differences cannot distinguish changes related to diabetes itself, DPN in general, or the painful phenotype specifically, and independent external validation is required. Second, the bulk blood and single-cell peripheral nerve datasets were derived from different cohorts and tissue sources and should therefore be interpreted as cross-tissue biological contextualization rather than sample-level validation. The single-cell dataset further included only 4 DPN donors and 3 traumatic limb amputation controls, lacked pain-specific phenotyping, and used TLA tissues rather than healthy peripheral nerves. Third, immune-cell abundance was inferred using CIBERSORT and MCP-counter from the same bulk-expression dataset and therefore represents complementary computational estimates rather than independent biological validation; direct validation by differential blood counts, flow cytometry, or CyTOF is warranted. Fourth, Mendelian randomization used diabetic polyneuropathy rather than a PDPN-specific outcome and therefore cannot establish PDPN-specific genetic causality. Finally, paraptosis was inferred from transcriptomic signatures rather than directly demonstrated morphologically or functionally. Experimental validation in independent clinical cohorts and cellular or animal models is required.
Conclusion
This study provides exploratory evidence for an altered paraptosis-related transcriptional signature in the peripheral blood of patients with PDPN and prioritizes AKT1, CASP9, and EIF2S1 as candidate genes within this signature. Complementary immune, genetic, single-cell, and virtual knockout analyses provide additional biological context regarding their cell type-specific distribution and predicted regulatory context. Further independent and experimental validation is required to determine their mechanistic and clinical relevance.
Offenlegungen
The authors declare that they have no competing interests.
AUTHOR CONTRIBUTIONS:
Conceptualization, Z.Z., Z.G., and L.Z.; methodology, Z.Z., Z.G., J.L., and Q.J.; software, Z.Z. and Z.G.; validation, J.L., Q.J., A.A., and L.K.; formal analysis, Z.Z., Z.G., and C.K.; investigation, Z.Z., J.L., Q.J., A.A., L.K., C.K., and S.C.; resources, W.Y., Q.W., and L.Z.; data curation, Z.Z., Z.G., J.L., and Q.J.; writing—original draft preparation, Z.Z.; writing—review and editing, Z.G., J.L., Q.J., A.A., L.K., C.K., S.C., W.Y., Q.W., and L.Z.; visualization, Z.Z., Z.G., and C.K.; supervision, W.Y., Q.W., and L.Z.; project administration, L.Z.; funding acquisition, L.Z. All authors have read and approved the final manuscript.
Danksagungen
This study was supported by the National Natural Science Foundation of China, No. 81973628, and the Beijing Natural Science Foundation, No. L244029. The authors thank all participants included in the clinical cohort. The authors also acknowledge the GEO, eQTLGen Consortium, and FinnGen investigators for making their datasets publicly available.
Materialien
| Name | Unternehmen | Katalognummer | Kommentare |
|---|---|---|---|
| Bowtie2 | Johns Hopkins University / Bowtie2 project | v2.3.4.3 | Alignment of clean reads to the reference gene set for bulk RNA-seq quantification. |
| caret | CRAN | v7.0-1 | Machine-learning workflow used for SVM-RFE. |
| CIBERSORT / LM22 signature matrix | Stanford University / CIBERSORT | LM22 | Immune-cell deconvolution with 1,000 permutations; implemented through IOBR. |
| clusterProfiler | Bioconductor | v4.20.0 | GO/KEGG enrichment analysis and GSEA-related enrichment workflow. |
| DESeq2 | Bioconductor | v1.4.5 | Bulk RNA-seq differential-expression analysis using raw gene-level counts; size-factor normalization; primary design: ~ group. |
| DNBSEQ-T7 sequencing platform | MGI Tech Co., Ltd. | DNBSEQ-T7 | Whole-blood transcriptomic sequencing platform. |
| DoubletFinder | McGinnis Lab / GitHub | v2.0.6 | Doublet detection in the single-cell RNA-seq dataset. |
| e1071 | CRAN | v1.7-17 | Support vector machine implementation used for SVM-RFE. |
| eQTLGen Consortium | eQTLGen Consortium | Whole-blood cis-eQTL summary statistics | Exposure data for Mendelian randomization; https://www.eqtlgen.org/cis-eqtls.html; DOI: 10.1038/s41588-021-00913-z. |
| FinnGen | FinnGen Consortium | Release 12; DM_POLYNEURO | GWAS outcome data for diabetic polyneuropathy used in Mendelian randomization; https://r12.finngen.fi/. |
| Gene Ontology (GO) | Gene Ontology Consortium | GO | Functional-enrichment ontology used in GO analyses. |
| ggraph | CRAN / Thomas Lin Pedersen | v2.2.2 | Visualization of the PPI network using the Fruchterman-Reingold layout. |
| glmnet | CRAN | v5.0 | LASSO regression and 10-fold cross-validation. |
| Globin mRNA depletion workflow | BGI Genomics | N/A (sequencing-service workflow) | Depletion of abundant globin transcripts from whole-blood RNA before library preparation; specific commercial reagent/catalog number was not separately supplied to the investigators. |
| Harmony | CRAN / Immunogenomics | v2.0.5 | Batch-effect correction across single-cell samples. |
| HISAT2 | Johns Hopkins University / Center for Computational Biology | v2.1.0 | Alignment of clean bulk RNA-seq reads to the human reference genome. |
| igraph | CRAN / igraph project | v2.3.3 | Network analysis and node degree centrality. |
| IOBR | CRAN | v2.2.3 | R package used to implement CIBERSORT and MCP-counter analyses. |
| Kyoto Encyclopedia of Genes and Genomes (KEGG) | Kanehisa Laboratories | KEGG | Pathway database used for enrichment analyses. |
| MCP-counter | MCP-counter / IOBR | MCP-counter algorithm | Complementary computational estimation of immune and stromal cell abundance; implemented through IOBR. |
| Molecular Signatures Database (MSigDB) Hallmark gene sets | Broad Institute | Hallmark collection | Hallmark gene sets used for gene set enrichment analysis. |
| NCBI Gene Expression Omnibus | National Center for Biotechnology Information (NCBI) | GSE266026 | Public human peripheral-nerve single-cell RNA-seq dataset. |
| Oligo(dT) magnetic-bead mRNA enrichment workflow | BGI Genomics | N/A (sequencing-service workflow) | Poly(A)+ mRNA enrichment before library preparation; specific commercial bead/kit catalog number was not separately supplied to the investigators. |
| Paraptosis-related gene set | Zhou & Chen (Discover Oncology, 2025) | 65-gene set; DOI: 10.1007/s12672-025-02996-0 | Literature-derived paraptosis-related gene set used without addition or removal; reproduced in Supplementary Table S1. |
| PAXgene Blood RNA Tube | BD Biosciences / PreAnalytiX | Cat. No. 762165 | 2.5-mL peripheral whole-blood collection and intracellular RNA stabilization. |
| R | |||
| randomForest | CRAN | v4.7-1.2 | Random forest analysis and variable-importance assessment. |
| RSEM | Dewey Lab / University of Wisconsin-Madison | v1.3.1 | Gene-level expression quantification for bulk RNA-seq. |
| scTenifoldKnk | CRAN / Cai Lab | v1.0.3 | Virtual knockout analysis of single-cell gene-regulatory networks. |
| Seurat | Satija Lab | v5.0 | Single-cell RNA-seq quality control, normalization, scaling, PCA, clustering, UMAP, and visualization. |
| SOAPnuke | BGI-flexlab | v2.1.9 | Bulk RNA-seq raw-read filtering; parameters: -l 15 -q 0.2 -n 0.05. |
| STRING database | STRING Consortium | v12.0 | Protein-protein interaction database; Homo sapiens; combined confidence score >0.4. |
| STRINGdb | Bioconductor | v2.24.0 | R interface used to retrieve STRING protein-interaction data. |
| TwoSampleMR | MRC Integrative Epidemiology Unit / CRAN | v0.7.9 | Two-sample Mendelian randomization, including IVW and sensitivity analyses. |
Referenzen
- Kurz FT et al. Diabetic peripheral neuropathy: current epidemiology, diagnostic advances, biomarkers, and management strategies. J Diabetes Res. 2026;2026(1):e9080699.
- Preston FG, Riley DR, Azmi S, Alam U. Painful diabetic peripheral neuropathy: practical guidance and challenges for clinical management. Diabetes Metab Syndr Obes. 2023;16:1595-1612.
- Wei M et al. The role of brain mechanisms in diabetic peripheral neuropathy: recent advances and comprehensive analysis. Front Cell Neurosci. 2025;19:1637357.
- Jensen TS et al. Painful and non-painful diabetic neuropathy, diagnostic challenges and implications for future management. Brain. 2021;144(6):1632-1645.
- Lee JE, Won JC. Clinical phenotypes of diabetic peripheral neuropathy: implications for phenotypic-based therapeutics strategies. Diabetes Metab J. 2025;49(4):542-564.
- Albers JW, Pop-Busui R. Diabetic neuropathy: mechanisms, emerging treatments, and subtypes. Curr Neurol Neurosci Rep. 2014;14(8):473.
- Zhu J et al. Diabetic peripheral neuropathy: pathogenetic mechanisms and treatment. Front Endocrinol (Lausanne). 2024;14:1265372.
- Kaye AD et al. Evolving treatment strategies for neuropathic pain: a narrative review. Medicina (Kaunas). 2025;61(6):1063.
- Kunst C. Paraptosis-A distinct pathway to cell death. Int J Mol Sci. 2024;25(21):11478.
- Dehghan S, Kheshtchin N, Hassannezhad S, Soleimani M. Cell death classification: a new insight based on molecular mechanisms. Exp Cell Res. 2023;433(2):113860.
- Ye S, Cheng Z, Zhuo D, Liu S. Different types of cell death in diabetic neuropathy: a focus on mechanisms and therapeutic strategies. Int J Mol Sci. 2024;25(15):8126.
- Wu L et al. Diabetic peripheral neuropathy based on Schwann cell injury: mechanisms of cell death regulation and therapeutic perspectives. Front Endocrinol (Lausanne). 2024;15:1427679.
- Tzec-Interián JA, González-Padilla D, Góngora-Castillo EB. Bioinformatics perspectives on transcriptomics: a comprehensive review of bulk and single-cell RNA sequencing analyses. Quant Biol. 2025;13(2):e78.
- Chang X, Zheng Y, Xu K. Single-cell RNA sequencing: technological progress and biomedical application in cancer research. Mol Biotechnol. 2024;66(7):1497-1519.
- Nesari AM, MotieGhader H, Ghorbian S. Advances and challenges in single-cell RNA sequencing data analysis: a comprehensive review. Brief Bioinform. 2026;27(1):bbaf723.
- Haycock PC et al. Best (but oft-forgotten) practices: the design, analysis, and interpretation of Mendelian randomization studies. Am J Clin Nutr. 2016;103(4):965-978.
- Osorio D et al. scTenifoldKnk: an efficient virtual knockout tool for gene function predictions via single-cell gene regulatory network perturbation. Patterns (N Y). 2022;3(3):100434.
- Zhang H et al. Integrating plasma transcriptomics and brain radiomics to identify biomarkers for diabetic peripheral neuropathy. SSRN. 2024. doi:10.2139/ssrn.4851908.
- Yao X et al. Schwann cell-secreted frizzled-related protein 1 dictates neuroinflammation and peripheral nerve degeneration after neurotrauma. Cell Rep Med. 2024;5(11):101791.
- Võsa U et al. Large-scale cis- and trans-eQTL analyses identify thousands of genetic loci and polygenic scores that regulate blood gene expression. Nat Genet. 2021;53(9):1300-1310.
- Kurki MI et al. FinnGen provides genetic insights from a well-phenotyped isolated population. Nature. 2023;613(7944):508-518.
- Zhou K, Chen R. Paraptosis-related classification and risk signature for prognosis prediction and immunotherapy assessment in gastric cancer. Discov Oncol. 2025;16(1):1125.
- Newman AM et al. Robust enumeration of cell subsets from tissue expression profiles. Nat Methods. 2015;12(5):453-457.
- Becht E et al. Estimating the population abundance of tissue-infiltrating immune and stromal cell populations using gene expression. Genome Biol. 2016;17(1):218.
- Zeng D et al. IOBR: multi-omics immuno-oncology biological research to decode tumor microenvironment and signatures. Front Immunol. 2021;12:687975.
- Hemani G et al. The MR-Base platform supports systematic causal inference across the human phenome. Elife. 2018;7:e34408.
- Hao Y et al. Dictionary learning for integrative, multimodal and scalable single-cell analysis. Nat Biotechnol. 2024;42(2):293-304.
- McGinnis CS, Murrow LM, Gartner ZJ. DoubletFinder: doublet detection in single-cell RNA sequencing data using artificial nearest neighbors. Cell Syst. 2019;8(4):329-337.e4.
- Yang S et al. Decontamination of ambient RNA in single-cell RNA-seq with DecontX. Genome Biol. 2020;21(1):57.
- Liu X et al. Identification of diagnostic biomarkers for neonatal necrotizing enterocolitis via machine learning screening and single-cell virtual gene knockout validation. J Cell Commun Signal. 2026;20(2):e70081.
- Nashtahosseini Z et al. Cytokine signaling in diabetic neuropathy: a key player in peripheral nerve damage. Biomedicines. 2025;13(3):589.
- Li J, Guan R, Pan L. Mechanism of Schwann cells in diabetic peripheral neuropathy: a review. Medicine (Baltimore). 2023;102(1):e32653.
- Di Lorenzo A, Fernández-Hernando C, Cirino G, Sessa WC. Akt1 is critical for acute inflammation and histamine-mediated vascular leakage. Proc Natl Acad Sci U S A. 2009;106(34):14552-14557.
- Avrutsky MI et al. Endothelial activation of caspase-9 promotes neurovascular injury in retinal vein occlusion. Nat Commun. 2020;11(1):3173.
- Colón Ortiz C et al. Neurovascular injury associated non-apoptotic endothelial caspase-9 and astroglial caspase-9 mediate inflammation and contrast sensitivity decline. Cell Death Dis. 2022;13(11):937.
- Zheng Y, Fan H, Du Y, Dong S. Paraptosis: a methuosis-distinct vacuolar cell death. Cell Death. 2026;2(3):100017.
- Königs V et al. GPR40 activation abolishes diabetes-induced painful neuropathy by suppressing VEGF-A expression. Diabetes.2022;71(4):774-778.
- Dang TT et al. Phosphorylation of EIF2S1 (eukaryotic translation initiation factor 2 subunit alpha) is indispensable for nuclear translocation of TFEB and TFE3 during ER stress. Autophagy. 2023;19(7):2111-2142.
- Li J et al. Maltol improves peripheral nerve function by inhibiting Schwann cell apoptosis via the PERK/eIF2α/CHOP pathway and MME upregulation in diabetic peripheral neuropathy. Pharmaceuticals (Basel). 2024;17(9):1139.
- Khoutorsky A et al. eIF2α phosphorylation controls thermal nociception. Proc Natl Acad Sci U S A. 2016;113(42):11949-11954.
- Chen B et al. Single cell transcriptome data analysis defines the heterogeneity of peripheral nerve cells in homeostasis and regeneration. Front Cell Neurosci. 2021;15:624826.
- Toma JS et al. Peripheral nerve single-cell analysis identifies mesenchymal ligands that promote axonal growth. eNeuro. 2020;7(3):ENEURO.0066-20.2020.
- Ganfornina MD et al. ApoD, a glia-derived apolipoprotein, is required for peripheral nerve functional integrity and a timely response to injury. Glia. 2010;58(11):1320-1324.
- Previtali SC et al. Expression of laminin receptors in Schwann cell differentiation: evidence for distinct roles. J Neurosci. 2003;23(13):5520-5530.
- Callaghan BC et al. Diabetic neuropathy: clinical manifestations and current treatments. Lancet Neurol. 2012;11(6):521-534.
Nachdrucke und Genehmigungen
Dieser Artikel wurde veröffentlicht
Video demnächst verfügbar