This study demonstrates that ASIV pretreatment attenuates H/R-induced injury in H9c2 cells, accompanied by reduced oxidative stress and preservation of mitochondrial function. These protective effects are associated with changes in Nrf2/HO-1 signaling.
Forschungsartikel
Protective Effects of Astragaloside IV on Hypoxia/Reoxygenation-Induced H9c2 Cell Injury: Mitochondrial Function and Nrf2/HO-1 Signaling
In diesem Artikel
Zusammenfassung
Zusammenfassung
Myocardial ischemia-reperfusion injury is closely associated with oxidative stress and mitochondrial dysfunction. Astragaloside IV (ASIV), a major bioactive component of Astragalus membranaceus, has been reported to exert cardiovascular protective effects. The present study investigated the protective effects of ASIV against hypoxia/reoxygenation (H/R)-induced injury in H9c2 cells, with particular attention to mitochondrial function, oxidative stress, and Nrf2/HO-1 signaling. H9c2 cells were subjected to 12 h of hypoxia followed by 16 h of reoxygenation. Cells were pretreated with ASIV before H/R exposure. Cell viability was assessed using the CCK-8 assay. Intracellular ROS levels, SOD activity, and MDA content were evaluated to assess oxidative stress. Mitochondrial respiratory function was examined using the extracellular flux analyzer, and mitochondrial membrane potential was evaluated using JC-1. The expression of apoptosis-related proteins and proteins associated with Nrf2/HO-1 signaling was analyzed by Western blotting. H/R exposure reduced H9c2 cell viability, increased intracellular ROS levels and MDA content, decreased SOD activity, and impaired mitochondrial function. ASIV pretreatment attenuated these H/R-induced alterations. ASIV also improved mitochondrial respiratory parameters and partially restored mitochondrial membrane potential. Changes in apoptosis-related protein expression were consistent with attenuation of H/R-induced pro-apoptotic signaling. In addition, ASIV pretreatment was accompanied by changes in Nrf2 and HO-1 expression, suggesting an association between the protective effects of ASIV and Nrf2/HO-1 signaling. ASIV pretreatment attenuated H/R-induced injury in H9c2 cells, accompanied by reduced oxidative stress and preservation of mitochondrial function. The observed protective effects were associated with changes in Nrf2/HO-1 signaling. Further pathway-specific studies are required to determine whether Nrf2/HO-1 signaling is causally involved in the protective effects of ASIV.
Einleitung
Coronary heart disease (CHD), one of the most prevalent diseases with increasing incidence and mortality, contributes to the single largest cause of death in many high-income countries1. Acute myocardial infarction (MI), known as a severe type of CHD, refers to myocardial necrosis caused by ischaemia, which remains the leading cause of mortality worldwide. Currently, the treatment of acute MI is focused on restoration of perfusion to rebuild oxygen supply via medical therapy, including coronary angioplasty or coronary bypass surgery, thus contributing to reducing the degree of damaged myocardium2. Even if blood flow is restored, heart failure, resulting from acute MI, is common, with a prevalence estimated as high as 25% within 1 year after discharge. As a result, ischemia-reperfusion injury (IRI) is considered one of the most common causes of heart failure. Although the exact molecular mechanism remains unclear, oxidative stress and mitochondrial dysfunction have been reported to contribute to IRI3. Therefore, modulation of oxidative damage has become a topic of great importance to limit the damage to cardiomyocytes.
Astragalus membranaceus has been reported to exert multiple pharmacological functions within diverse diseases, including malignant tumors, diabetes4, cerebral ischemia5, myocardial fibrosis6, and myocardial ischemia7. The main effective ingredient of Astragalus membranaceus is Astragaloside IV (ASIV), which could exhibit a variety of pharmacological effects, including anti-inflammation, antioxidant, antifibrosis, and so on8. A previous study has revealed that the administration of ASIV alleviated cardiac hypertrophy via suppression of the TLR4/NF-κB signaling pathway9. Furthermore, studies have also suggested that ASIV not only reduced ROS levels and increased SOD activity by inducing the expression level of nuclear factor erythroid 2-related factor 2 (NFE2L2), thus providing protection against oxidative damage in calf small intestine epithelial cells10. However, the role of ASIV to exert protective effects in ischemia-reperfusion injury via enhancing mitochondrial homeostasis remains to be further illustrated.
Numerous studies have documented that NF-E2-related factor 2 (Nrf2) acts as an important regulator in protecting against oxidant stress. Under a quiescent environment, Nrf2 is held in the cytoplasm by binding to Kelch-like ECH-associated protein 1 (Keap1), a major suppressor of Nrf2, thus facilitating proteosomal degradation of Nrf2. However, upon exposure to stress conditions, Keap1 is inactivated, thus resulting in Nrf2 dissociating from Keap1 and translocating to the nucleus to induce the expression of multiple antioxidant genes, including heme oxygenase-1 (HO-1), NAD(P)H: quinone oxidoreductase 1 (NQO1), and glutathione S-transferase11,12. Moreover, emerging studies illustrated that Nrf2 also displayed a significant role in limiting the content of damage caused by ischemia-reperfusion injury and Ang II-induced cardiomyopathy13,14.
Currently, little is known about whether ASIV could improve mitochondrial respiration during reperfusion after ischemia. Therefore, the present study aimed to investigate the effects of ASIV on mitochondrial function and oxidative stress in H/R-treated H9c2 cells and to explore the potential involvement of Nrf2/HO-1 signaling.
Protokoll
The reagents and the equipment used in this study are listed in the Table of Materials.
Cell culture
H9c2 cells, obtained from a commercial source, were cultured in the DMEM medium supplemented with 10% fetal bovine serum and 1% penicillin/streptomycin in an incubator containing 5% CO2. As to hypoxia, cells were incubated under the hypoxic environment (1% O2) for the indicated time.
Western blotting
Treated cells were lysed using the RIPA buffer containing 1x protease inhibitor cocktail (PIC) for 30 min on ice. The proteins were obtained by centrifugation of supernatants at 12,000 x g for 15 min. Then, protein concentration was examined using a BCA protein assay kit. 5x protein loading buffer was added to the lysates, followed by denaturation in a 100 °C heat block for about 5 min. SDS-PAGE gels were employed to separate proteins, followed by transferring them onto the polyvinylidene fluoride (PVDF) membranes. Then, the membranes were immersed into 5% fat free milk for 60 min at room temperature. 1x TBST buffer was used to wash the membranes for 3 times, followed by incubating with the indicated primary antibodies overnight at 4 °C. Next, after washing with 1x TBST for 3 times, the membranes were incubated with HRP-conjugated secondary antibodies for 45 min to 60 min at room temperature (RT). The signals were detected with the enhanced chemiluminescence reagent. Additionally, proteins from the cytoplasm and nucleus were extracted by making use of a protein extraction kit following the manufacturer's protocol. Primary and secondary antibodies used in this project were listed: mouse anti-cleaved caspase-3 (1:1000), Rabbit anti-Keap 1(1:1000), Rabbit anti-HO-1(1:1000), Rabbit anti-Nrf2 (1:1000), Rabbit anti-Bax (1:1000), Rabbit anti-Cytochrome c (1:1000), Rabbit anti-Bcl-2 (1:1000), Rabbit anti-GAPDH (1:5000), goat anti-rabbit IgG H&L (HRP) (1:1500), and Anti-mouse IgG, HRP-linked Antibody (1:5000).
Cell Counting Kit-8 assay
Briefly, H9c2 cells were seeded into 96-well plates at a density of 3 × 10⁴ cells per well. After 24 h of culture, cells were treated with Astragaloside IV at varying concentrations from 0 μM to 200 μM. Then, the viability of H9c2 cells was examined by adding CCK-8 solution at the indicated time points. After 60 min of incubation, the OD value was detected with a microplate reader at 450 nm.
Measurement of reactive oxygen species
H9c2 cells were subjected to 12 h of hypoxia followed by 16 h of reoxygenation (H12/R16). Where indicated, cells were pretreated with 100 μM ASIV or 0.60 μg/mL propranolol (approximately 2 μM) for 24 h before H/R exposure. Intracellular ROS levels were assessed using H2DCFDA. Following the indicated treatments, cells were washed with prewarmed PBS and incubated with H2DCFDA. After staining, cells were collected by trypsinization and washed with PBS. Fluorescence intensity was measured using a flow cytometer, and the data were analyzed using the compatible software.
Mitochondrial respiration analysis
An extracellular flux bioanalyzer was employed to assess mitochondrial respiration in H9c2 cells. Briefly, cells were seeded into the analyzer plates at a density of 2 × 10⁴ cells per well and divided into four groups: control, H12/R16, H12/R16 + ASIV, and H12/R16 + propranolol. For the treatment groups, cells were pretreated with 100 μM ASIV or 0.60 μg/mL propranolol (approximately 2 μM) for 24 h before H/R exposure. Prior to the assay, cells were washed twice with minimal assay medium containing 25 mM glucose and 1 mM sodium pyruvate and then equilibrated for 1 h in a CO2-free incubator. After measurement of the basal oxygen consumption rate (OCR), 1 μM oligomycin, 0.4 μM carbonyl cyanide-4-(trifluoromethoxy) phenylhydrazone (FCCP), and a mixture of 2 μM rotenone and 1 μM antimycin A were sequentially injected. OCR was continuously monitored following each injection to assess mitochondrial respiratory function. Basal respiration, ATP-linked respiration, maximal respiration, spare respiratory capacity, and proton leak were subsequently calculated from the OCR measurements.
Total Superoxide Dismutase (SOD) assay kit
Total superoxide dismutase activity was determined by making use of an SOD assay kit following the manufacturer's protocol. Cells were plated and divided into 4 groups using the previous method. Then, cells were collected by centrifugation, followed by lysing the cells and centrifugation to obtain supernatant. The reaction was initiated by adding 20 μL of xanthine oxidase, and further incubated for 30 min at RT. The OD value was examined with a microplate reader at 450 nm. The corresponding standard curve was employed to calculate the final concentration of SOD.
Malondialdehyde content analysis
The production of MDA was calculated using the previous method15. A commercially available MDA assay kit was employed to assess the MDA content. The OD value was examined with a microplate reader at 532 nm.
Mitochondrial potential measurement
Mitochondrial membrane potential (ΔΨm) was assessed using JC-1 staining. H9c2 cells were seeded into 6-well plates at a density of 5 × 10⁵ cells per well and assigned to four groups: control, H12/R16, H12/R16 + ASIV, and H12/R16 + propranolol. Cells in the treatment groups were pretreated with 100 μM ASIV or 0.60 μg/mL propranolol (approximately 2 μM) for 24 h before H/R exposure. Following the indicated treatments, cells were incubated with the JC-1 probe for 30 min in the dark and then washed three times to remove excess probe. Red and green JC-1 fluorescence signals were measured using a spectrofluorometer. Mitochondrial membrane potential was quantified as the ratio of red to green JC-1 fluorescence intensity, with a lower red/green fluorescence ratio indicating mitochondrial membrane depolarization.
Molecular docking
Molecular docking was performed as an exploratory computational analysis to evaluate the potential interaction between ASIV and the Kelch domain of Kelch-like ECH-associated protein 1 (Keap1). The crystal structure containing the Keap1 Kelch domain in complex with an Nrf2-derived peptide was obtained from the Protein Data Bank (PDB ID: 2FLU), and the Keap1 Kelch domain was used as the receptor for docking with ASIV.
Docking calculations were performed using AutoDock 4.2 and AutoDock Vina. A grid box was generated to encompass the Keap1 Kelch-domain binding region, with a grid spacing of 1.0 A. Docking poses were evaluated according to the predicted binding energy and interaction geometry, and the selected docking pose was visualized to examine the predicted interactions between ASIV and residues within the Keap1 binding pocket. Because molecular docking provides a computational prediction rather than experimental evidence of target engagement, the docking analysis was used only as exploratory, supportive information.
Statistical analysis
All experiments were independently repeated three times (n = 3). Data are presented as the mean ± SD. Statistical analyses were performed using statistical and graphing software. For comparisons involving multiple experimental groups, one-way analysis of variance (ANOVA) followed by Dunnett's multiple-comparisons test was used. A P value < 0.05 was considered statistically significant.
Ergebnisse
ASIV promoted H/R induced-H9c2 cells viability
In order to document the therapeutic activity of ASIV, CCK-8 analysis was employed to examine cell viability. In normoxia, compared to the control, although there was no obvious effect on the viability of H9c2 cells treated with ASIV at concentrations ranging from 5 μM to 50 μM, an increased cell viability could be detected at concentrations of 100 μM and 150 μM. However, it was worth noting that a negative effect was found when H9c2 cells were treated with 200 μM ASIV (Figure 1A). Then, the therapeutic potential of ASIV in the H9c2 H/R model was assessed. CCK-8 analysis revealed that cellular proliferation in the H/R groups was significantly decreased in comparison with the control. Additionally, ASIV treatment at concentrations of 50 μM, 100 μM, and 150 μM contributed to the increased cell viability (Figure 1B). Taken together, these studies suggested that ASIV could promote H/R induced H9c2 cell viability.
Anti-oxidative effects of ASIV on H/R induced H9c2 cells
According to previous reports, reactive oxygen species (ROS) induced oxidative stress plays a key role in the development of IRI. Therefore, the production of ROS was assessed in ASIV-treated H9c2 cells. First, propranolol, widely used to treat cardiovascular disorders, has been reported to suppress the production of ROS, thus used as a positive control16. As shown in Figure 2A, H/R treatment remarkably induced ROS levels in H9c2 cells, which could be relieved either by ASIV treatment or propranolol treatment, thus indicating that ASIV may play a vital role in protecting H9c2 cells against oxidative stress. Furthermore, SOD and MDA content have also been studied. Following exposure to H/R led to a reduced SOD activity, while the decreased SOD activity could be elevated by ASIV or propranolol in H9c2 cells (Figure 2B). Additionally, MDA content was remarkably increased in the H12/R16 group, which was alleviated by using ASIV or propranolol treatment (Figure 2C). As a result, it was documented that ASIV alleviated H/R induced oxidative stress via deregulation of ROS production, MDA content, and induction of SOD activity, thus contributing to promoting cell viability.
ASIV pretreatment altered apoptosis-related protein expression in H/R-treated H9c2 cells
To investigate the effects of ASIV on apoptosis-related molecular changes following H/R injury, the expression of Bcl-2, cleaved caspase-3, Bax, and cytochrome c was examined by Western blotting. Compared with the control group, H12/R16 exposure decreased Bcl-2 expression and increased cleaved caspase-3, Bax, and cytochrome c expression. ASIV pretreatment attenuated these H/R-induced changes, as evidenced by increased Bcl-2 expression and decreased cleaved caspase-3, Bax, and cytochrome c expression compared with the H12/R16 group (Figure 3). These findings indicate that ASIV pretreatment modulated H/R-induced changes in apoptosis-related protein expression in H9c2 cells.
Protective effects of ASIV on the function of mitochondria in H/R induced H9c2 cells
To determine whether the protective effect of ASIV on H/R induced H9c2 cells was associated with improved mitochondrial function, oxygen consumption rate (OCR) was assessed using an extracellular flux bioanalyzer. Four experimental groups were included: control, H12/R16, H12/R16 + ASIV, and H12/R16 + propranolol, with propranolol serving as a positive control.
Compared with the control group, H/R exposure decreased basal respiration, ATP-linked respiration, maximal respiration, and spare respiratory capacity, while increasing proton leak (Figure 4A-F). Pretreatment with ASIV attenuated these H/R induced alterations, as evidenced by increased basal respiration, ATP-linked respiration, maximal respiration, and spare respiratory capacity, together with decreased proton leak compared with the H12/R16 group. Propranolol pretreatment, used as a positive control, similarly ameliorated H/R induced mitochondrial respiratory dysfunction. Collectively, these findings indicate that ASIV pretreatment attenuated H/R induced impairment of mitochondrial respiratory function in H9c2 cells.
ASIV improved H/R induced impaired mitochondrial function
To further determine whether ASIV attenuated H/R induced mitochondrial dysfunction, mitochondrial membrane potential (ΔΨm) was assessed using JC-1 staining and quantified as the red/green fluorescence ratio. H/R exposure resulted in a decreased JC-1 red/green fluorescence ratio compared with the control group, indicating mitochondrial membrane depolarization. In contrast, ASIV pretreatment increased the red/green fluorescence ratio compared with the H/R group, indicating attenuation of the H/R induced loss of mitochondrial membrane potential (Figure 5).
ASIV alleviated H/R induced oxidative stress, accompanied by changes in Nrf2/HO-1 signaling
To further explore the molecular changes associated with the protective effects of ASIV, the expression of Keap1, Nrf2, and HO-1 was examined by Western blotting. H/R exposure was associated with increased Keap1 expression and decreased Nrf2 and HO-1 expression, whereas ASIV pretreatment attenuated these H/R-associated changes (Figure 6E). These findings suggest that the protective effects of ASIV in H/R-treated H9c2 cells are associated with changes in Keap1/Nrf2/HO-1 signaling.
Molecular docking was additionally performed as an exploratory computational analysis. Re-examination of the protein structure used in the original docking analysis confirmed that the receptor was the Keap1 Kelch domain (PDB ID: 2FLU), rather than Nrf2, as incorrectly described in the original manuscript. The predicted docking pose showed interactions between ASIV and residues within the Keap1 binding pocket (Figure 6A-D), with a calculated binding energy of -3.58 kcal/mol. Given the modest predicted binding energy and the absence of experimental target-binding validation, this docking result was interpreted cautiously and was not considered evidence of direct or functionally relevant binding.
DATA AVAILABILITY:
All raw data generated and analyzed during this study are provided in Supplementary File 1.
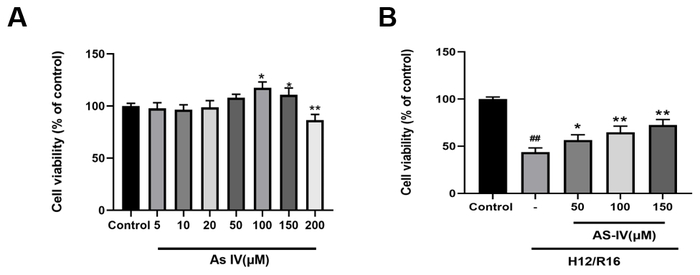
Figure 1: Effects of ASIV and H/R exposure on H9c2 cell viability. (A) Effects of different concentrations of ASIV (5 μM, 10 μM, 20 μM, 50 μM, 100 μM, 150, and 200 μM) on H9c2 cell viability under normoxic conditions. (B) Effects of ASIV pretreatment at the indicated concentrations (50 μM, 100 μM, and 150 μM) on the viability of H9c2 cells subjected to 12 h of hypoxia followed by 16 h of reoxygenation (H12/R16). Cell viability was assessed using the CCK-8 assay and expressed as a percentage of the control group. Data are presented as mean ± SD from three independent experiments (n = 3). Statistical comparisons were performed using one-way ANOVA followed by Dunnett's multiple-comparisons test. *P < 0.05 and **P < 0.01 versus the corresponding untreated group; ##P < 0.01 versus the control group. Please click here to view a larger version of this figure.
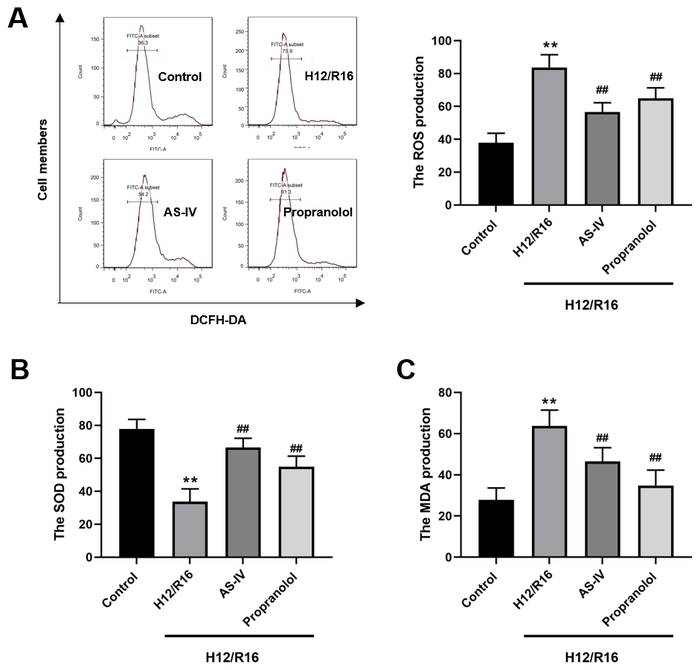
Figure 2: ASIV pretreatment attenuated H/R-induced oxidative stress in H9c2 cells. (A) Intracellular ROS levels were assessed using DCFH-DA, with representative fluorescence-intensity distributions shown for the control, H12/R16, H12/R16 + ASIV, and H12/R16 + propranolol groups; the corresponding quantitative analysis is shown on the right. (B) SOD activity. (C) MDA content. Data are presented as mean ± SD from three independent experiments (n = 3). Statistical comparisons were performed using one-way ANOVA followed by Dunnett's multiple-comparisons test. **P < 0.01 versus the control group; ##P < 0.01 versus the H12/R16 group. Please click here to view a larger version of this figure.
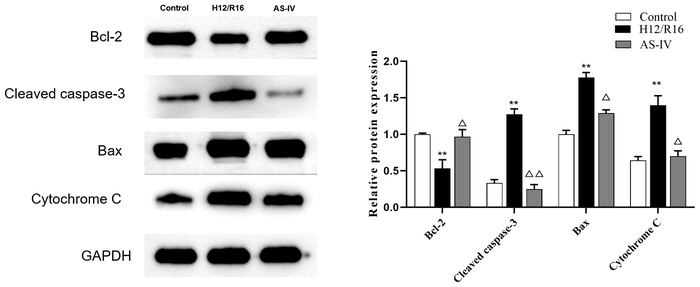
Figure 3: Effects of ASIV pretreatment on apoptosis-related protein expression in H/R-treated H9c2 cells. Representative Western blots and densitometric analyses of Bcl-2, cleaved caspase-3, Bax, and cytochrome c protein expression in the control, H12/R16, and H12/R16 + ASIV groups. GAPDH was used as the loading control, and protein expression was normalized to GAPDH. Data are presented as mean ± SD from three independent experiments (n = 3). Statistical comparisons were performed using one-way ANOVA followed by Dunnett's multiple-comparisons test. **P < 0.01 versus the control group; △P < 0.05 and △△P < 0.01 versus the H12/R16 group. Please click here to view a larger version of this figure.
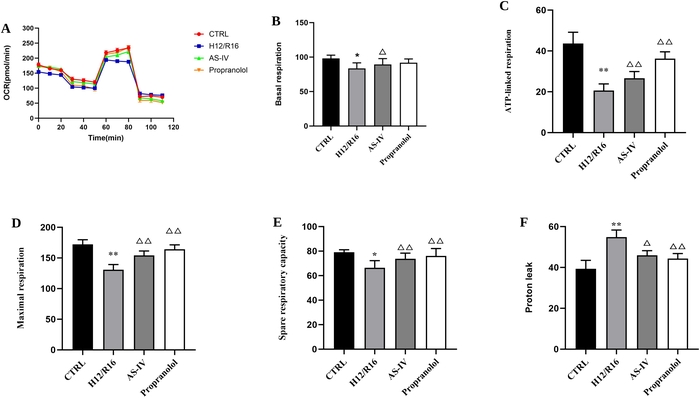
Figure 4: ASIV pretreatment attenuated H/R-induced impairment of mitochondrial respiratory function in H9c2 cells. Mitochondrial respiration was assessed using the extracellular flux analyzer in the control (CTRL), H12/R16, H12/R16 + ASIV, and H12/R16 + propranolol groups. (A) Representative oxygen consumption rate (OCR) profiles during the mitochondrial stress test. (B) Basal respiration. (C) ATP-linked respiration. (D) Maximal respiration. (E) Spare respiratory capacity. (F) Proton leak. Data for the derived respiratory parameters are presented as mean ± SD from three independent experiments (n = 3). Statistical comparisons were performed using one-way ANOVA followed by Dunnett's multiple-comparisons test. *P < 0.05 and **P < 0.01 versus the control group; △P < 0.05 and △△P < 0.01 versus the H12/R16 group. Please click here to view a larger version of this figure.
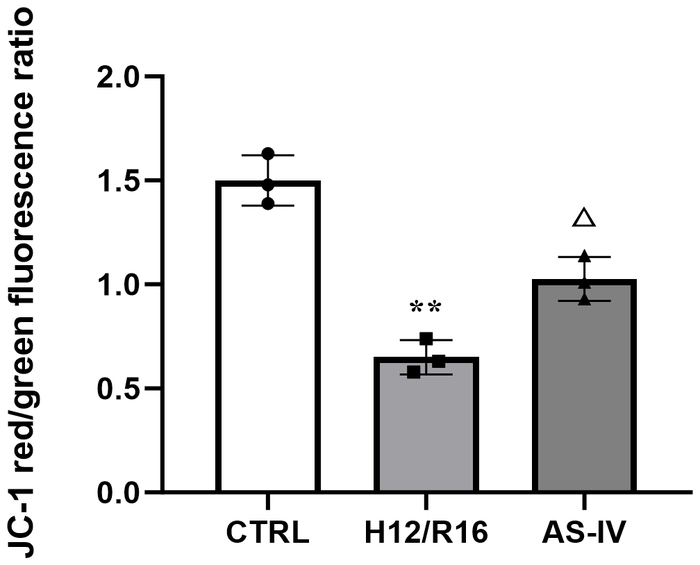
Figure 5: Effects of ASIV pretreatment on JC-1 fluorescence in H/R-treated H9c2 cells. Mitochondrial membrane potential (ΔΨm) was assessed using the JC-1 assay and quantified as the red/green fluorescence intensity ratio in the control (CTRL), H12/R16, and H12/R16 + ASIV groups. H12/R16 exposure significantly decreased the JC-1 red/green fluorescence ratio compared with the control group, whereas ASIV pretreatment partially restored the ratio compared with the H12/R16 group. Data are presented as mean ± SD from three independent experiments (n = 3). Statistical comparisons were performed using one-way ANOVA followed by Dunnett's multiple-comparisons test. **P < 0.01 versus the control group; △P < 0.05 versus the H12/R16 group. Please click here to view a larger version of this figure.
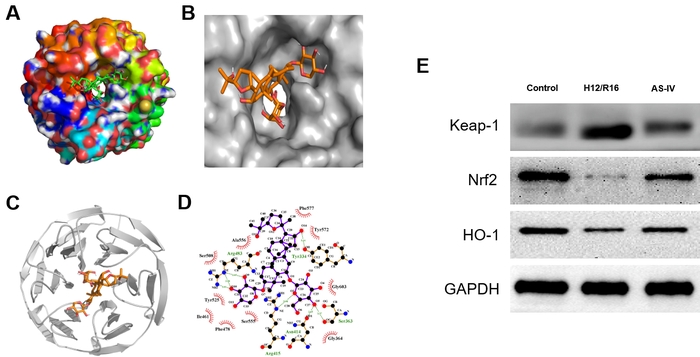
Figure 6: ASIV pretreatment was associated with changes in Keap1/Nrf2/HO-1 signaling in H/R-treated H9c2 cells. (A-C) Molecular docking analysis illustrating the predicted interaction between ASIV and the Keap1 Kelch domain (PDB ID: 2FLU). (A) Overall molecular-surface representation of the predicted docking pose. (B) Enlarged view of ASIV within the predicted Keap1 binding pocket. (C) Ribbon representation of the Keap1 Kelch domain showing the predicted position of ASIV within the binding region. (D) Two-dimensional interaction map showing the predicted interactions between ASIV and residues within the Keap1 binding pocket. (E) Representative Western blots showing Keap1, Nrf2, and HO-1 protein expression in the control, H12/R16, and H12/R16 + ASIV groups. GAPDH was used as the loading control. Western blot experiments were independently repeated three times (n = 3), and representative blots are shown. Please click here to view a larger version of this figure.
Supplementary File 1: All raw data generated and analyzed during this study.Please click here to download this file.
Diskussion
Restoration of coronary blood flow is essential for limiting myocardial damage following acute myocardial infarction; however, reperfusion itself may induce additional myocardial injury. Myocardial ischemia-reperfusion injury (IRI) involves multiple pathological processes, including oxidative stress, mitochondrial dysfunction, inflammation, and cell death, and remains an important challenge in myocardial protection17. In the present study, an H9c2 hypoxia/reoxygenation (H/R) model was used to investigate the protective effects of astragaloside IV (ASIV), with particular attention to oxidative stress, mitochondrial function, apoptosis-related protein expression, and Nrf2/HO-1 signaling. H/R exposure reduced cell viability, increased intracellular ROS levels and MDA content, decreased SOD activity, induced changes in apoptosis-related protein expression, and impaired mitochondrial function. ASIV pretreatment attenuated these H/R-induced alterations, improved mitochondrial respiratory function, and partially restored mitochondrial membrane potential. In addition, ASIV pretreatment was accompanied by changes in the expression of Keap1, Nrf2, and HO-1 proteins. Taken together, these findings suggest that the protective effects of ASIV against H/R-induced injury in H9c2 cells are associated with the preservation of mitochondrial function, the attenuation of oxidative stress, the modulation of apoptosis-related protein expression, and changes in Nrf2/HO-1 signaling.
ASIV is one of the major bioactive components of Astragalus membranaceus and has been reported to exert multiple pharmacological effects, including antioxidant, anti-inflammatory, and antifibrotic activities18. Oxidative stress is an important component of ischemia-reperfusion injury and can contribute to different forms of cell death during tissue injury19. Excessive ROS accumulation during ischemia and subsequent reperfusion can overwhelm endogenous antioxidant defenses and promote oxidative damage. Previous experimental evidence has also demonstrated that attenuation of ROS accumulation is associated with myocardial protection during ischemia-reperfusion20. Consistent with these observations, H/R exposure in the present study increased intracellular ROS levels and MDA content while decreasing SOD activity, indicating enhanced oxidative stress in H9c2 cells. ASIV pretreatment attenuated these alterations, as evidenced by decreased intracellular ROS levels and MDA content and increased SOD activity compared with the H/R group. These findings support an association between attenuation of oxidative stress and the cytoprotective effects of ASIV in the H9c2 H/R model.
Mitochondria play central roles in cellular energy metabolism and redox homeostasis and are particularly susceptible to ischemia-reperfusion-associated injury. Mitochondrial dysfunction can disrupt ATP production, increase proton leak, and contribute to excessive ROS generation, thereby aggravating cellular injury during ischemia and reperfusion. To characterize mitochondrial function, mitochondrial respiration was evaluated using the extracellular flux analyzer. H/R exposure decreased basal respiration, ATP-linked respiration, maximal respiration, and spare respiratory capacity while increasing proton leak, consistent with impaired mitochondrial respiratory function. In contrast, ASIV pretreatment attenuated these H/R-induced alterations. Propranolol, which was included as a positive-control treatment, similarly ameliorated H/R-induced mitochondrial respiratory dysfunction. These results provide functional evidence that preservation of mitochondrial respiration is associated with the cytoprotective effects observed following ASIV pretreatment.
The JC-1 findings further supported the effects of ASIV on mitochondrial function. Loss of mitochondrial membrane potential (ΔΨm) is an important feature of mitochondrial dysfunction and is closely associated with mitochondria-related cell-death processes. In the present study, H/R exposure decreased the JC-1 red/green fluorescence ratio, indicating mitochondrial membrane depolarization, whereas ASIV pretreatment partially restored this ratio. In parallel, Western blotting showed that H/R exposure decreased Bcl-2 expression and increased Bax, cleaved caspase-3, and cytochrome c expression, whereas ASIV pretreatment attenuated these changes. These proteins are closely associated with apoptotic signaling; however, direct apoptosis assays, such as Annexin V/PI staining, TUNEL analysis, or caspase activity measurements, were not performed in the present study. Therefore, these findings should be interpreted as evidence that ASIV modulates H/R-induced changes in apoptosis-related protein expression rather than as a direct demonstration of reduced apoptosis. Together, the mitochondrial respiration, membrane potential, and apoptosis-related protein findings suggest that maintenance of mitochondrial homeostasis may contribute to the protective effects of ASIV in this experimental model.
Nrf2 is an important regulator of cellular antioxidant responses. Under basal conditions, Nrf2 is negatively regulated by Keap1, whereas oxidative or electrophilic stress can alter Keap1-dependent regulation of Nrf2 and promote the transcription of antioxidant and cytoprotective genes21. HO-1 is an important downstream component of the Nrf2-regulated antioxidant response and contributes to cellular defense against oxidative stress22. In the present study, H/R exposure was associated with increased Keap1 expression and decreased Nrf2 and HO-1 expression, whereas ASIV pretreatment attenuated these H/R-associated changes. Together with the observed reductions in intracellular ROS levels and MDA content and the restoration of SOD activity, these findings indicate an association between ASIV-induced cytoprotection and changes in Keap1/Nrf2/HO-1 signaling.
Molecular docking was performed as an exploratory computational analysis to further examine the potential interaction between ASIV and the Keap1 Kelch domain. Re-examination of the protein structure confirmed that the receptor used for docking was the Keap1 Kelch domain (PDB ID: 2FLU), rather than Nrf2. The predicted docking pose placed ASIV within the Keap1 binding region, with a calculated binding energy of -3.58 kcal/mol. Given the modest predicted binding energy and the absence of experimental target-binding validation, this computational result should not be interpreted as evidence of strong, direct, or functionally relevant binding between ASIV and Keap1. Rather, the docking analysis provides exploratory information that may guide future studies examining whether ASIV directly interacts with components of the Keap1/Nrf2 regulatory system.
Importantly, the present data do not establish that Keap1/Nrf2/HO-1 signaling is causally required for the protective effects of ASIV. Although ASIV pretreatment was accompanied by changes in Keap1, Nrf2, and HO-1 protein expression, pathway-specific loss-of-function experiments were not performed. In particular, pharmacological inhibition or genetic knockdown of Nrf2 or HO-1 was not used to determine whether disruption of this pathway abolishes the protective effects of ASIV. Moreover, the present study did not directly assess Nrf2 nuclear translocation. Therefore, the current findings support an association between ASIV treatment and changes in Keap1/Nrf2/HO-1 signaling but do not establish pathway activation or causal mediation. Future studies incorporating pathway-specific inhibitors and genetic loss-of-function approaches will be required to determine the causal contribution of Keap1/Nrf2/HO-1 signaling to the effects of ASIV.
Several limitations of the present study should be acknowledged. First, the experiments were performed exclusively in H9c2 rat cardiomyoblasts. Although H9c2 cells provide a useful in vitro model for investigating cellular responses to H/R, they differ from mature primary cardiomyocytes, and findings obtained from this cell line should not be directly extrapolated to myocardial ischemia-reperfusion injury in vivo. Second, the in vitro H/R model reproduces only selected cellular aspects of ischemia-reperfusion injury and cannot fully recapitulate the complex multicellular, inflammatory, hemodynamic, and systemic responses occurring in the intact heart. Third, direct apoptosis assays were not performed; therefore, the observed changes in Bcl-2, Bax, cleaved caspase-3, and cytochrome c should be interpreted as changes in apoptosis-related protein expression rather than direct evidence of altered apoptotic rates. Fourth, pathway-specific pharmacological inhibition or genetic manipulation was not performed, and Nrf2 nuclear translocation was not directly evaluated. Therefore, the causal role of Keap1/Nrf2/HO-1 signaling and its relationship with mitochondrial protection remains to be established. Finally, the present in vitro findings are insufficient to establish the therapeutic efficacy or clinical relevance of ASIV in coronary heart disease. Further validation in primary cardiomyocytes and appropriate in vivo models of myocardial ischemia-reperfusion injury is required before the translational relevance of these findings can be determined.
In conclusion, the present study demonstrates that ASIV pretreatment attenuates H/R-induced injury in H9c2 cells, accompanied by reduced oxidative stress, preservation of mitochondrial respiratory function, partial restoration of mitochondrial membrane potential, and modulation of apoptosis-related protein expression. ASIV pretreatment was also associated with changes in Keap1/Nrf2/HO-1 signaling. However, the present findings do not establish a causal role for this signaling pathway or direct inhibition of apoptosis. Further studies using pathway-specific pharmacological and genetic approaches, direct apoptosis assays, and more physiologically relevant experimental models are required to clarify the underlying mechanisms and potential translational relevance of ASIV.
Offenlegungen
The authors declare no conflicts of interest related to this work.
Author Contribution:
Liurong Zhou and Zhiyi Rong conceived and designed the study. Lihua Tan, Yu Huang, Xiyu Huang, and Liang Zhang performed the experiments and collected the data. Liurong Zhou, Lihua Tan, and Zhiyi Rong analyzed and interpreted the data. Liurong Zhou drafted the manuscript. Zhiyi Rong critically revised the manuscript for important intellectual content. All authors reviewed and approved the final version of the manuscript.
Danksagungen
The authors thank the First Affiliated Hospital of Hunan University of Chinese Medicine for providing institutional support for this study. This work was supported by the Research Program of Hunan Provincial Health Commission (Grant No. 202209023657).
Materialien
| Name | Unternehmen | Katalognummer | Kommentare |
|---|---|---|---|
| 5× protein loading buffer | Biosciences | P013 | Protein sample denaturation buffer |
| Anti-mouse IgG, HRP-linked Antibody | Cell Signaling | 7076 | Secondary antibody, dilution:1:5000 |
| Astragaloside IV | — | — | Drug compound, concentration range: 0-200 μM |
| AutoDock 4.2 | Open-source | — | Software for molecular docking |
| AutoDock Vina | Open-source | — | Software for molecular docking |
| BCA protein assay kit | ThermoFisher | 23227 | Determination of protein concentration |
| CCK-8 assay kit | Beyotime | C0038 | Detection of cell viability |
| Cytoplasmic & Nuclear Protein Extraction Kit | Beyotime | P0027 | Separate extraction of cytoplasmic and nuclear protein |
| DMEM medium | ThermoFisher | 11965118 | Cell culture medium for H9c2 cells |
| Enhanced chemiluminescence reagent | ThermoFisher | 32109 | ECL reagent for Western-blot signal detection |
| FACSCanto II Analyzer | BD Biosciences | — | Flow cytometer for ROS fluorescence detection |
| Fetal bovine serum (FBS) | BI | 04-001-1ACS | Supplement for cell culture |
| FlowJo software | FlowJo | — | Flow cytometry data analysis |
| goat anti-rabbit IgG H&L (HRP) | Abcam | ab205718 | Secondary antibody, dilution:1:1500 |
| GraphPad Prism 8 | GraphPad Software | Version 8 | Statistical analysis and graph plotting |
| H2DCFDA | Thermo Fisher Scientific | D399 | Probe for intracellular reactive oxygen species (ROS) detection |
| H9c2 cells | Chinese Academy of Sciences Cell Bank (Shanghai, China) | — | Rat cardiomyoblast cell line |
| JC-1 Mitochondrial Membrane Potential Probe | Beyotime | C2006 | Immunofluorescence probe for mitochondrial potential |
| Malondialdehyde (MDA) assay kit | Nanjing Jiancheng Bioengineering Institute | A003-1-2 | Measure MDA content for lipid peroxidation |
| mouse anti-cleaved caspase-3 | Santa Cruz | sc-271759 | Primary antibody, dilution:1:1000 |
| Penicillin/streptomycin | ThermoFisher | 15140122 | Antibiotic for cell culture |
| Propranolol | — | — | Positive control compound |
| Protease inhibitor cocktail (PIC) | Sigma | P8340 | Protease inhibitor, 1× working concentration |
| Protein Data Bank (PDB) | RCSB | — | Source of protein crystal structures |
| Rabbit anti-Bax | Cell Signaling | 2772S | Primary antibody, dilution:1:1000 |
| Rabbit anti-Bcl-2 | Abcam | ab196495 | Primary antibody, dilution:1:1000 |
| Rabbit anti-Cytochrome c | Cell Signaling | 11940 | Primary antibody, dilution:1:1000 |
| Rabbit anti-GAPDH | Cell Signaling | 2118 | Primary antibody, dilution:1:5000, loading control |
| Rabbit anti-HO-1 | Cell Signaling | 43966 | Primary antibody, dilution:1:1000 |
| Rabbit anti-KEAP1 | Cell Signaling | 8047S | Primary antibody, dilution:1:1000 |
| Rabbit anti-Nrf2 | Cell Signaling | 20733S | Primary antibody, dilution:1:1000 |
| RIPA lysis buffer | Cell Signaling | 9806 | Total protein extraction for Western blotting |
| Seahorse XF24 extracellular flux bioanalyzer | Seahorse (Agilent) | — | Detect mitochondrial respiration, OCR measurement |
| Total Superoxide Dismutase (SOD) Assay Kit | Cayman | 706002 | Detect total SOD enzyme activity |
Referenzen
- Brundtland GH. From the World Health Organization. Reducing risks to health, promoting healthy life. JAMA. 2002;288(16):1974.
- Gonzalez-Montero J, Brito R, Gajardo AI, Rodrigo R. Myocardial reperfusion injury and oxidative stress: therapeutic opportunities. World J Cardiol. 2018;10(9):74-86.
- Maimaiti A, et al. Association of platelet-to-lymphocyte count ratio with myocardial reperfusion and major adverse events in patients with acute myocardial infarction: a two-centre retrospective cohort study. BMJ Open. 2019;9(9):e025628.
- Chen G, et al. Jia-wei-jiao-tai-wan ameliorates type 2 diabetes by improving beta cell function and reducing insulin resistance in diabetic rats. BMC Complement Altern Med. 2017;17(1):507.
- Pan R, et al. The combination of Astragalus membranaceus extract and ligustrazine to improve the inflammation in rats with thrombolytic cerebral ischemia. Int J Immunopathol Pharmacol. 2019;33:2058738419869055.
- Qu H, et al. Luhong formula inhibits myocardial fibrosis in a paracrine manner by activating the gp130/JAK2/STAT3 pathway in cardiomyocytes. J Ethnopharmacol. 2017;202:28-37.
- Liu D, Chen L, Zhao J, Cui K. Cardioprotection activity and mechanism of astragalus polysaccharide in vivo and in vitro. Int J Biol Macromol. 2018;111:947-952.
- Gong L, et al. Astragaloside IV protects rat cardiomyocytes from hypoxia-induced injury by down-regulation of miR-23a and miR-92a. Cell Physiol Biochem. 2018;49(6):2240-2253.
- Yang J, et al. Astragaloside IV attenuates inflammatory cytokines by inhibiting TLR4/NF-κB signaling pathway in isoproterenol-induced myocardial hypertrophy. J Ethnopharmacol. 2013;150(3):1062-1070.
- Wang Y, et al. Astragaloside IV protects against oxidative stress in calf small intestine epithelial cells via NFE2L2-antioxidant response element signaling. Int J Mol Sci. 2019;20(24):6131.
- Itoh K, Mimura J, Yamamoto M. Discovery of the negative regulator of Nrf2, Keap1: a historical overview. Antioxid Redox Signal. 2010;13(11):1665-1678.
- Horie Y, et al. Molecular basis for the disruption of Keap1-Nrf2 interaction via hinge & latch mechanism. Commun Biol. 2021;4(1):576.
- Katsumata Y, et al. Endogenous prostaglandin D2 and its metabolites protect the heart against ischemia-reperfusion injury by activating Nrf2. Hypertension. 2014;63(1):80-87.
- Li J, et al. Up-regulation of p27(Kip1) contributes to Nrf2-mediated protection against angiotensin II-induced cardiac hypertrophy. Cardiovasc Res. 2011;90(2):315-324.
- Zhu C, Hu W, Wu H, Hu X. No evident dose-response relationship between cellular ROS level and its cytotoxicity--a paradoxical issue in ROS-based cancer therapy. Sci Rep. 2014;4:5029.
- Jia X, Zhang L, Mao X. S-propranolol protected H9c2 cells from ischemia/reperfusion-induced apoptosis via downregulation of RACK1 gene. Int J Clin Exp Pathol. 2015;8(9):10335-10344.
- Hausenloy DJ, Yellon DM. Myocardial ischemia-reperfusion injury: a neglected therapeutic target. J Clin Invest. 2013;123(1):92-100.
- Li L, Hou X, Xu R, Liu C, Tu M. Research review on the pharmacological effects of astragaloside IV. Fundam Clin Pharmacol. 2017;31(1):17-36.
- Li H, Xia Z, Chen Y, Qi D, Zheng H. Mechanism and therapies of oxidative stress-mediated cell death in ischemia reperfusion injury. Oxid Med Cell Longev. 2018;2018:2910643.
- Yao X, et al. Effects of glucose concentration on propofol cardioprotection against myocardial ischemia reperfusion injury in isolated rat hearts. J Diabetes Res. 2015;2015:592028.
- Da Costa RM, et al. Nrf2 as a potential mediator of cardiovascular risk in metabolic diseases. Front Pharmacol. 2019;10:382.
- Loboda A, Damulewicz M, Pyza E, Jozkowicz A, Dulak J. Role of Nrf2/HO-1 system in development, oxidative stress response and diseases: an evolutionarily conserved mechanism. Cell Mol Life Sci. 2016;73(17):3221-3247.