La plataforma propuesta de automatización de aceptación de baja tensión integra el Internet de las Cosas (IoT), la orquestación visual de flujos de trabajo, computación perimetral y en la nube, ingeniería de características y aprendizaje automático para automatizar las pruebas de aceptación de sistemas de baja tensión (LV). La plataforma permite la detección inteligente de fallas, toma de decisiones en tiempo real, aceptación automatizada, alta precisión, baja latencia operativa y despliegue escalable.
Se requiere una suscripción a JoVE para ver este contenido. Inicie sesión o comience su prueba gratuita.
Artículo de investigación
Una plataforma de automatización de aceptación de bajo voltaje impulsada por procesos con orquestación de flujo de trabajo visual y validación mediante aprendizaje automático
En este artículo
Resumen
Resumen
The rapid expansion of low-voltage (LV) networks and their integration with distributed energy resources requires intelligent and automated management solutions. Cloud-edge collaborative Internet of Things (IoT) platforms support real-time monitoring, control, and data acquisition. However, existing platforms generally lack workflow automation, visual process orchestration, user-guided decision support, and comprehensive validation. Consequently, they do not provide process-driven solutions for automated LV network acceptance testing. This study presents the design and evaluation of a Low-Voltage Acceptance Automation Platform based on a visualized process canvas. The proposed platform adopts a process-driven architecture in which acceptance workflows are visually created, managed, and executed. The visual process canvas transforms conventional static monitoring into dynamic workflow automation by enabling real-time workflow execution, validation, and decision-making. The framework incorporates the Open LV Network & Smart Meter dataset to support realistic modeling of electrical load behavior. The workflow includes IoT-based data acquisition, data preprocessing, feature engineering, workflow orchestration using the visual process canvas, machine learning-based validation, and real-time dashboard visualization. The proposed framework achieved a fault detection rate of 98.4%, a receiver operating characteristic area under the curve (ROC-AUC) of 0.968, and an operational decision latency of 31 ms, outperforming traditional cloud-centric and IoT-based baseline approaches by approximately 30%–40%.
Introducción
La Industria 4.0 (I4.0)1 se posibilita mediante varias tecnologías emergentes, entre las cuales el Internet Industrial de las Cosas (IIoT) es una de las más importantes. El IIoT se refiere a la aplicación de tecnologías del Internet de las Cosas (IoT) en entornos industriales, donde dispositivos y máquinas interconectados se comunican principalmente mediante interacciones máquina a máquina. Debido a que los fallos en los sistemas industriales pueden provocar pérdidas operativas significativas, las aplicaciones de IIoT requieren una comunicación altamente confiable mientras generan volúmenes considerablemente mayores de datos que los sistemas convencionales de IoT2. Además, algunos estudios consideran al IIoT como un concepto estrechamente relacionado con la Industria 4.03. Las tecnologías IoT están transformando las arquitecturas jerárquicas tradicionales al permitir sistemas más flexibles con intercambio de datos continuo4. Numerosos estudios recientes han revisado las arquitecturas IIoT existentes y propuesto nuevos diseños de marcos5,6,7,8,9. A pesar de estos avances, persisten dos limitaciones importantes. Primero, se proponen con frecuencia nuevos marcos para superar las deficiencias de arquitecturas anteriores, lo que resulta en un número creciente de modelos alternativos que aumentan la diversidad arquitectónica y la complejidad de implementación. Segundo, el alto nivel de abstracción asociado con muchas arquitecturas propuestas limita su adopción práctica en entornos industriales10.
Se han reportado varias arquitecturas de la IIoT en la literatura. Se presentó una arquitectura de IIoT basada en el estándar de Comunicaciones de Plataforma Abierta (OPC), junto con un middleware en Python para gestionar la comunicación OPC11. Se propuso una arquitectura de IIoT de siete capas; sin embargo, no se proporcionaron detalles de implementación ni experimentos de validación12. Se describió un marco que integra tecnologías 5G e IIoT, junto con un caso de uso representativo, aunque la validación experimental fue limitada13. Se introdujo un marco de diseño emocional para la Industria 4.0, y se discutieron sus posibles implicaciones sin verificación experimental14. Una plataforma de IIoT multicapa fue evaluada en un banco de pruebas del mundo real, con énfasis en consideraciones de telecomunicaciones15. De manera similar, se presentó un marco modular de IoT para el monitoreo de la calidad del aire interior y se evaluó su rendimiento utilizando datos recopilados de 84 hogares con niños16.
El Internet de las Cosas (IoT) se ha convertido en una tecnología de rápida evolución con un potencial considerable para su aplicación en el sector de la energía eléctrica17,18. La integración de tecnologías IoT en los nodos del sistema eléctrico permite una generación, transmisión, distribución, operación y utilización de energía más inteligentes y eficientes, mediante la toma autónoma de decisiones apoyada por el monitoreo continuo en tiempo real del flujo de electricidad dentro de la red inteligente. En consecuencia, estos nodos inteligentes mejoran el rendimiento operativo general de la red eléctrica19. La tecnología de comunicación representa un componente fundamental en la implementación de redes inteligentes, ya que deben transmitirse de forma confiable dos categorías principales de información: mediciones de sensores y señales de control. Además de una baja latencia en la comunicación, las aplicaciones de redes inteligentes requieren una calidad de servicio (QoS) adecuada y una seguridad de datos suficiente para garantizar un funcionamiento confiable20.
La selección de una tecnología de comunicación adecuada para aplicaciones de redes inteligentes requiere considerar los intervalos de comunicación, las tasas de transmisión de datos y los costos de comunicación21. Las redes de comunicación IoT suelen estar compuestas por capas de software, seguridad, servicios, sistema y conectividad. Dentro de la capa de conectividad, los protocolos de comunicación generalmente se clasifican en tres categorías. Los protocolos de largo alcance incluyen Long Range (LoRa) y Narrowband-IoT (NB-IoT); los protocolos de mediano alcance incluyen Wi-Fi, 4G/LTE y 5G; y los protocolos de corto alcance incluyen Bluetooth y ZigBee. A medida que los mercados eléctricos se han desregulado cada vez más, la previsión de carga se ha vuelto más importante para evaluar los efectos de las condiciones climáticas, fallas de equipos, cambios regulatorios y otros factores operativos sobre el costo de los servicios eléctricos. En consecuencia, la previsión precisa de carga residencial se ha vuelto esencial para la operación y supervisión de redes inteligentes, microrredes y edificios inteligentes22.
El funcionamiento confiable de las redes de baja tensión (LV) depende de mantener una alta calidad de la energía23. La calidad de la energía está determinada por la eficacia de la regulación de voltaje, el equilibrio de corriente y la mitigación de perturbaciones técnicas bajo condiciones de operación desbalanceadas24. Entre estos factores, el balance de fases es particularmente importante porque determina la distribución uniforme de voltajes y corrientes entre las fases25. Un mal balance de fases puede aumentar el calentamiento de los conductores, las desviaciones de voltaje y las corrientes en el neutro, reduciendo así la eficiencia del sistema y su confiabilidad operativa26. Por consiguiente, el balance de fases debe considerarse durante el proceso de diseño para mejorar el rendimiento del sistema, la estabilidad operativa y la confiabilidad a largo plazo. Sin embargo, este aspecto rara vez se incorpora en las metodologías convencionales de diseño de mini-redes.
Los recientes avances en los sistemas de orquestación de flujos de trabajo han demostrado los beneficios de la automatización basada en eventos y la gestión visual de procesos en entornos de Internet Industrial de las Cosas. Sin embargo, su aplicación a la validación de redes de distribución y a las pruebas de aceptación en baja tensión sigue siendo limitada. La mayoría de los sistemas de automatización existentes en baja tensión se centran principalmente en el monitoreo y el control supervisorio, mientras que relativamente pocos estudios investigan la gestión de aceptación basada en flujos de trabajo o la verificación automática de cumplimiento. De manera similar, aunque las técnicas de aprendizaje automático han recibido considerable atención para la detección de anomalías en medidores inteligentes y la evaluación de la calidad del suministro eléctrico, estos enfoques generalmente se desarrollan como modelos analíticos independientes, en lugar de como componentes de un marco integrado de orquestación de flujos de trabajo.
En los últimos años se han propuesto diversas soluciones de medidores inteligentes de energía para la gestión de edificios inteligentes y la automatización del hogar27. En la referencia27 se presentó un prototipo de medidor inteligente para demostrar la integración de conceptos educativos universitarios en tecnologías de medición inteligente. El medidor inteligente desarrollado mostró un potencial significativo para la gestión y el control energético, reduciendo el consumo de energía y beneficiando tanto a las empresas de servicios como a los consumidores mediante comunicación bidireccional a través de Internet de las Cosas (IoT). Posteriormente, se introdujo un sistema de enchufe inteligente basado en microcontrolador para apoyar el monitoreo inteligente de energía28.
El sistema de enchufe inteligente propuesto muestra el consumo de energía en tiempo real mediante una interfaz gráfica de usuario basada en Android. Además, el dispositivo puede detectar la presencia de electrodomésticos conectados, una capacidad denominada medición invasiva de carga28. Para su implementación se utilizó un enchufe inteligente comercial de bajo costo. Las mejoras futuras incluyen el monitoreo de la corriente eficaz (RMS), la potencia activa, la potencia reactiva y el ángulo de fase entre voltaje y corriente. Como se describió en nuestros estudios previos, una microrred fotovoltaica parcialmente conectada a la red emplea los protocolos de comunicación ZigBee y LoRa para intercambiar información con dispositivos de medición inteligente, demostrando la viabilidad de la comunicación habilitada para Internet de las Cosas (IoT) en sistemas energéticos distribuidos29,30.
Para abordar las limitaciones de la planificación convencional de sistemas de distribución, la práctica de ingeniería y la investigación científica han avanzado en varias direcciones complementarias. Una línea de investigación se ha centrado en la planificación de alto nivel mediante sistemas de información geográfica (GIS) para la selección de emplazamientos y la evaluación preliminar de recursos31,32. Otra dirección se ha concentrado en mejorar componentes y subsistemas individuales, incluyendo la selección de conductores, el dimensionamiento óptimo de generación y almacenamiento de energía, y evaluaciones comparativas de sistemas de distribución de corriente alterna (AC) y corriente continua (DC)33,34,35,36. Una tercera línea de investigación ha aplicado algoritmos de optimización a la planificación de redes de distribución, al enrutamiento de alimentadores y al diseño de topologías de red. Los avances recientes incluyen marcos como la plataforma uGrid de los investigadores, que integra la colocación de dispositivos y la configuración de redes, pero carece de un análisis estándar de flujo de potencia para verificación y optimización. Otros enfoques dependen del ajuste manual de parámetros para la generación de topologías o se centran en aplicaciones especializadas, como microrredes de baja potencia en corriente continua37,38,39. Aunque estos enfoques representan un progreso significativo, se requiere más trabajo para establecer una metodología integrada para el diseño integral de sistemas de distribución de baja tensión. Además, las evaluaciones tecnoeconómicas exhaustivas de sistemas de baja tensión monofásicos, trifásicos e híbridos siguen siendo limitadas.
Los recientes avances en inteligencia artificial (AI) y aprendizaje automático han ampliado aún más las capacidades de los sistemas eléctricos inteligentes. Una revisión exhaustiva presentada resumió aplicaciones de inteligencia artificial y aprendizaje automático en redes eléctricas inteligentes, incluyendo tecnologías emergentes como el Aprendizaje Federado, la Inteligencia Artificial Generativa, los Modelos de Lenguaje Grande, la Inteligencia Artificial de las Cosas (AIoT) y los Gemelos Digitales40. La revisión destacó aplicaciones en la predicción de carga, mantenimiento predictivo, detección de anomalías, gestión por el lado de la demanda e integración de vehículos eléctricos, haciendo hincapié en los desafíos continuos relacionados con interoperabilidad, privacidad, escalabilidad, robustez y consideraciones éticas. Otra revisión reciente evaluó métodos de IA para la gestión distribuida de energía en infraestructuras de IoT-edge-cloud, centrándose en el aprendizaje automático, el aprendizaje por refuerzo y los sistemas multiagente para el control energético descentralizado41.
En conjunto, estudios previos han avanzado en el monitoreo habilitado por Internet de las Cosas (IoT), la medición inteligente, la computación en la nube y en el borde, la inteligencia artificial y la gestión inteligente de la energía para sistemas de distribución de baja tensión (LV). Sin embargo, estas tecnologías se han desarrollado en gran medida de forma independiente. La orquestación de flujos de trabajo, la gestión automatizada de aceptación, la validación basada en procesos y el apoyo integrado a la toma de decisiones siguen siendo limitados, lo que resalta la necesidad de un marco unificado de automatización orientado a flujos de trabajo.
Por lo tanto, este estudio presenta una Plataforma de Automatización de Aceptación de Bajo Voltaje basada en un Lienzo de Proceso Visualizado. El marco propuesto integra la adquisición de datos basada en IoT, el preprocesamiento de datos, la ingeniería de características, la orquestación de flujos de trabajo, la validación basada en aprendizaje automático, la computación nube-borde y la visualización en tiempo real dentro de una arquitectura unificada para apoyar pruebas automatizadas y confiables de aceptación de redes de bajo voltaje utilizando datos reales de medidores inteligentes. Figura 1 proporciona una visión general de la arquitectura orientada a flujos de trabajo de la plataforma propuesta. El flujo de trabajo comprende la adquisición de datos, el preprocesamiento, la ingeniería de características, la orquestación del flujo de trabajo, la toma inteligente de decisiones y la integración nube-borde, lo que permite la validación automatizada de redes de distribución de bajo voltaje mediante un marco basado en procesos. La plataforma demostró una alta precisión en la validación, al tiempo que redujo la latencia en las decisiones operativas y el tiempo de ejecución del flujo de trabajo en comparación con los enfoques convencionales.
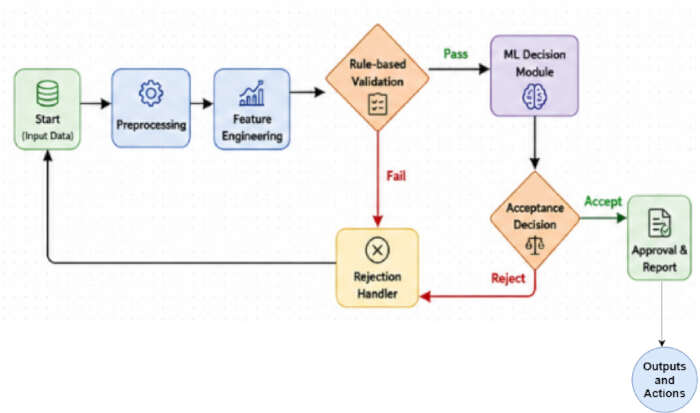
Figura 1. Arquitectura orientada al flujo de trabajo de la plataforma propuesta de automatización de aceptación de baja tensión. Arquitectura de alto nivel de la plataforma propuesta de automatización de aceptación de baja tensión (LV) basada en procesos. El marco ilustra la integración secuencial de la adquisición de datos habilitada para IoT, el preprocesamiento de datos, la ingeniería de características, la orquestación del flujo de trabajo, la toma de decisiones inteligente, la colaboración entre la nube y el borde, y la aceptación automatizada para la validación de redes de distribución de baja tensión. IoT = Internet de las Cosas; LV = baja tensión; ML = aprendizaje automático. Haga clic aquí para ver una versión más grande de esta figura.
Acceso restringido. Inicie sesión o comience una prueba gratuita para ver este contenido.
Protocolo
This study did not involve human participants, animals, or identifiable personal data. The analyses were performed using a publicly available dataset (UK Power Networks Open LV Network & Smart Meter dataset) together with synthetically generated data for validation; therefore, ethics committee approval and informed consent were not required. The research tools used in the protocol are listed in the Table of Materials.
1. Data acquisition
The Low-Voltage (LV) Acceptance Automation Platform was developed using electrical measurements acquired from smart meters, IoT sensors, and the Open LV Network & Smart Meter Dataset. Electrical parameters, including voltage, current, active power, reactive power, and energy consumption, were collected through Wi-Fi-, PLC-, and RS-485-based communication protocols. Real-time measurements were used for live system monitoring, whereas historical data supported model development and validation.
The proposed framework used the Open LV Network & Smart Meter Dataset provided by UK Power Networks42. The dataset comprises household smart meter consumption, feeder-level load profiles, and feeder voltage measurements. Time-series subsets containing load consumption and voltage data were selected for model training and evaluation. In addition, a simulated smart meter dataset was generated to represent operational conditions and fault scenarios required for workflow validation and machine learning model evaluation. The simulated dataset included timestamped measurements of voltage, current, active power, reactive power, energy consumption, total harmonic distortion (THD), and voltage imbalance. Fault samples were generated by simulating undervoltage, overvoltage, excessive harmonic distortion, and voltage imbalance based on established low-voltage operational thresholds. The dataset characteristics are summarized in Table 1.
| Attribute | Description |
| Dataset Name | Open LV Network & Smart Meter Dataset |
| Simulated Smart Meter Dataset | Geneated 1000 smaples for Fault simulation and workflow validation |
| Data Type | Time-series (historical smart meter data) |
| Data Granularity | Household-level and feeder-level measurements |
| Key Features | Voltage, current, active power, reactive power, energy consumption, timestamps |
| Data Frequency | High-resolution (e.g., half-hourly / minute-level depending on subset) |
| Coverage | Residential low-voltage distribution networks |
| Usage in Proposed Work | Model training, validation, load behavior analysis, and acceptance workflow evaluation |
Table 1: Dataset description. Summary of the Open LV Network & Smart Meter dataset used for model development and performance evaluation. The table presents the dataset components, measured electrical variables, sampling characteristics, and dataset partitioning for training, validation, and testing.
Because the Open LV Network & Smart Meter Dataset does not contain predefined fault labels, a rule-based labeling strategy was applied to both the real and simulated datasets. Samples satisfying normal operating limits were assigned a label of 0 (Normal), whereas samples exceeding operational thresholds (e.g., voltage deviations greater than ±10% of the nominal voltage, THD > 5%, or voltage unbalance > 2%) were assigned a label of 1 (Fault). These labels served as the ground truth during model training, validation, and testing. The proposed rule engine also allows threshold values to be configured in accordance with regional standards or utility-specific acceptance criteria.
The dataset was partitioned into training (70%), validation (15%), and testing (15%) subsets. Missing values were addressed using linear interpolation, mean imputation, and forward-fill techniques as described in the preprocessing stage. To ensure statistical robustness and reproducibility, all experiments were repeated five times using different random seeds.
2. Data preprocessing
Raw data from the Open LV Network & Smart Meter Dataset and IoT sensor measurements were preprocessed to improve data quality prior to feature extraction and model development. Missing values, noise, and inconsistencies caused by communication interruptions and sensor malfunctions were identified and corrected using interpolation, mean imputation, and forward-fill techniques. The detailed mathematical derivations are provided in Supplementary File 1 (Section S1).
The preprocessed time-series data were segmented into representative operational intervals (S₁–S₅ and Sk). Statistical and electrical features, including average load, peak load, minimum load, standard deviation, voltage deviation, and power consumption, were extracted from each segment. The extracted features are summarized in Table 2 and served as inputs for the subsequent feature engineering stage.
| Segment ID | Mean Load (kW) | Peak Load (kW) | Min Load (kW) | Std Deviation (kW) | Voltage Deviation (p.u.) | Power Consumption (kWh) | Time Interval |
| S₁ | 2.45 | 3.8 | 1.2 | 0.65 | 0.032 | 58.4 | 00:00–01:00 |
| S₂ | 2.9 | 4.1 | 1.5 | 0.72 | 0.028 | 64.2 | 01:00–02:00 |
| S₃ | 3.25 | 4.85 | 1.8 | 0.81 | 0.035 | 71.6 | 02:00–03:00 |
| S₄ | 3.8 | 5.2 | 2.1 | 0.9 | 0.041 | 78.9 | 03:00–04:00 |
| S₅ | 4.1 | 5.75 | 2.4 | 0.95 | 0.045 | 85.3 | 04:00–05:00 |
| Sk | 3.6 | 5.1 | 2 | 0.88 | 0.038 | 76.5 | tk |
Table 2: Representative feature representation extracted from time-series segments. Representative statistical, electrical, load behavior, voltage stability, and power quality features extracted from segmented LV time-series data during feature engineering. The values illustrate the engineered feature representation and are not experimental performance results. LF = Load Factor; PAR = Peak-to-Average Ratio; VSI = Voltage Stability Index; PF = Power Factor; THD = Total Harmonic Distortion.
3. Feature engineering
Feature engineering was performed to improve the representation of the preprocessed data for workflow orchestration and intelligent decision-making. Principal Component Analysis (PCA)^43 was applied to reduce data dimensionality by removing redundant and highly correlated variables while retaining the most informative feature components. The mathematical derivations are provided in Supplementary File 1 (Section S2).
Statistical descriptors, load behavior indicators, voltage stability indices, and power quality metrics were derived from the segmented time-series data. These engineered features included Load Factor (LF), Peak-to-Average Ratio (PAR), Voltage Stability Index (VSI), Voltage Unbalance Index, Power Factor (PF), and Total Harmonic Distortion (THD). The resulting feature set was used as the input to the workflow orchestration and intelligent decision-making modules.
The feature engineering workflow is summarized in Supplementary File 1 (Supplementary Algorithm 1). The procedure consisted of segmenting the preprocessed data, extracting statistical and electrical features, calculating load behavior, voltage stability, and power quality indicators, and applying PCA to generate the final feature vector used for model training and validation.
4. Visualized process canvas design
The Visualized Process Canvas was developed as a graph-based workflow orchestration framework for automating low-voltage (LV) acceptance procedures. The workflow was represented as a directed graph, G = (N, E), where N = {n1, n2, …, nm}denotes the workflow nodes corresponding to individual processing stages (e.g., data input, preprocessing, validation, and decision-making), and E = {eij}represents the directed edges defining the execution sequence between nodes. This graph-based representation enabled the creation of configurable workflows and their automated execution without manual coding.
Each workflow node performed a specific processing task by receiving input data, executing predefined operations, and forwarding the processed output to subsequent nodes. Acceptance criteria, including voltage and load thresholds, were implemented as configurable validation rules that could be updated without modifying the workflow structure. The workflow supported both sequential and parallel execution to improve computational efficiency. Machine learning models were integrated into designated workflow nodes to perform anomaly detection and automated acceptance validation (Figure 2).
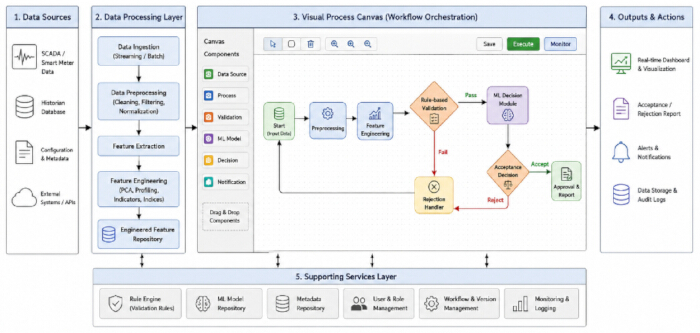
Figure 2: Visualized process canvas architecture for LV acceptance automation. Overview of the visual workflow orchestration framework used for LV acceptance automation. The process canvas illustrates the graphical organization of workflow nodes for data processing, feature engineering, rule-based validation, intelligent decision-making, and output generation to support workflow design, execution, and monitoring. Please click here to view a larger version of this figure.
The mathematical formulation describing information flow through the workflow graph is provided in Supplementary File 1 (Section S3). Supplementary File 1 (Supplementary Algorithm 2) describes the workflow orchestration procedure, including workflow traversal, node execution, rule validation, decision generation, and output aggregation.
The Visualized Process Canvas was implemented using a microservice-oriented software architecture to support scalability and modular deployment. The graphical workflow interface was developed using React.js to provide drag-and-drop workflow configuration. Backend orchestration services were implemented using Flask/FastAPI, while Eclipse Mosquitto served as the MQTT message broker for communication between workflow modules. EdgeX Foundry provided edge device management and IoT integration. Machine learning services were implemented with Scikit-learn, TensorFlow, and PyTorch, and containerized with Docker and Kubernetes.
5. Workflow orchestration engine
The workflow orchestration engine coordinated execution of the configured acceptance workflow. A detailed description is provided in Supplementary File 1 (Section S4), and the execution sequence is summarized in Supplementary Figure 1.
The workflow execution process consisted of validating the workflow definition, initializing the execution environment, scheduling workflow nodes according to their dependencies, executing nodes sequentially or in parallel, applying rule-based validation, aggregating intermediate outputs, and generating the final acceptance or rejection decision based on rule-based and machine learning evaluation. Execution results were published through dashboards, reports, application programming interfaces (APIs), and data storage services. The overall workflow orchestration process is illustrated in Figure 3.
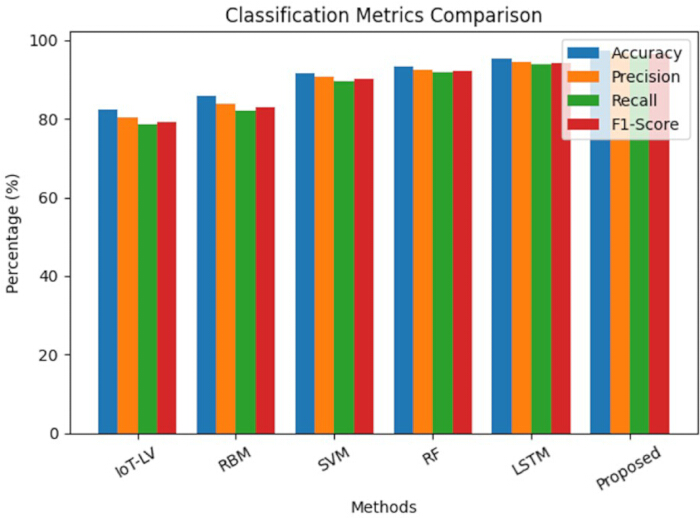
Figure 3: Comparison of classification performance metrics across different methods. Comparison of the classification performance of IoT-LV, RBM, Support Vector Machine (SVM), Random Forest (RF), Long Short-Term Memory (LSTM), and the proposed framework using the Open LV Network & Smart Meter dataset. Performance is evaluated using Accuracy, Precision, Recall, and F1-score. Results are presented as mean ± standard deviation (SD) from five independent experimental runs using a 70%/15%/15% training/validation/testing split. Error bars represent one standard deviation. Please click here to view a larger version of this figure.
6. Intelligent decision module
The Intelligent Decision Module was developed to automate low-voltage (LV) acceptance decisions using supervised machine learning models. Classification and regression algorithms were applied to the engineered feature vectors to support operational decision-making. Classification models identified normal and abnormal operating conditions, whereas regression models estimated future energy consumption and operational trends.
The input feature vector, X ∈ ℝd, comprised the statistical, voltage stability, load behavior, and power quality features extracted during the feature engineering stage. Standalone Support Vector Machine (SVM)44, Random Forest (RF)45, and Long Short-Term Memory (LSTM)46 models were implemented as baseline classifiers for comparative evaluation. The mathematical formulation of the learning models is provided in Supplementary File 1 (Section S5).
For classification, the output variable y ∈ {0,1} represented normal (0) and abnormal (1) operating conditions. When abnormal operating conditions or overload events were detected, the workflow generated a fault notification and flagged the acceptance process as invalid; otherwise, the process was classified as accepted.
The workflow orchestration engine integrated machine-learning predictions with rule-based validation, using a priority-based conflict-resolution strategy. Safety-critical operational rules and regulatory acceptance criteria were treated as hard constraints and therefore took precedence over machine-learning predictions when conflicts occurred. Final acceptance decisions were generated using the combined outputs of the rule-based validation and intelligent decision modules.
7. Cloud–edge integration and visualization dashboard
A cloud-edge computing architecture was implemented to support scalable data processing, storage, and visualization for the LV acceptance automation platform. Smart meters, SCADA systems, and IoT devices continuously collect electrical measurements, which are processed at the edge layer via filtering, normalization, feature extraction, and real-time inference to reduce communication overhead and enable low-latency decision-making. The mathematical derivations are provided in Supplementary File 1 (Section S6).
Processed data were transmitted to the cloud layer for long-term storage, advanced analytics, feature engineering, model training, and model management. Interactive dashboards provided real-time system monitoring, alerts, reporting, and operational decision support. The cloud-edge architecture is illustrated in Supplementary Figure 2, and the implementation details are summarized in Table 3.
| Layer | Component | Hardware / Software | Specification / Version | Purpose / Description |
| Edge Layer | Edge Device | Raspberry Pi 4 / NVIDIA Jetson Nano | Quad-core CPU, 4–8 GB RAM | Real-time data acquisition and local processing |
| IoT Gateway | Industrial IoT Gateway | MQTT / Modbus / OPC-UA support | Communication between sensors and edge/cloud | |
| Sensors / Smart Meters | Digital Smart Meters | Voltage, Current, Power Measurement | Data collection from LV network | |
| Edge Software | Python, EdgeX Foundry, MQTT Broker | Python 3.x | Data preprocessing, filtering, local inference | |
| Communication Protocols | Wi-Fi / PLC / RS-485 | Standard protocols | Data transmission to cloud layer | |
| Cloud Layer | Cloud Platform | AWS / Microsoft Azure / Google Cloud | Scalable cloud services | Data storage, analytics, and model training |
| Storage | AWS S3 / Azure Blob / InfluxDB | Time-series database | Storing historical and real-time data | |
| Compute & ML | Python, TensorFlow, PyTorch, Scikit-learn | ML libraries (latest versions) | Model training, evaluation, deployment | |
| Containerization | Docker, Kubernetes | Latest stable versions | Workflow orchestration and scalability | |
| Data Processing | Apache Spark / Pandas | Distributed processing | Large-scale data analytics | |
| Visualization Layer | Dashboard Tools | Grafana / Apache Superset / Plotly Dash | Web-based tools | Real-time monitoring and visualization |
| Web Framework | React.js / Angular / Flask / FastAPI | Modern web stack | UI development and API integration | |
| Notification System | Email / SMS Gateway / Push Notifications | Twilio / Firebase | Alert generation and communication | |
| API Services | REST APIs | JSON-based communication | Integration between modules |
Table 3: System implementation details. Summary of the hardware configuration, software environment, communication protocols, and cloud–edge computing components used for implementing the proposed LV acceptance automation platform.
Acceso restringido. Inicie sesión o comience una prueba gratuita para ver este contenido.
Resultados
The performance of the proposed Low-Voltage (LV) Acceptance Automation Platform was evaluated using the Open LV Network & Smart Meter Dataset together with a synthetic smart meter dataset generated to represent additional operating conditions and fault scenarios. The synthetic dataset enabled controlled evaluation of workflow orchestration, intelligent decision-making, and fault detection under abnormal operating conditions. The Open LV Network & Smart Meter Dataset comprised household smart meter measurements, f...
Acceso restringido. Inicie sesión o comience una prueba gratuita para ver este contenido.
Discusión
The experimental evaluation demonstrated that the proposed workflow-oriented Low-Voltage (LV) Acceptance Automation Platform consistently outperformed the benchmark approaches in classification, forecasting, fault detection, operational decision latency, and scalability. These performance improvements resulted from the integration of advanced feature engineering, workflow orchestration, cloud-edge collaboration, and hybrid rule-based and machine learning decision-making rather than from the use of a single machine learni...
Acceso restringido. Inicie sesión o comience una prueba gratuita para ver este contenido.
Divulgaciones
Los autores declaran que no tienen intereses financieros ni de otro tipo en conflicto.
Agradecimientos
The authors thank the UK Power Networks Open Data Portal for providing the publicly available Open LV Network & Smart Meter dataset used in this study. This research received no external funding.
Acceso restringido. Inicie sesión o comience una prueba gratuita para ver este contenido.
Materiales
| Nombre | Empresa | Número de catálogo | Comentarios |
|---|---|---|---|
| Apache Spark | Apache Software Foundation | Versión 3.4+ | Análisis de datos a gran escala |
| Apache Superset | Apache Software Foundation | Versión 3.x | Panel de análisis |
| Docker Engine | Docker Inc. | Versión 24.x | Despliegue de aplicaciones |
| Eclipse Mosquitto MQTT Broker | Eclipse Foundation | Versión 2.x | Intercambio de datos |
| EdgeX Foundry (Lanzamiento Jakarta o posterior) | LF Edge (Linux Foundation) | Versión Jakarta / Geneva | Gestión de dispositivos perimetrales |
| Flask / FastAPI | Pallets Projects / Sebastián Ramírez | Flask 2.3+ / FastAPI 0.100+ | Integración de API de backend |
| Grafana | Grafana Labs | Versión 10.x | Visualización y monitoreo |
| Puerta de enlace Industrial IoT | Advantech / Siemens | ECU-1251 / SIMATIC IOT2040 | Comunicación de sensores a la nube |
| Sensores IoT (Sensores de voltaje/corriente) | Texas Instruments / Analog Devices | INA219 / ACS712 | Monitoreo en tiempo real de red |
| Kit de desarrollo Jetson Nano | NVIDIA Corporation | 945-13450-0000-100 | Inferencia de IA en el borde |
| Kubernetes | Cloud Native Computing Foundation (CNCF) | Versión 1.27+ | Escalabilidad de flujo de trabajo |
| Modelo LSTM (Keras/TensorFlow) | Google (TensorFlow/Keras) | Incluido en TF 2.12+ | Predicción y pronóstico de carga |
| Módulo PLC (Comunicación por línea de alimentación) | STMicroelectronics | ST7580 | Comunicación de red inteligente |
| Plotly Dash | Plotly Inc. | Versión 2.x | Visualización interactiva |
| Python 3.10 | Python Software Foundation | Versión 3.10.x | Procesamiento y análisis de datos |
| PyTorch | Meta AI | Versión 2.0+ | Implementación de aprendizaje profundo |
| Algoritmo de Bosque Aleatorio | Scikit-learn | Incluido en v1.3+ | Clasificación de fallas |
| Raspberry Pi 4 Modelo B (4 GB de RAM) | Raspberry Pi Foundation | RPI4-MODBP-4GB | Procesamiento en el borde |
| React.js / Angular | Meta / Google | React 18.x / Angular 16+ | Desarrollo de interfaz de usuario |
| Módulo transceptor RS-485 | Maxim Integrated (Analog Devices) | MAX485 | Conectividad de dispositivos industriales |
| Scikit-learn | Desarrolladores de Scikit-learn | Versión 1.3+ | Modelos de aprendizaje automático |
| Máquina de vectores de soporte (SVM) | Scikit-learn | Incluido en v1.3+ | Clasificación y validación |
| TensorFlow | Google LLC | Versión 2.12+ | Entrenamiento de modelos |
| Twilio / Firebase Cloud Messaging | Twilio Inc. / Google | No aplicable | Alertas y notificaciones |
| Módulo Wi-Fi | Espressif Systems | ESP8266 / ESP32 | Transmisión de datos |
| XGBoost | DMLC (Comunidad de aprendizaje automático distribuido) | Versión 1.7+ | Soporte inteligente para decisiones |
Referencias
- Tong L, Zhou J, Li J. IoT-based low-voltage power distribution system management and control platform. Front Energy Res. 2022;10:902715. https://doi.org/10.3389/fenrg.2022.902715
- Babayigit B, Abubaker M. Industrial Internet of Things: A review of improvements over traditional SCADA systems for industrial automation. IEEE Syst J. 2023;18:120–133.
- Nakagawa EY, et al. Industry 4.0 reference architectures: State of the art and future trends. Comput Ind Eng. 2021;156:107241. https://doi.org/10.1016/j.cie.2021.107241
- Ladegourdie M, Kua J. Performance analysis of OPC UA for industrial interoperability towards Industry 4.0. Internet Things. 2022;3:507–525.
- Bader SR, Maleshkova M, Lohmann S. Structuring reference architectures for the industrial Internet of Things. Future Internet. 2019;11:151. https://doi.org/10.3390/fi11070151
- Fun TS, Samsudin A. Recent technologies, security countermeasure and ongoing challenges of industrial Internet of Things (IIoT): A survey. Sensors (Basel). 2021;21:6647. https://doi.org/10.3390/s21196647
- Mirani AA, et al. Key challenges and emerging technologies in industrial IoT architectures: A review. Sensors (Basel). 2022;22:5836. https://doi.org/10.3390/s22155836
- Fraile F, et al. Reference models for digital manufacturing platforms. Appl Sci. 2019;9:4433. https://doi.org/10.3390/app9204433
- Serôdio C, et al. Software and architecture orchestration for process control in Industry 4.0 enabled by cyber-physical systems technologies. Appl Sci. 2024;14:2160. https://doi.org/10.3390/app14052160
- Ungurean I, Gaitan NC. A software architecture for the industrial Internet of Things—A conceptual model. Sensors (Basel). 2020;20:5603. https://doi.org/10.3390/s20195603
- Hsiao CH, Lee WP. OPIIoT: Design and implementation of an open communication protocol platform for industrial Internet of Things. Internet Things. 2021;16:100441. https://doi.org/10.1016/j.iot.2021.100441
- Domínguez-Bolaño T, et al. An overview of IoT architectures, technologies, and existing open-source projects. Internet Things. 2022;20:100626. https://doi.org/10.1016/j.iot.2022.100626
- Sasiain J, et al. Towards flexible integration of 5G and IIoT technologies in Industry 4.0: A practical use case. Appl Sci. 2020;10:7670. https://doi.org/10.3390/app10217670
- Cañas H, et al. A conceptual framework for smart production planning and control in Industry 4.0. Comput Ind Eng. 2022;173:108659. https://doi.org/10.1016/j.cie.2022.108659
- Cabrini FH, et al. Enabling the industrial Internet of Things to cloud continuum in a real city environment. Sensors (Basel). 2021;21:7707. https://doi.org/10.3390/s21227707
- Gabriel MF, et al. Implementation of an IoT architecture for promoting healthy air quality in 84 homes of families with children. Build Environ. 2024;266:112040. https://doi.org/10.1016/j.buildenv.2024.112040
- Silva BN, Khan M, Han K. Internet of Things: A comprehensive review of enabling technologies, architecture, and challenges. IETE Tech Rev. 2018;35:205–220.
- Dhaou ISB, et al. Internet of Things technologies for smart grid. In: Research Anthology on Smart Grid and Microgrid Development. IGI Global; Hershey; 2022. p. 805–832.
- Kondoro A, et al. A low latency secure communication architecture for microgrid control. Energies. 2021;14:6262. https://doi.org/10.3390/en14196262
- Tightiz L, Yang H. A comprehensive review on IoT protocols' features in smart grid communication. Energies. 2020;13:2762. https://doi.org/10.3390/en13112762
- Kondoro A, et al. Real-time performance analysis of secure IoT protocols for microgrid communication. Future Gener Comput Syst. 2021;116:1–12.
- Rodrigues R, et al. A review of solid-state circuit breakers. IEEE Trans Power Electron. 2020;36:364–377.
- IEEE. IEEE Std 1159-2019: IEEE recommended practice for monitoring electric power quality. IEEE; Piscataway (NJ); 2019. https://doi.org/10.1109/IEEESTD.2019.8800097
- Otcenasova A, et al. The influence of power quality indices on active power losses in a local distribution grid. Energies. 2019;12:1389. https://doi.org/10.3390/en12071389
- Ma K, et al. Review of distribution network phase unbalance: Scale, causes, consequences, solutions, and future research direction. CSEE J Power Energy Syst. 2020;6:479–488.
- Peppanen J, et al. Modeling power electronic equipment to improve distribution feeder current and voltage balance [Presentation]. Presented at: IEEE PES Transmission and Distribution Conference and Exposition (T&D); Denver, CO; 2018. Available from: https://ieeexplore.ieee.org/ https://doi.org/10.1109/TDC.2018.8440261
- Sayed S, et al. Design and realization of an open-source and modular smart meter. Energy Sci Eng. 2019;7:1405–1422.
- Satapathy LM, et al. Arduino based home automation using Internet of Things (IoT). Int J Pure Appl Math. 2018;118:769–778.
- Shaban M, et al. Design of a partially grid-connected photovoltaic microgrid using IoT technology. Appl Sci. 2021;11:11651. https://doi.org/10.3390/app112411651
- Shaban M, Dhaou IB. Design of an IoT-enabled microgrid architecture for a partial grid-connected mode [Presentation]. Presented at: 18th International Multi-Conference on Systems, Signals and Devices (SSD); Virtual; 2021. Available from: https://ieeexplore.ieee.org/ https://doi.org/10.1109/SSD52085.2021.9429443
- Taye BZ, et al. Rural electrification planning using geographic information system (GIS). Cogent Eng. 2020;7:1836730. https://doi.org/10.1080/23311916.2020.1836730
- Huld T, et al. Geospatial analysis of photovoltaic mini-grid system performance. Energies. 2017;10:218. https://doi.org/10.3390/en10020218
- Domínguez J, et al. IntiGIS-Local: A geospatial approach to assessing rural electrification alternatives for sustainable socio-economic development in isolated communities—A case study of Guasasa, Cuba. Energies. 2024;17:3835. https://doi.org/10.3390/en17153835
- Tafula JE, et al. Multicriteria decision-making approach for optimum site selection for off-grid solar photovoltaic microgrids in Mozambique. Energies. 2023;16:2894. https://doi.org/10.3390/en16062894
- Isihak S, et al. Evolution of GIS-based rural electrification planning models and an application of OnSSET in Nigeria. Renew Sustain Energy Transit. 2022;2:100019. https://doi.org/10.1016/j.rset.2022.100019
- Korkovelos A, et al. The role of open access data in geospatial electrification planning and the achievement of SDG7: An OnSSET-based case study for Malawi. Energies. 2019;12:1395. https://doi.org/10.3390/en12071395
- Cicilio P, et al. uGrid: Reliable minigrid design and planning toolset for rural electrification. IEEE Access. 2019;7:163988–163999.
- Nasir M, et al. Optimal planning and design of low-voltage low-power solar DC microgrids. IEEE Trans Power Syst. 2018;33:2919–2928.
- Vai V, et al. Optimal low-voltage distribution topology with integration of PV and storage for rural electrification in developing countries: A case study of Cambodia. J Mod Power Syst Clean Energy. 2020;8:531–539.
- Banad Y, Sharif S, Rezaei Z. Artificial intelligence and machine learning for smart grids: from foundational paradigms to emerging technologies with digital twin and large language model-driven intelligence. Energy Convers Manag X. 2025;28:101329. https://doi.org/10.1016/j.ecmx.2025.101329
- Álvarez-López C, González-Briones A, Li T. Explainable AI and multi-agent systems for energy management in IoT-edge environments: a state-of-the-art review. Electronics. 2026;15(2):385. https://doi.org/10.3390/electronics15020385
- UK Power Networks. Open data portal [Online]. Available from: https://www.ukpowernetworks.co.uk/our-company/open-data-portal (Accessed June 2026).
- Jolliffe IT. Principal Component Analysis. 2nd ed. Springer; New York; 2002. https://doi.org/10.1007/b98835
- Cortes C, Vapnik V. Support-vector networks. Mach Learn. 1995;20:273–297.
- Breiman L. Random forests. Mach Learn. 2001;45:5–32.
- Hochreiter S, Schmidhuber J. Long short-term memory. Neural Comput. 1997;9:1735–1780.
- Fawcett T. An introduction to ROC analysis. Pattern Recognit Lett. 2006;27:861–874.
- Montgomery DC, Runger GC. Applied Statistics and Probability for Engineers. 8th ed. John Wiley & Sons; Hoboken (NJ); 2020.
- Montgomery DC. Design and Analysis of Experiments. 10th ed. John Wiley & Sons; Hoboken (NJ); 2020.
Acceso restringido. Inicie sesión o comience una prueba gratuita para ver este contenido.