This case-control study performs plasma exosomal microRNA sequencing and bioinformatic analysis on breast cancer patients from Baize, China. It identifies 265 differentially expressed miRNAs, including hsa-miR-6866-5p and the hsa-miR-519 cluster, revealing potential regulatory pathways and offering preliminary candidates for minimally invasive breast cancer biomarkers.
Artículo de investigación
Exosomal miRNA Sequencing and Bioinformatics in Breast Cancer: A Case-Control Study in Baise, China
* These authors contributed equally
En este artículo
Resumen
Resumen
Breast carcinoma remains the most frequently diagnosed malignancy among women globally, carrying a substantial burden of incidence and fatality. Timely diagnosis and intervention are of utmost significance for improving patient prognosis. Accumulating evidence suggests that microRNAs (miRNAs) derived from plasma exosomes may serve as potential diagnostic biomarkers for mammary carcinoma. To conduct an exploratory analysis of the role of exosomal miRNAs, expression profiles were obtained from breast cancer patients and healthy controls recruited between February 20, 2025, and May 20, 2025 (a 3-month period), with written informed consent from all participants prior to enrollment, using high-throughput sequencing. Subsequently, differentially expressed miRNAs were analyzed through an integrated bioinformatics approach that included gene ontology (GO) term enrichment analysis, Kyoto encyclopedia of genes and genomes (KEGG) pathway analysis, and target gene network analysis to predict their potential biological functions, involved pathways, and regulatory networks. An initial comparative analysis identified 265 miRNAs with modified expression profiles in breast cancer patients. Among them, 203 miRNAs were upregulated, and 62 miRNAs were downregulated. Notably, hsa-miR-6866-5p, hsa-miR-376c-3p, hsa-miR-656-3p, and hsa-miR-641 were significantly upregulated, whereas a cluster of miRNAs sharing a seed sequence, including hsa-miR-519a-5p, hsa-miR-519b-5p, hsa-miR-518e-5p, hsa-miR-522-5p, and hsa-miR-523-5p, were significantly downregulated. Moreover, functional analyses suggested that these miRNAs potentially participate in crucial signaling pathways, including Rap1, phospholipase D, oxytocin, and vascular endothelial growth factor. Predictions of the target gene network indicated their potential regulatory roles in the pathogenesis and progression of breast cancer. This exploratory study identified 9 miRNAs, including hsa-miR-6866-5p, hsa-miR-376c-3p, hsa-miR-656-3p, hsa-miR-641, hsa-miR-519a-5p, hsa-miR-519b-5p, hsa-miR-518e-5p, hsa-miR-522-5p, and hsa-miR-523-5p, that were dysregulated in plasma exosomes of breast cancer patients from Baize, China. Elucidating the precise regulatory functions of these candidate miRNAs in breast cancer development warrants extensive future empirical exploration.
Introducción
Breast cancer maintains its status as the leading cancer type among women, responsible for more than one-tenth of all newly diagnosed cancers annually. Globally, breast carcinoma represents the second leading driver of oncological fatalities in females, with epidemiological data from 2022 indicating it comprised 11.6% of all cancer diagnoses worldwide, ranking just behind lung malignancies1,2. Reducing the incidence of breast cancer requires understanding its causes and mechanisms, reducing exposure to risk factors, and identifying high-risk women through precise methods for targeted intervention and treatment3.
By interacting with specific messenger RNA (mRNA) transcripts, microRNAs (miRNAs) modulate gene expression through either suppression of translation or direct target degradation. Functioning as essential molecular rheostats, these small RNAs profoundly affect a broad spectrum of biological mechanisms, encompassing cellular proliferation, differentiation, programmed cell death, developmental stages, host-pathogen dynamics, and the onset of cancer4,5,6,7. Recent investigations have provided compelling evidence for the utility of plasma exosomal miRNAs in clinical settings. For instance, Hannafon et al. demonstrated that specific plasma exosomal miRNAs, such as miR-21 and miR-1246, are significantly elevated in breast cancer patients and can effectively distinguish them from healthy individuals8. Furthermore, comprehensive studies have revealed that the emerging roles of exosomal miRNAs, acting as next-generation vehicles and biomarkers, offer highly sensitive multiparameter signatures for detecting breast cancer progression and evaluating clinical outcomes9,10. Beyond the primary diagnosis, distinct plasma exosomal miRNA profiles have also been closely correlated with modulation of the tumor microenvironment, tumor recurrence, and patient prognosis, underscoring their multifaceted clinical value in non-invasive liquid biopsies11. These foundational studies highlight the critical need to explore novel, population-specific exosomal miRNA networks—such as those investigated in our study—to uncover additional targeted mechanisms and therapeutic opportunities. Critically, they found that overexpressing miR-10b in non-metastatic breast tumors triggers potent invasion and metastasis. Zhang et al. (2021) found that the homeobox transcript antisense RNA is highly expressed in breast cancer, promotes proliferation, invasion, and migration of MDA-MB-231 cells7, and acts as a molecular sponge for miR-20312. Because altered miRNA expression induces changes in gene profiles engaged in multiple biological processes and contributes to many human diseases, circulating miRNAs are considered promising biomarkers for diagnosis and disease prognosis13.
Exosomes were first discovered in 1983 and are internalized by the cell membrane to form endosomes. Endosomal membrane invagination and inward budding produce intraluminal vesicles (ILVs), creating multivesicular bodies - dynamic subcellular structures11. Upon cellular exocytosis, these vesicles enter the extracellular space as 50–150 nm structures classified as exosomes11,14. These vesicles serve as crucial mediators of intercellular communication by transferring proteins, lipids, and nucleic acids to recipient cells, thereby modulating their behavior15,16. Due to their role in cancer, exosomes are being extensively investigated as promising biomarkers for diagnosis and prognosis, as well as potential therapeutic targets17. Furthermore, their innate capacity to deliver bioactive molecules underlies their utility as natural vehicles for targeted cancer therapy.
Given the growing attention on exosomal miRNAs in breast cancer9,10, a significant knowledge gap remains regarding population-specific biomarker profiles. Most existing exosomal miRNA sequencing studies have focused on broad, predominantly Western, or major metropolitan cohorts, leaving regional and ethnically distinct populations severely underrepresented. The Baize region in Guangxi, China, is characterized by a unique demographic composition—comprising primarily long-dwelling ethnic minorities—alongside specific regional dietary habits, environmental exposures, and genetic backgrounds. Consequently, it remains unknown whether the exosomal miRNA signatures and pathogenesis pathways established in conventional cohorts are applicable to this regional population.
We hypothesize that breast cancer patients from the Baize region possess a distinct plasma exosomal miRNA expression profile driven by these unique gene-environment interactions. Therefore, the primary objective of this study was to sequence and compare plasma exosome-derived miRNAs from breast cancer patients and healthy volunteers specifically recruited from this region. By employing high-throughput sequencing and integrated bioinformatics, this study aims to address the current geographic and ethnic gaps in breast cancer biomarker research. Ultimately, the novel biological insights gained from this regional cohort are expected to not only elucidate population-specific mechanisms of breast cancer progression but also identify regionally tailored clinical biomarkers for more precise diagnostic and therapeutic interventions.
Protocolo
This study was approved by the Medical Ethics Committee of the Affiliated Hospital of Youjiang Medical University for Nationalities (2025021101). All procedures performed in this study involving human participants were in accordance with the ethical standards of the Institutional and National Research Committees and the 1964 Declaration of Helsinki. Written informed consent was obtained from all participants before enrollment.
Recruitment of patients
This study was approved by the Medical Ethics Committee of the Affiliated Hospital of Youjiang Medical University for Nationalities (2025021101). All enrolled patients were recruited from the Affiliated Hospital of Youjiang Medical University for Nationalities and provided written informed consent voluntarily. The enrollment criteria required a pathologically confirmed diagnosis of breast cancer and access to comprehensive clinical records. Subjects were excluded if they presented with concurrent malignancies or other severe diseases involving vital organs. Data on age, menstrual status, marital and childbearing history, and the presence of hypertension, dyslipidemia, and diabetes mellitus were collected (Table 1). For the healthy control group, participants were recruited from the hospital's routine physical examination center. They were strictly matched to the case group by biological sex (all females) and age. Inclusion criteria for controls required a normal physical examination and a confirmed absence of malignant tumors, severe organ dysfunction, or systemic inflammatory diseases. The key reagents, equipment, software, and consumables used in this study are detailed in the Table of Materials.
Plasma collection and exosome isolation
The thawed serum samples were centrifuged at 300 × g for 10 min to remove large cells and debris, and the supernatant was collected. The supernatant was then transferred to centrifuge tubes and centrifuged at 15,000 × g for 35 min to remove cellular debris and organelles. Subsequently, ultracentrifugation at 10,000 × g for 75 min was performed to remove smaller fragments. Next, the supernatant was transferred to ultracentrifuge tubes, and crude exosomes were pelleted by ultracentrifugation at 100,000 × g for 120 min using an ultracentrifuge equipped with a fixed-angle rotor (k-factor ≈ 256). To minimize the co-precipitation of free serum proteins and lipoproteins, a stringent wash step was implemented: the crude exosome pellet was completely resuspended in pre-chilled, sterile, ultra-filtered PBS and subjected to a second ultracentrifugation step at 100,000 × g for 70 min using the same rotor. Finally, the supernatant was discarded, and the exosome-enriched pellet was resuspended in 50 µL of PBS and stored at -80 °C for subsequent analysis.
Morphological identification of exosomes by electron microscopy
A pipette was used to place 15 µL of the exosome suspension onto a copper grid, which was then allowed to stand for 1 min. Filter paper was used to absorb the remaining liquid from the copper grid. For negative staining, 15 µL of 2% uranyl acetate solution was applied to the samples and left for 1 min at room temperature. The residual stain was removed by wicking with filter paper, followed by air-drying. Exosomes were imaged using transmission electron microscopy (TEM) at 100 kV. Size distribution was quantified via nanoparticle tracking analysis (NTA)18.
Extraction of total RNA from plasma exosomes
Total cellular RNA was isolated from processed exosomal fractions using TRIzol reagent, maintaining the sample-to-reagent volume ratio below 10%. Homogenized suspensions were incubated at ambient temperature for 5 min before phase separation. Following centrifugation at 14,000 × g for 10 min at 4 °C, the upper aqueous phase was carefully separated by adding chloroform (0.2 mL per milliliter of the initial lysate). To separate the phases, 0.2 mL of chloroform per 1 mL of supernatant was added, vortexed for 15 s, and incubated for 3 min at room temperature. The mixture was centrifuged at 14,000 × g for 10–15 min at 4 °C to resolve it into a yellow organic phase, an interphase, and a colorless aqueous phase containing RNA. Approximately 400 µL of the aqueous phase was transferred to a fresh tube, and an equal volume of isopropanol was added to precipitate the RNA. The solution was mixed thoroughly and incubated for 15–20 min at room temperature. It was then centrifuged at 14,000 × g for 10 min at 4 °C, and the supernatant was discarded.
The precipitate was rinsed with 1 mL of 75% ethanol per 1 mL of initial TRIzol, centrifuged at 14,000 × g for 3 min at 4 °C, and the supernatant was discarded. Residual ethanol was removed by brief centrifugation. The RNA pellet was air-dried for 2–3 min, dissolved in 15–50 µL of nuclease-free water, assessed for quality, and stored at -80 °C.
Optimal library preparation requires total RNA that meets stringent quality standards. Only RNA samples with an RNA integrity number (RIN) ≥ 7 (as determined by a bioanalyzer) and purity ratios (OD₂₆₀/₂₈₀ between 1.8 and 2.2; OD₂₆₀/₂₃₀ ≥2.0) are processed, provided they meet the concentration (≥100 ng/µL) and total input (≥2 µg) requirements for robust small RNA-seq library construction.
Sequencing and bioinformatics pipeline
Small RNA libraries were constructed using a small RNA library preparation kit following the manufacturer's protocol. The libraries were sequenced on a high-throughput platform using a 2 × 150 bp paired-end sequencing strategy, yielding an average sequencing depth of approximately 35 million raw reads per sample. Because all 6 samples from this discovery sub-cohort were processed concurrently and sequenced in a single run, computational correction for batch effects was not required.
The raw sequencing data underwent rigorous quality control. Adapter sequences, low-quality reads (removing sequences where the Q20 proportion was <60%), and sequences outside the 18–36 bp range were trimmed using fastp (v0.19.5). The resulting clean reads were aligned to the human reference genome (hg38) using bowtie (v1.2.3). For miRNA identification and annotation, the mapped sequences were compared against the miRBase database (v22) and quantified using miRDeep2 (v0.1.3).
Differential expression analysis was performed using the DESeq2 (v1.10.1) package in R. To control the false discovery rate (FDR) in this high-throughput dataset, multiple testing correction was performed via the Benjamini-Hochberg (BH) method. MiRNAs meeting the strict threshold of an adjusted P-value (FDR) < 0.05 and |log2 Fold Change| > 1 were defined as significantly differentially expressed.
To predict the downstream regulatory networks, we utilized three independent online databases: TargetScan (v8.0), miRDB (v6.0), and miRWalk (v3.0). To rigorously resolve conflicting predictions among algorithms, we applied a strict intersection strategy: only target genes consistently predicted by all three databases were retained for downstream analysis. Finally, gene ontology (GO) and Kyoto encyclopedia of genes and genomes (KEGG) pathway enrichment analyses for these consensus target genes were computationally conducted utilizing the clusterProfiler R package (v2.4.2), with an adjusted P-value < 0.05 considered statistically significant.
Resultados
Demographic and baseline clinical characteristics
A total of 6 participants were enrolled in this exploratory study, comprising 3 breast cancer patients and 3 healthy controls. Based on the clinical data collected, the mean age of the breast cancer case group was 55.0 years, compared to 49.67 years in the control group. Statistical comparisons revealed no significant differences between the two cohorts regarding age, menstrual status, marital status, and the prevalence of hypertension, dyslipidemia, or diabetes mellitus (all P > 0.05). However, given the limited sample size, these statistical comparisons should be interpreted with caution. Furthermore, the detailed clinicopathological characteristics, treatment statuses, and baseline metabolic conditions of the sequenced breast cancer cohort are comprehensively summarized in Table 2.
Morphological identification of exosomes by electron microscopy
Electron microscopy identified characteristic exosomal structures: lipid-bilayer vesicles (40-160 nm) displaying cup-shaped morphology (Figure 1A,B)19. NTA quantification showed that >80% of particles were in the 40–160 nm size range at suitable concentrations. Collectively, these analyses confirmed that isolated exosomes met the purity and concentration requirements (Figure 1C–F)20.
Differential expression of exosomal miRNAs
Comparative analysis of case-control exosomal miRNA sequencing data revealed differentially expressed species. A total of 265 miRNAs showed differential expression (|log₂ Fold Change | > 1, adjusted P < 0.05), with 76.6% (203/265) upregulated and 23.4% (62/265) downregulated. The differentially expressed miRNAs comprised 47 named miRNAs and 218 unnamed miRNAs. Among the named miRNAs, 20 were downregulated, and 27 were upregulated (Table 3). The unnamed miRNAs included 176 upregulated and 42 downregulated.
Among the upregulated miRNAs, differences in the expression of hsa-miR-6866-5p (Log2FC = 7.42, adjusted P = 0.000560), hsa-miR-376c-3p (Log2FC = 9.13, adjusted P = 0.002789), hsa-miR-656-3p (Log2FC = 9.84, adjusted P = 0.001455), and hsa-miR-641 (Log2FC = 9.60, adjusted P = 0.001720) were the most significant. In the downregulated group, the miRNAs with the most noticeable differences in expression were hsa-miR-519a-5p (Log2FC = -9.54, adjusted P = 0.000593), hsa-miR-519b-5p (Log2FC = -9.54, adjusted P = 0.000593), hsa-miR-518e-5p (Log2FC = -9.54, adjusted P = 0.000593), hsa-miR-522-5p (Log2FC = -9.54, P = adjusted 0.000593), and hsa-miR-523-5p (Log2FC = −9.54, adjusted P = 0.000593) (Figure 2). hsa-miR-519a-5p, hsa-miR-519b-5p, hsa-miR-518e-5p, hsa-miR-522-5p and hsa-miR-523-5p shared a seed sequence.
Importantly, these differential expression profiles were derived exclusively from high-throughput sequencing data. At this stage, independent experimental validation (e.g., via RT-qPCR) has not been performed to verify the expression levels of these key candidate miRNAs. Therefore, these findings represent preliminary computational predictions rather than experimentally validated results.
Cluster analysis of differential exosomal miRNAs
To explore the functional roles of miRNAs with shared or comparable characteristics, we conducted a functional clustering analysis on the top 47 named and top 50 unnamed differentially expressed miRNAs (Figure 3A,B). The analysis revealed a significant enrichment of hsa-miR-6866-5p in the breast cancer group as compared with the controls. Conversely, hsa-miR-6780a-5p and hsa-miR-4433a-3p were markedly downregulated in the control group (Figure 3A).
GO analysis of target genes
Gene ontology (GO) and Kyoto encyclopedia of genes and genomes (KEGG) pathway enrichment analyses were performed on a comprehensive pooled dataset of target genes predicted to interact with the differentially expressed miRNAs. While the absolute integer of this global input pool was unarchived due to automated pipeline constraints, our highly rigorous three-database intersection strategy yielded exactly 4, 2, 42, and 3 consensus target genes for the most critical representative candidates (hsa-miR-6866-5p, hsa-miR-376c-3p, hsa-miR-641, and the hsa-miR-519 cluster, respectively), which drive the primary functional interpretations. To account for false discovery rates, multiple testing correction was applied using the Benjamini-Hochberg (BH) method. These analyses were based entirely on in silico-predicted regulatory relationships between the miRNAs and their target genes. The enrichment analyses for the target gene sets were conducted using the clusterProfiler software package. The GO analysis encompasses three domains: biological process (BP), cellular component (CC), and molecular function (MF). In total, the analysis identified 8,334 significantly enriched GO terms (adjusted P < 0.05), comprising 6,339 in the BP domain, 758 in the CC domain, and 1,237 in the molecular function (MF) domain.
Using the adjusted P-value (FDR) as the significance criterion, the top ten enriched GO terms from each category (BP, CC, and MF) were selected for further analysis. In the BP category, these functions included vesicle-mediated synaptic transport, axonogenesis, synaptic vesicle cycle, calcium ion transport, response to nutrient levels, carbohydrate derivative transport, protein autophosphorylation, modulation of chemical synaptic transmission, regulation of trans-synaptic signals, and regulation of neurotransmitter receptor activity. GO-CC enrichment analysis revealed that the predicted target genes of breast cancer exosomal miRNAs were predominantly associated with membrane-bound organelles, synapse-related structures, and cell migration-related compartments. The most highly represented terms were vacuolar membrane (n = 206), neuronal cell body (n = 203), lysosomal membrane (n=190), and lytic vacuole membrane (n = 190). Significant enrichment was also observed in cell leading edge (n = 172), glutamatergic synapse (n = 164), neuron-to-neuron synapse (n = 154), asymmetric synapse (n = 138), distal axon (n = 130), and cell cortex (n = 130). Among these terms, vacuolar and lysosomal membrane-related components exhibited relatively strong enrichment signals, suggesting that the target genes may be involved in lysosome–vacuole-associated membrane trafficking, intracellular degradation, cytoskeletal remodeling, and intercellular signal transduction. In the MF category, the functions included regulation of cell morphogenesis, GTPase regulator activity, nucleoside-triphosphatase regulator activity, phospholipid binding, carbohydrate derivative transmembrane transport protein activity, nucleobase-containing compound transmembrane transporter capacity, the role of guanyl-nucleotide exchange factors, monosaccharide binding capacity, protein serine/threonine kinase function, GTPase activator activity, and calmodulin binding (Figure 4). It should be explicitly noted that these GO annotations are bioinformatics predictions and have not yet been validated by targeted biological functional assays.
KEGG pathway analysis
To identify the primary significantly enriched biochemical and signaling pathways, a KEGG pathway analysis was conducted. Of the 338 significantly enriched pathways identified, the top 20 by gene count were selected for further examination. The results showed that these pathways were predominantly mapped to Rap1, phospholipase D, oxytocin, sphingolipid, neurotrophin, and vascular endothelial growth factor (VEGF) signaling (Figure 5). Given that these enrichments are based on bioinformatic predictions, these findings generate preliminary hypotheses regarding the miRNA-related signaling pathways and molecular functions, which may help to reveal the pathogenesis of breast cancer and facilitate further experimental validation.
MicroRNA Venn diagram analysis
To systematically investigate the potential downstream mechanisms, we selected three representative upregulated miRNAs (hsa-miR-6866-5p, hsa-miR-376c-3p, and hsa-miR-641) along with the downregulated miRNA cluster, and employed a combined approach using three databases (TargetScan, miRDB, and miRWalk) to predict their downstream target genes. An intersection analysis was subsequently performed to identify the target genes common to all three databases for each miRNA (Figure 6, Figure 7, and Figure 8). As shown in Figure 6, four genes (RNF38, KCNN3, ISG20L2, and SGMS2) were commonly identified by TargetScan, miRWalk, and miRDB as targets of hsa-miR-6866-5p. As shown in Figure 7, only two genes (THSD7A and OTUD4) were common across all three databases for hsa-miR-376c-3p. As shown in Figure 8, for hsa-miR-641, 42 genes were identified at the intersection of all three databases. These consensus target genes were: RTF1, SEC14L1, BXN4, PPP1R9A, GNG12, NR2C2, FAM126B, FDX1, BDP1, CBX1, NF1, PDE4D, DTWD2, GSK3B, TRIM6, EIF4E, TMBIM1, NTRK2, NEO1, PPP2R2A, FBXL17, CAMK4, FGF13, NREP, AFTPH, TLE4, MBNL2, GPR180, SKP1, SCML2, TCF12, TP53INP2, UHMK1, PRPF4B, COPS2, VEZF1, TRIM49, ERCC6, TRIM10, PRSS16, PSME3, and LMBR1. As shown in Figure 9, hsa-miR-519a-5p shares a seed sequence with hsa-miR-519b-5p, hsa-miR-518e-5p, hsa-miR-522-5p, and hsa-miR-523-5p. The target genes of these miRNAs, as predicted by TargetScan, miRWalk, and miRDB, were NPL, HMGB3, and ATE1.
DATA AVAILABILITY:
The raw sequencing data will be deposited immediately in an appropriate public repository (e.g., GEO or SRA), and the corresponding accession numbers will be updated and made publicly accessible.
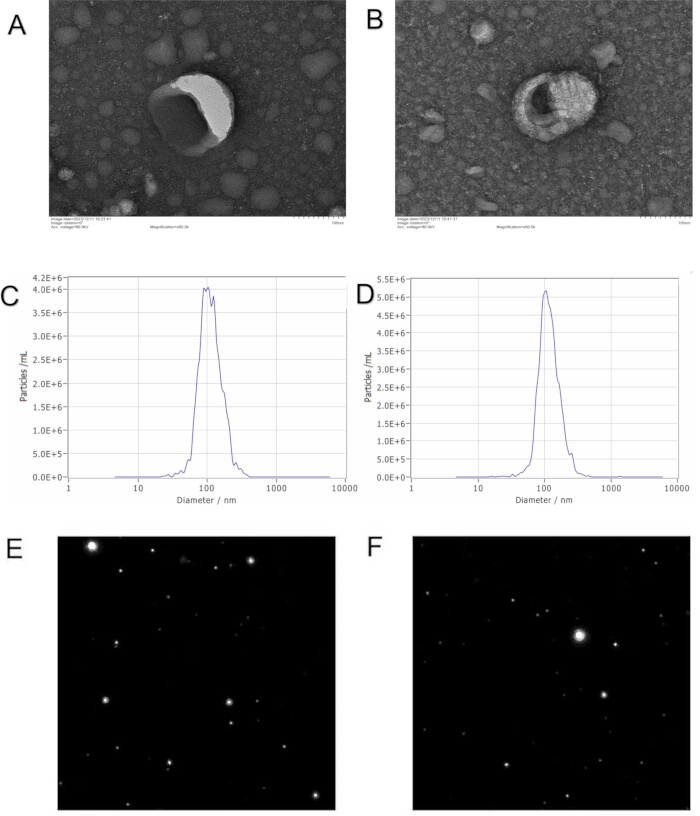
Figure 1: Characterization of isolated serum exosomes. (A,B) Representative TEM images showing the typical bilayer cup-shaped morphology of the isolated serum exosomes. Scale bar = 100 nm. (C,D) NTA measures the size distribution and concentration of the extracted vesicles. (E,F) Representative screenshots of exosome particles captured during the NTA video recording. Exosomes were isolated from serum samples of breast cancer patients and healthy controls. The sample size was n = 3 biologically independent samples per group. Due to the observational nature of TEM and NTA, representative images and distribution plots from the biological replicates are shown. Please click here to view a larger version of this figure.
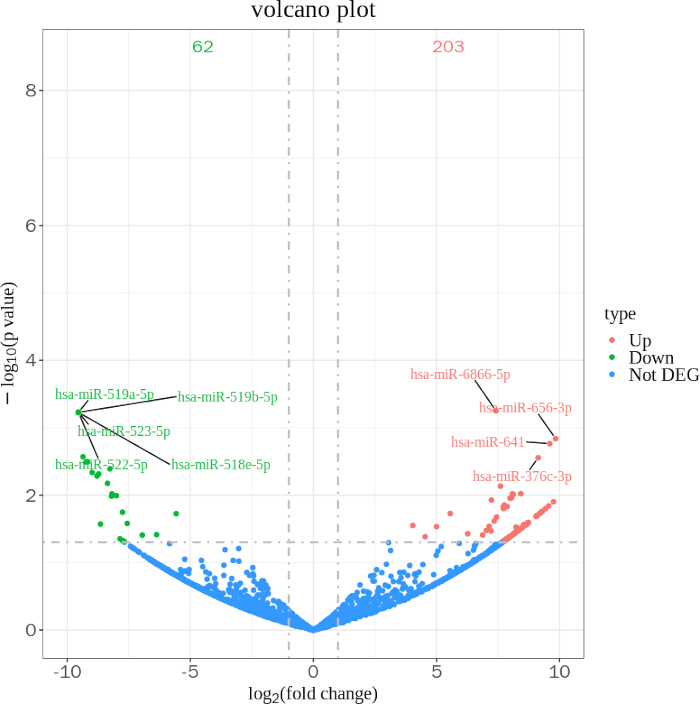
Figure 2: Volcano plot of differentially expressed miRNAs. The plot visualizes the global distribution of differentially expressed miRNAs between breast cancer and healthy control groups, based on RNA sequencing data. Differential expression analysis was performed using the DESeq2 package (Wald test). The sample size was n = 3 biologically independent samples per group. The significance thresholds were strictly set at |log₂ (fold change)| > 1 and adjusted p < 0.05. Red points indicate significantly upregulated miRNAs (n = 203), green points indicate significantly downregulated miRNAs (n = 62), and blue points represent non-significant miRNAs. Please click here to view a larger version of this figure.
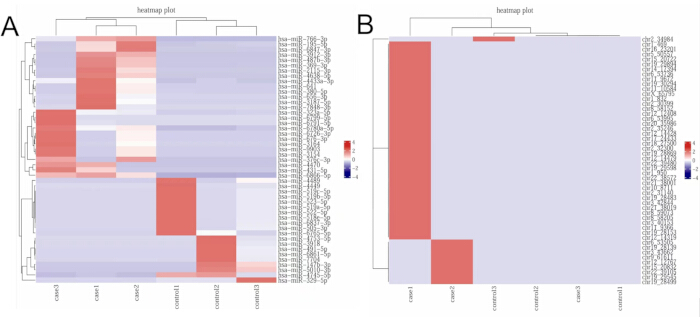
Figure 3: Hierarchical clustering heatmaps of differentially expressed miRNAs. (A,B) Heatmaps displaying the expression profiles of the top differentially expressed miRNAs across all individual samples. Each column represents a biologically independent sample (n = 3 per group, total n = 6), and each row represents an individual miRNA. The hierarchical clustering was performed based on normalized expression levels. The color scale reflects Z-score-transformed expression values, with red indicating relatively high expression and blue relatively low. Statistical significance for inclusion in the heatmap was determined using DESeq2 with an adjusted p-value < 0.05. Please click here to view a larger version of this figure.
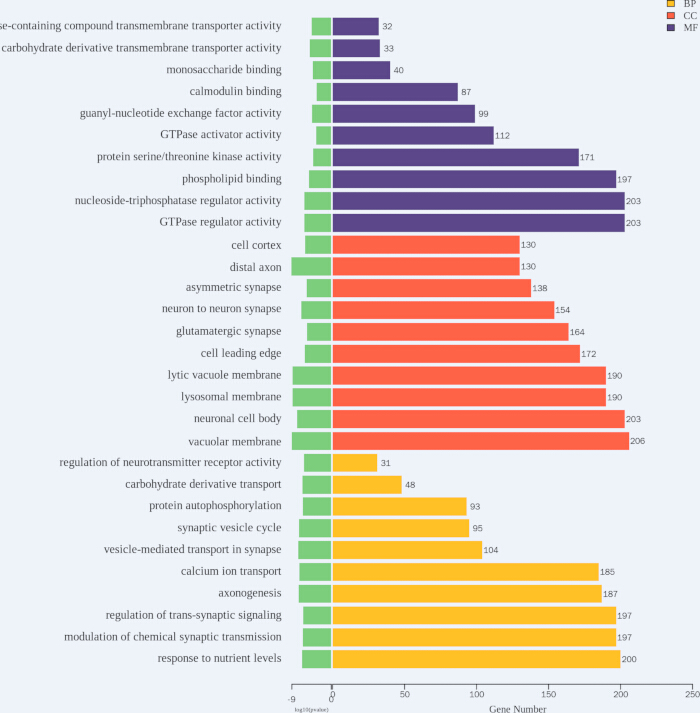
Figure 4: Gene Ontology (GO) enrichment analysis of target genes. The bar chart illustrates the significantly enriched GO terms categorized into biological process (BP, yellow), cellular component (CC, orange), and molecular function (MF, purple) for the predicted target genes of the differentially expressed miRNAs. Enrichment analysis was performed using the clusterProfiler package based on the hypergeometric distribution test. The sample size for the upstream RNA-seq data input was n = 3 biologically independent samples per group. The length of the bars corresponds to the gene count and the -log₁₀(p-value). The statistical significance threshold for enriched terms was set at adjusted p < 0.05. Please click here to view a larger version of this figure.
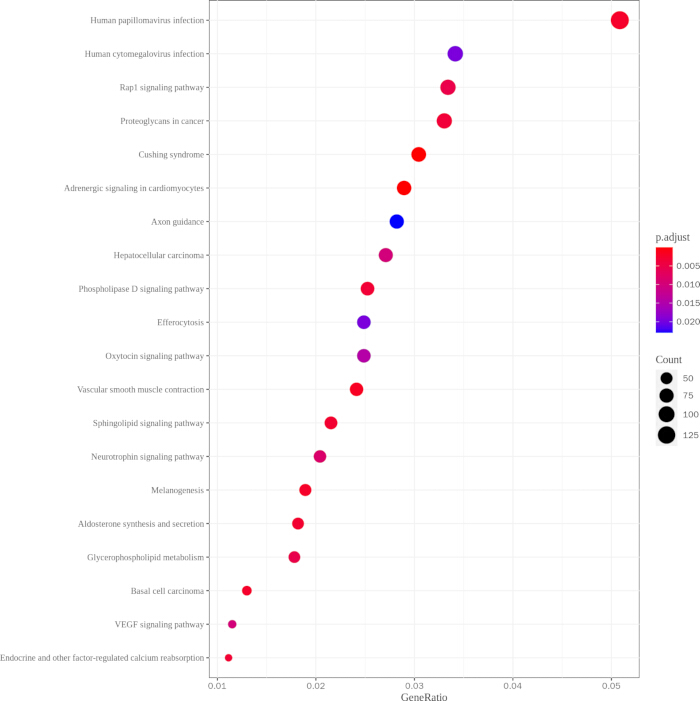
Figure 5: KEGG pathway enrichment analysis of target genes. The dot plot displays the top significantly enriched Kyoto encyclopedia of genes and genomes (KEGG) pathways for the predicted target genes. The x-axis represents the GeneRatio (the ratio of target genes mapped to a pathway versus the total background genes). The size of the dots indicates the number of target genes mapped to each pathway (Count), and the color gradient from blue to red represents the adjusted p-value (p.adjust). Enrichment analysis was conducted using the clusterProfiler package (hypergeometric test). Statistical significance was defined as adjusted p < 0.05. Please click here to view a larger version of this figure.
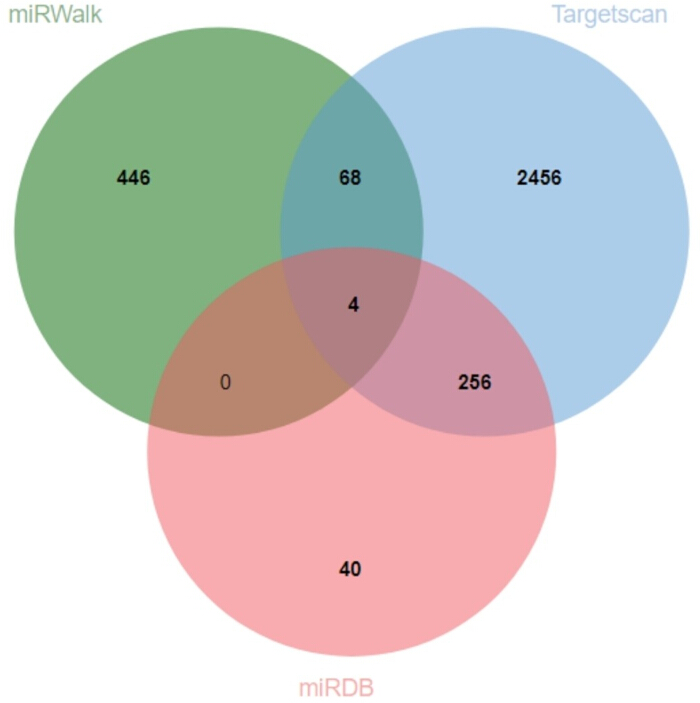
Figure 6: Predicted target genes of hsa-miR-6866-5p. The target genes of hsa-miR-6866-5p, as predicted by TargetScan, miRWalk, and miRDB, were RNF38, KCNN3, ISG20L2, and SGMS2. The central overlap highlights the 4 core target genes robustly identified by all three prediction algorithms, thereby minimizing false-positive predictions. As this figure represents an in silico intersection of database predictions rather than continuous quantitative data, statistical error bars and significance thresholds (p-values) are not applicable. The upstream input miRNAs used for this prediction were derived from the RNA-seq differential expression analysis (n = 3 biologically independent samples per group, identified by DESeq2 with adjusted p < 0.05). Please click here to view a larger version of this figure.
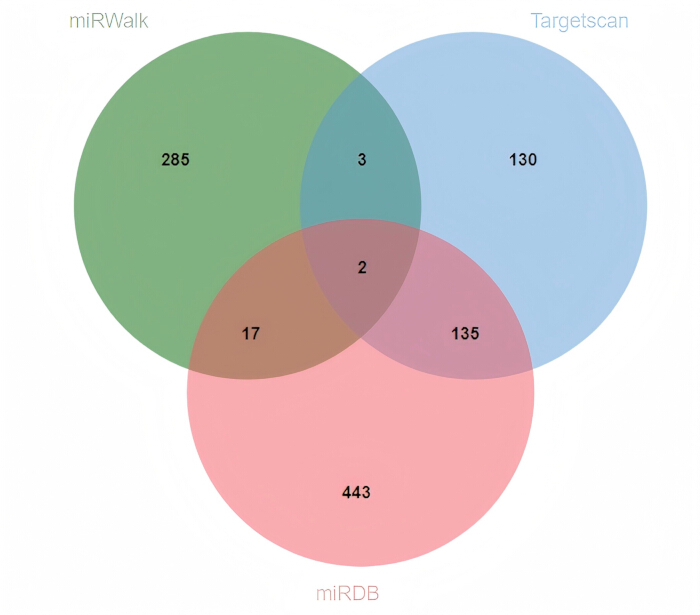
Figure 7: Predicted target genes of hsa-miR-376c-3p. The target genes of hsa-miR-376c-3p, as predicted by TargetScan, miRWalk, and miRDB, were THSD7A and OTUD4. The central overlap highlights the 2 core target genes that are robustly identified by all 3 prediction algorithms, effectively minimizing false-positive predictions. As this figure represents an in silico intersection of database predictions rather than continuous quantitative data, statistical error bars and significance thresholds (p-values) are not applicable. The upstream input miRNAs used for this prediction were derived from the RNA-seq differential expression analysis (n = 3 biologically independent samples per group, identified by DESeq2 with adjusted p < 0.05). Please click here to view a larger version of this figure.
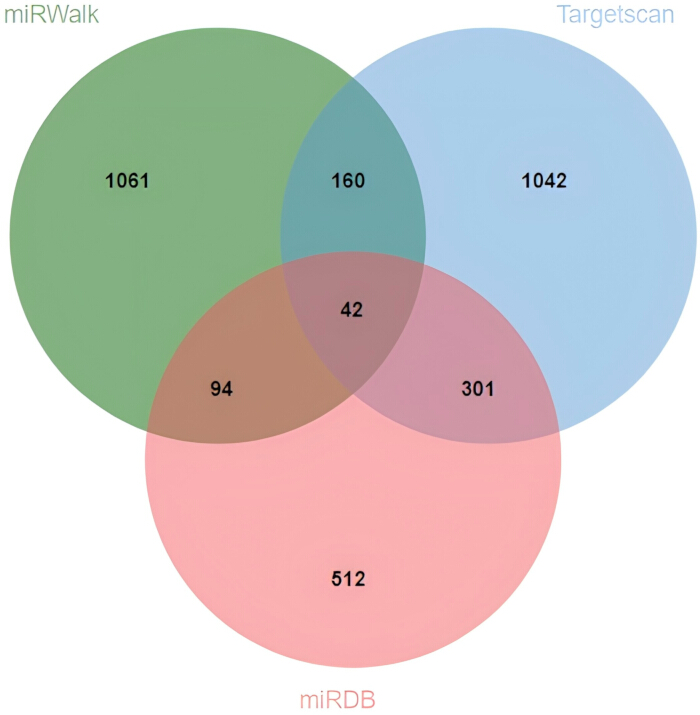
Figure 8: Predicted target genes of hsa-miR-641. The target genes of hsa-miR-641 predicted by TargetScan, miRWalk, and miRDB were RTF1, SEC14L1, BXN4, PPP1R9A, GNG12, NR2C2, FAM126B, FDX1, BDP1, CBX1, NF1, PDE4D, DTWD2, GSK3B, TRIM6, EIF4E, TMBIM1, NTRK2, NEO1, PPP2R2A, FBXL17, CAMK4, FGF13, NREP, AFTPH, TLE4, MBNL2, GPR180, SKP1, SCML2, TCF12, TP53INP2, UHMK1, PRPF4B, COPS2, VEZF1, TRIM49, ERCC6, TRIM10, PRSS16, PSME3, LMBR1. The central overlap highlights the 42 core target genes robustly identified by all three prediction algorithms, thereby minimizing false-positive predictions. As this figure represents an in silico intersection of database predictions rather than continuous quantitative data, statistical error bars and significance thresholds (p-values) are not applicable. The upstream input miRNAs used for this prediction were derived from our RNA-seq differential expression analysis (n = 3 biologically independent samples per group, identified by DESeq2 with adjusted p < 0.05). Please click here to view a larger version of this figure.
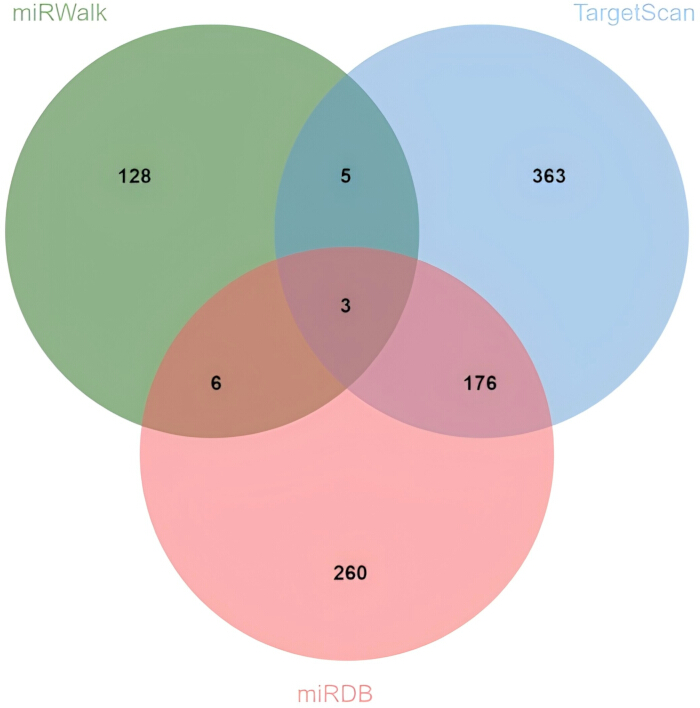
Figure 9: Predicted target genes of hsa-miR-519a-5p sharing a seed sequence with hsa-miR-519b-5p, hsa-miR-518e-5p, hsa-miR-522-5p, and hsa-miR-523-5p. The target genes of hsa-miR-519a-5p, as predicted by TargetScan, miRWalk, and miRDB, were NPL, HMGB3, and ATE1. The central overlap highlights the 3 core target genes robustly identified by all 3 prediction algorithms, thereby minimizing false-positive predictions. As this figure represents an in silico intersection of database predictions rather than continuous quantitative data, statistical error bars and significance thresholds (p-values) are not applicable. The upstream input miRNAs used for this prediction were derived from our RNA-seq differential expression analysis (n = 3 biologically independent samples per group, identified by DESeq2 with adjusted p < 0.05). Please click here to view a larger version of this figure.
| Case number | Age(year) | Menstruation | Marriage | Hypertension | Dyslipidemia | Diabetes |
| 1 | 62 | N | Y | N | N | N |
| 2 | 45 | Y | Y | N | N | N |
| 3 | 58 | N | Y | N | N | N |
| 4 | 46 | Y | Y | N | N | N |
| 5 | 52 | N | Y | N | N | N |
| 6 | 51 | Y | Y | N | N | N |
Table 1: Clinical information of case and control groups. This table summarizes the baseline demographic data, including age, menstrual status, marital history, and the presence of metabolic comorbidities (such as hypertension, dyslipidemia, and diabetes mellitus) for all participants recruited in this study. Cases 1–3 belong to the case group, and cases 4–6 belong to the control group. Yes(Y), No(N).
| Clinicopathological Variables | Patient 1 | Patient 2 | Patient 3 |
| Age (years) | 62 | 45 | 58 |
| Height (cm) / Weight (kg) | 150 / 59 | 151 / 45 | 160 / 54 |
| BMI (kg/m2) | 26.22 (Overweight) | 19.73 (Normal) | 21.09 (Normal) |
| Past Medical History | Spinal internal fixation (2020) | None | None |
| Inflammatory / Metabolic Conditions | Mild tricuspid regurgitation, mild pulmonary hypertension, hyperviscosity | Uterine fibroids, left renal cyst, pulmonary proliferative lesions | Hypocalcemia, mild anemia, intrahepatic bile duct stones |
| Histological Subtype | Invasive carcinoma, NOS | Invasive carcinoma, NOS | Invasive ductal carcinoma |
| Histological Grade | Grade III (8 points) | Not evaluated (limited cellularity from biopsy) | Not specified |
| Tumour Stage (TNM) | pT1N0M0 (Stage IA) | cT2N1M0 (Stage IIB) | pT1N0M0 (Stage IA) |
| ER Status | Positive (90%, strong) | Negative | Positive (100%, strong) |
| PR Status | Positive (80-90%, strong) | Negative | Positive (95%, strong) |
| HER2 Status | 2+ (Equivocal) | 3+ (Positive) | 1+ (Negative) |
| Ki-67 Proliferation Index | 10% - 20% | ~20% | 20% |
| Molecular Subtype | Luminal A | HR- / HER2+ | Luminal A |
| Metastatic Status | N0 (0/7 lymph nodes), M0 | cN1 (Axillary & infraclavicular), M0 | N0 (Sentinel lymph node), M0 |
| Treatment Status and Medication | Post-operative (Breast-conserving surgery); Adjuvant chemotherapy (AC regimen) | Pre-operative; Neoadjuvant targeted + chemotherapy (TCbHP regimen) | Post-operative (Modified radical mastectomy); Endocrine therapy |
Table 2: Clinicopathological characteristics of the sequenced breast cancer cohort. This table provides specific clinical parameters, treatment statuses, and baseline metabolic conditions for the individual breast cancer patients included in the sequencing discovery cohort. BMI, body mass index; NOS, not otherwise specified; TNM, tumor-node-metastasis; ER, estrogen receptor; PR, progesterone receptor; HER2, human epidermal growth factor receptor 2; HR, hormone receptor; AC, doxorubicin and cyclophosphamide; TCbHP, docetaxel, carboplatin, trastuzumab, and pertuzumab.
| Expression level | miRNA | Logarithmic value of difference multiple | Adjusted P-value |
| Upregulation | hsa-miR-4638-5p | 7.71187292 | 0.01486175 |
| hsa-miR-766-3p | 6.271111005 | 0.03735488 | |
| hsa-miR-487b-3p | 8.082615814 | 0.009566343 | |
| hsa-miR-6799-5p | 20.99585902 | 3.58E-08 | |
| hsa-miR-641 | 9.603470975 | 0.001720169 | |
| hsa-miR-3912-3p | 7.752573932 | 0.014009353 | |
| hsa-miR-376c-3p | 9.133311681 | 0.002789221 | |
| hsa-miR-3164 | 7.717783419 | 0.015674626 | |
| hsa-miR-6791-5p | 7.219439787 | 0.033914259 | |
| hsa-miR-431-5p | 8.059912522 | 0.010856777 | |
| hsa-miR-2115-3p | 6.876651722 | 0.038924319 | |
| hsa-miR-6780a-5p | 5.004777809 | 0.029282505 | |
| hsa-miR-3187-5p | 7.721883238 | 0.015732193 | |
| hsa-miR-323a-5p | 5.556742741 | 0.018750878 | |
| hsa-miR-380-5p | 7.234685332 | 0.011827018 | |
| hsa-miR-7848-3p | 7.874635775 | 0.014750769 | |
| hsa-miR-656-3p | 9.843639019 | 0.001454648 | |
| hsa-miR-6847-3p | 7.139595947 | 0.029000522 | |
| hsa-miR-676-3p | 8.115833962 | 0.00972282 | |
| hsa-miR-6726-3p | 7.441718892 | 0.021107377 | |
| hsa-miR-369-3p | 7.602368739 | 0.007346394 | |
| hsa-miR-3154 | 7.026638915 | 0.033350319 | |
| hsa-miR-9903 | 7.989717338 | 0.011060692 | |
| hsa-miR-4470 | 7.344674892 | 0.02413619 | |
| hsa-miR-4433a-3p | 4.038819788 | 0.028077846 | |
| hsa-miR-195-5p | 4.539922797 | 0.041320108 | |
| hsa-miR-6866-5p | 7.417352142 | 0.000560071 | |
| Downregulation | hsa-miR-522-5p | -9.544946827 | 0.000592779 |
| hsa-miR-329-5p | -6.36962291 | 0.038461531 | |
| hsa-miR-491-5p | -8.182607225 | 0.009558727 | |
| hsa-miR-4449 | -8.98858912 | 0.004611801 | |
| hsa-miR-3918 | -10.21148114 | 0.001116194 | |
| hsa-miR-7704 | -8.267124595 | 0.004062025 | |
| hsa-miR-5010-3p | -8.368067553 | 0.006683773 | |
| hsa-miR-6765-5p | -9.233784132 | 0.003219551 | |
| hsa-miR-518e-5p | -9.544946827 | 0.000592779 | |
| hsa-miR-4489 | -8.725867461 | 0.004839167 | |
| hsa-miR-6837-3p | -8.78942955 | 0.005205453 | |
| hsa-miR-519a-5p | -9.544946827 | 0.000592779 | |
| hsa-miR-4745-5p | -5.572569537 | 0.018825297 | |
| hsa-miR-6861-5p | -9.173867125 | 0.003195183 | |
| hsa-miR-147b-3p | -8.007389083 | 0.010157908 | |
| hsa-miR-523-5p | -9.544946827 | 0.000592779 | |
| hsa-miR-505-3p | -9.359786734 | 0.002695893 | |
| hsa-miR-4753-5p | -8.200773573 | 0.010345874 | |
| hsa-miR-519b-5p | -9.544946827 | 0.000592779 | |
| hsa-miR-519c-5p | -9.544946827 | 0.000592779 |
Table 3: Expression levels of named miRNAs in exosomes among the case and control groups. This table lists the detailed differential expression profiles of named miRNAs in plasma exosomes between the breast cancer and healthy control groups, including their regulation status, logarithmic fold changes (Log2FC), and statistically adjusted P-values.
Discusión
Breast cancer has a high global incidence and is one of the leading contributors to cancer-related deaths among women worldwide. As early-stage breast cancer often lacks typical symptoms and signs, patients may fail to promptly detect it. Delayed diagnosis can result in patients missing an optimal treatment window, contributing to a persistently high mortality rate21,22. Therefore, there is an urgent need to develop sensitive, specific, cost-effective, and accessible diagnostic and therapeutic strategies21. Exosomes—nanoscale extracellular vesicles secreted through endosomal exocytosis or plasma membrane budding—mediate intercellular communication via targeted delivery of bioactive cargo16,23. In this study, ultracentrifugation-isolated exosomes demonstrated diameter distributions (50–150 nm) and concentration meeting NTA validation standards24. This research identified significant upregulation of hsa-miR-6866-5p, hsa-miR-656-3p, hsa-miR-641, and hsa-miR-376c-3p, while hsa-miR-519a-5p, hsa-miR-519b-5p, hsa-miR-523-5p, hsa-miR-518e-5p, and hsa-miR-522-5p were markedly downregulated. Research has demonstrated that miR-10b contributes to metastasis and invasion in breast cancer, highlighting the functional significance of specific miRNAs in oncogenesis25. Notably, miR-376c-3p was reported to inhibit cell viability and induce G1-phase arrest in neuroblastoma cells by downregulating cyclin D1 expression26. Collectively, these findings indicate that dysregulated miRNAs may play critical roles in breast cancer development and represent promising candidates for diagnostic applications and therapeutic intervention.
The comparative analysis in this study revealed a distinct exosomal miRNA signature, characterized by the robust upregulation of hsa-miR-6866-5p, hsa-miR-376c-3p, hsa-miR-656-3p, and hsa-miR-641, alongside the concurrent downregulation of the hsa-miR-519 cluster (Figure 2). Notably, members of this downregulated cluster share an identical seed sequence, implying a coordinated regulatory network. The differentially expressed miRNAs identified in this case-control exosomal miRNA sequencing study may be critically linked to the initiation and progression of breast cancer. Ectopic expression of hsa-miR-376c-3p promotes programmed cell death in cell culture and curbs the growth of gastric carcinoma in animal models. Both in vitro and in vivo, hsa-miR-376c-3p serves a key function in suppressing gastric cancer proliferation and the expression of cancer-associated genes27. The differentially expressed molecules identified through exosomal miRNA sequencing not only serve as potential diagnostic biomarkers for other cancers but also provide new therapeutic targets based on their regulatory mechanisms. Subsequent functional experiments are warranted to validate the specific roles and molecular mechanisms of these miRNAs in breast cancer models, thereby facilitating their translation into clinical use. As master regulators of cellular processes, miRNAs engage in cross-species conserved interactions with >1/3 of the human transcriptome, enabling tunable gene expression control28. GO and KEGG pathway analyses of differentially expressed miRNAs revealed significant enrichment in biological processes, including axonogenesis, calcium ion transport, response to nutrient levels, synaptic transmission, and regulation of trans-synaptic signaling. These target genes were primarily involved in the Rap1, phospholipase D, oxytocin, sphingolipid, neurotrophin, and VEGF signaling pathways. Within the tumor microenvironment, Rap1 has been observed to be upregulated in various malignant tumors and bone-related diseases, such as breast cancer, and is known to regulate signaling pathways associated with migration, invasion, and distant metastasis in multiple malignant tumor cells, including breast cancer29. Among its diverse functions, phospholipase D is increasingly recognized as a key player in cell migration, invasion, and cancer metastasis30. Oxytocin, a cyclic neuropeptide, exerts its effects by activating the oxytocin receptor (OTR) throughout the nervous system. OTR, a classic G protein-coupled receptor, is considered a compelling target for cancer treatment. There is increasing data implicating OTR in breast cancer pathogenesis, and it is notably expressed in multiple breast cancer cell lines31. As fundamental constituents of lipids, sphingolipids perform vital functions in tumor cell proliferation and apoptosis, garnering increasing attention in the development of innovative anticancer strategies. The metabolism of sphingolipids, particularly its key enzymes and intermediates, plays a decisive role in modulating tumor cell activity and, consequently, clinical progression32. Functioning as a neurotrophin receptor, Tropomyosin-related kinase B (TrkB) specifically interacts with brain-derived neurotrophic factor (BDNF), which is essential for neuronal maturation and homeostasis. Experimental knockdown of TrkB in breast cancer cells reduces the frequency and growth of brain metastases in vivo, thereby supporting a model in which circulating cells colonize the brain via paracrine BDNF-TrkB signaling33. The key phases of breast cancer metastasis, encompassing detachment from the primary tumor, intravascular transport, as well as colonization and outgrowth in the liver, are modulated by signaling pathways such as mitogen-activated protein kinase (MAPK), nuclear factor kappa B (NFκB), and vascular endothelial growth factor (VEGF)34. Notably, bioinformatics predictions suggest that the activities of these pathways, which are vital in breast cancer, may be targeted by the miRNAs specifically identified in this study (such as the significantly upregulated hsa-miR-6866-5p, hsa-miR-641, and the downregulated hsa-miR-519 cluster). This hypothesized modulation operates through key biological processes, including axonogenesis, calcium ion transport, nutrient level response, synaptic transmission, and trans-synaptic signaling. This implies that these specific candidate miRNAs could potentially participate in breast cancer progression by reprogramming highly coordinated intercellular signaling networks. Consequently, in-depth experimental validation of the precise regulation of these pathways by specific miRNAs will provide novel insights into the pathogenesis and development of breast cancer.
While mainstream exosomal miRNA sequencing studies have frequently identified ubiquitous breast cancer biomarkers such as miR-21 or miR-12468, our Baise regional cohort highlighted a distinct signature that prominently features hsa-miR-6866-5p and the hsa-miR-519 cluster. This divergence might be attributed to the unique demographic composition, specific environmental exposures, and genetic background of the long-dwelling minority populations in our study area. Despite these profiling differences, the downstream functional enrichment in our cohort shows striking similarities to classical breast cancer mechanisms. Specifically, the implications of the MAPK and VEGF signaling pathways in our bioinformatic predictions align with established models of tumor angiogenesis and metastasis observed in broader populations35. This suggests that while the upstream epigenetic modulators (exosomal miRNAs) may exhibit high regional or ethnic specificity, they ultimately converge on conserved oncogenic pathways. To systematically investigate the potential functions of hsa-miR-6866-5p, hsa-miR-376c-3p, and hsa-miR-641, we employed a combined approach using three databases (TargetScan, miRDB, and miRWalk) to predict their downstream target genes. An intersection analysis was subsequently performed to identify the target genes common to all three databases for each miRNA (Figure 6, Figure 7, and Figure 8). As shown in Figure 6, four genes (RNF38, KCNN3, ISG20L2, and SGMS2) were commonly identified by TargetScan, miRWalk, and miRDB as targets of hsa-miR-6866-5p. Elevated ISG20L2 expression characterizes tumor tissues and correlates with advanced disease stages. As an abnormal molecule in breast cancer development, it is a promising candidate gene serving as a marker for both diagnosis and prognosis in breast cancer 36. Elevated SGMS2 expression correlates with breast cancer metastasis. The upregulation of SGMS2 elevates TGF-β1 expression by increasing sphingomyelin (SM), which in turn activates the TGF-β/Smad signaling pathway. This activation induces epithelial-mesenchymal transition (EMT) in breast cancer cells, consequently enhancing their migratory and invasive capabilities 37. Moreover, the oncogenic or suppressive potential of RNF38 and KCNN3 in breast cancer represents a significant knowledge gap, and their potential involvement in the progression of this malignancy warrants further investigation. As shown in Figure 7, only two genes (THSD7A and OTUD4) were common across all three databases for hsa-miR-376c-3p. THSD7A exhibits a markedly elevated prevalence in both human colorectal and breast carcinomas, positioning it as a pivotal mediator bridging malignancies and renal pathologies38. OTUD4 knockdown markedly impairs key malignant properties of triple-negative breast cancer (TNBC) cells, including clonogenicity, migration, invasion, and stemness in vitro, as well as metastatic ability in vivo39. As shown in Figure 8, for hsa-miR-641, 42 genes were identified at the intersection of all three databases. These consensus target genes were: RTF1, SEC14L1, BXN4, PPP1R9A, GNG12, NR2C2, FAM126B, FDX1, BDP1, CBX1, NF1, PDE4D, DTWD2, GSK3B, TRIM6, EIF4E, TMBIM1, NTRK2, NEO1, PPP2R2A, FBXL17, CAMK4, FGF13, NREP, AFTPH, TLE4, MBNL2, GPR180, SKP1, SCML2, TCF12, TP53INP2, UHMK1, PRPF4B, COPS2, VEZF1, TRIM49, ERCC6, TRIM10, PRSS16, PSME3, and LMBR1. SEC14L1 serves as a standalone predictor of outcomes in breast cancer; its correlation with lymphovascular invasion and prognosis at the transcriptome and protein expression levels may imply that it contributes significantly to cancer advancement40. Beyond its downregulation in malignant versus benign tissues, GNG12-AS1 expression correlates strongly with clinical outcomes—predicting improved survival in high-expressing cohorts—and with higher tumor grades and advanced stages. These findings collectively underscore its tumor-suppressive capacity in breast cancer41. In addition to the NR2E3/NR2C2 nuclear receptor network's role in governing breast cancer cell physiology, evidence suggests that NR2C2 may function to curb the tumorigenicity of estrogen receptor-positive (ER+) breast cancer subtypes42. TNBC cells exhibit markedly increased copper accumulation, and AKT1-mediated phosphorylation of FDX1 drives TNBC progression through suppression of cuproptosis43. Variations in BDP1 play a role in invasive mammary carcinoma; furthermore, BDP1 might serve as a promising biomarker in this malignancy44. Elevated levels of CBX1 correlate with deteriorated recurrence-free survival in all breast cancer cases, identifying it as a tractable interventional target for disease management45. NFI deficiency enhances cell proliferation, alters neurofibromin expression, and orchestrates metabolic rewiring in ER-positive breast malignancies46. Pharmacological inhibition of PDE4D represents a viable therapeutic avenue to circumvent tamoxifen resistance in ER+ breast cancer through the restoration of cAMP signaling47. miR-132-3p, which exhibits reduced expression in breast cancer, directly targets GSK3B and is implicated in regulating apoptosis, suggesting the miR-132-3p/GSK3B interaction as a promising new therapeutic target48. The progression of breast cancer is facilitated by TRIM6 through ubiquitination and proteasomal degradation of STUB1, leading to YAP1 pathway activation. This mechanism suggests TRIM6's potential as a therapeutic target49. The MNK1/2-eIF4E axis contributes to metastasis of postpartum mammary carcinoma, suggesting that blocking phosphorylated eIF4E may enhance immunotherapeutic efficacy50. hsa_circ_0006014 facilitates breast tumor progression by sequestering miR-885-3p, thereby modulating the NTRK2/PIK3CA/AKT axis51. As a regulatory subunit of PP2A phosphatase complexes, PPP2R2A upregulation enhances cancer cell survival and growth. Suppression of PPP2R2A expression was found to increase global O-GlcNAcylation levels in MDA-MB-231 cells52. Although FGF13 inhibition enhanced the motility and invasiveness of MDA-MB-231HM cells under laboratory conditions, it almost completely suppressed the spontaneous dissemination of orthotopic MDA-MB-231HM xenografts to the lungs and liver, with little effect on primary tumor growth. FGF13 could constitute a feasible treatment strategy to prevent the metastatic spread of certain triple-negative breast tumors53. HIF-1α-driven NREP upregulation promotes breast cancer aggressiveness and metastasis via glycolytic reprogramming54. TCF12-induced GRB7 cooperates with Notch1 to potentiate HER2+ breast cancer aggressiveness, converging on Wnt/β-catenin and MAPK/PI3K signaling to trigger EMT and proliferative phenotypes55. ERCC6 defines a novel low-penetrance breast cancer susceptibility locus that interacts epistatically with ERCC856. PSME3 overexpression or miR-186-5p blockade reverses PSMA3-AS1 loss-mediated suppression of TNBC oncogenicity57.
As shown in Figure 9, hsa-miR-519a-5p shares a seed sequence with hsa-miR-519b-5p, hsa-miR-518e-5p, hsa-miR-522-5p, and hsa-miR-523-5p. The downstream effectors of these miRNAs, as predicted by TargetScan, miRWalk, and miRDB, were NPL, HMGB3, and ATE1. High HMGB3 expression is an independent risk factor associated with breast cancer, and HMGB3 could serve as a promising biomarker in the detection and therapeutic management of breast cancer58. ATE1 promotes cellular proliferation, viability, and migration by enhancing MAPK-dependent MYC stabilization in a lineage-specific context, thereby facilitating breast cancer progression. These findings identify ATE1 as a viable interventional node59. A thorough examination of these predicted candidate genes reveals their strong associations with the development, progression, and clinical outcomes of breast cancer. For instance, several have been shown to participate in regulating essential cellular activities, including tumor cell growth, cell death, invasion, motility, and metabolic alterations. Subsequent survival assessment indicates that the expression patterns of numerous targets are strongly associated with patient survival, thereby identifying them as candidate prognostic biomarkers. Taken together, these miRNAs, which show the most significant expression differences across all upregulated and downregulated groups, may critically orchestrate breast tumorigenesis by fine-tuning a cohort of effectors that govern core oncogenic phenotypes. Therefore, in-depth studies on these significantly differentially expressed miRNAs and their regulatory networks will not only help deepen the comprehension of the molecular mechanisms of breast cancer but also might offer novel clues and actionable biomarkers for refining early detection, prognostic stratification, and precision-targeted interventions in breast cancer.
From a clinical perspective, the exosomal miRNAs identified herein hold substantial promise as non-invasive diagnostic biomarkers. Because exosomes protect miRNAs from RNase degradation in circulation, analyzing these vesicles provides a highly stable liquid-biopsy window into the tumor microenvironment. Nevertheless, translating these preliminary biomarker candidates into routine clinical practice faces significant hurdles. A major challenge lies in the lack of standardized, high-yield, and cost-effective exosome isolation protocols suitable for high-throughput clinical laboratories. Furthermore, the inherent biological heterogeneity of exosomes necessitates ultra-sensitive absolute quantification techniques. Future research must bridge this translational gap by integrating these novel miRNA signatures with advanced, amplification-free detection platforms—such as catalytic hairpin assembly or CRISPR-Cas-based nucleic acid biosensors60—to develop rapid, point-of-care diagnostic tools for early breast cancer screening.
Several critical limitations in this exploratory study must be explicitly acknowledged. Chief among these is the extremely small sequencing cohort (n=3 per group). Additionally, as shown in Table 2, baseline heterogeneity in BMI and treatment regimens among the cases represents potential confounding variables that warrant further decoupling in strictly matched, larger cohorts. This limited sample size severely restricts the statistical power of our findings, increases the susceptibility to inter-individual biological variation, and elevates the risk of false-positive discoveries. Consequently, this cohort cannot adequately capture the profound intra- and inter-tumor genetic heterogeneity characteristic of breast cancer; thus, the 265 differentially expressed miRNAs must be interpreted strictly as preliminary candidates. Secondly, regarding methodological constraints, although we characterized the isolated vesicles using TEM and NTA, the lack of protein-level validation of specific exosomal markers (e.g., CD9, CD63) and negative contamination controls (such as apolipoproteins) means that the absolute exosomal purity of the sequenced material remains only partially verified. Although our isolation protocol included a stringent ultracentrifugation wash step, the extreme complexity of blood serum means the possibility of trace lipoprotein co-precipitation cannot be entirely ruled out. Thirdly, the mechanistic insights rely exclusively on in silico bioinformatics predictions mapping plasma miRNA-mediated gene networks. The absolute absence of empirical functional validation—such as luciferase reporter assays to confirm direct miRNA-mRNA binding, or in vitro and in vivo phenotypic experiments (e.g., cell migration assays or xenograft models)—means the actual biological impact of these miRNAs on breast cancer progression remains entirely hypothetical. Future investigations must prioritize rigorous validation of these specific miRNA expressions using RT-qPCR in large, ethnically diverse prospective cohorts. Moreover, subsequent studies should integrate advanced purification methods, such as density gradient centrifugation or size-exclusion chromatography, to ensure higher extracellular vesicle purity and be accompanied by comprehensive molecular functional assays.
In conclusion, this exploratory study presents strictly preliminary findings regarding potentially dysregulated miRNAs—including hsa-miR-6866-5p, hsa-miR-376c-3p, hsa-miR-656-3p, hsa-miR-641, and the hsa-miR-519 cluster—by profiling plasma exosomal miRNAs in a highly restricted sequencing sub-cohort (comprising only 3 breast cancer patients and 3 matched controls) from Baise, China. Because these biomarker candidates were identified solely through high-throughput sequencing and in silico bioinformatics predictions, the current lack of orthogonal experimental validation (such as RT-qPCR) and functional assays inherently limits the statistical power and generalizability of these results. Therefore, rather than implying immediate clinical utility, future research must rigorously validate these specific miRNA signatures in larger, independent prospective cohorts and conduct comprehensive in vitro and in vivo functional assays to verify their biological relevance.
Divulgaciones
The Authors declare no potential conflicts of interest. The authors declare that no artificial intelligence (AI) tools, large language models (LLMs), or AI-assisted technologies were used in the preparation, drafting, or editing of this manuscript. Furthermore, no AI tools were employed in the generation, modification, or preparation of any figures, tables, or data presented in this study. All work is entirely original and conducted solely by the authors.
Agradecimientos
The authors acknowledge Zhizhai Luo from the Affiliated Hospital of Youjiang Medical University for Nationalities for sample collection, as well as Genesky Biotechnologies Inc. (Shanghai, China) for the Illumina NovaSeq sequencing service. This study was funded by the Natural Science Foundation of China (82260418), Natural Science Foundation of Guangxi (2024JJH140215, 2024JJH140265), First Batch of High-level Talent Scientific Research Projects of the Affiliated Hospital of Youjiang Medical University for Nationalities (R202011701), Baise Scientific Research and Technology Development Project (20232031, 20241534, 20250344), and Research Project of Guangxi Zhuang Autonomous Region Disease Prevention and Control Bureau (GXJKKJ24C010).
AUTHOR CONTRIBUTIONS:
Conceptualization: Guijiang Wei, Lina Liang. Data curation: Guangfu Pang, Shengshan Yuan, Chen Yang, Kunwang Su, Baoyan Ren, Guijiang Wei, Lina Liang. Investigation: Guangfu Pang, Kunwang Su, Baoyan Ren, Guijiang Wei, Lina Liang. Methodology: Guangfu Pang, Kunwang Su, Miao Li, Guijiang Wei. Supervision: Guijiang Wei, Lina Liang. Writing – original draft: Guangfu Pang, Shengshan Yuan, Chen Yang. Writing – review and editing: All authors
Materiales
| Nombre | Empresa | Número de catálogo | Comentarios |
|---|---|---|---|
| Acrylamide/Bis 19:1, 40% | Thermo Fisher Scientific, USA | - | |
| Agilent 2100 Bioanalyzer | Agilent Technologies, USA | https://www.agilent.com/en/product/automated-electrophoresis/bioanalyzer-systems | |
| Agilent RNA Pico 6000 Kit | Agilent Technologies, USA | NC1711873 | |
| Ambion Magnetic Stand | Thermo Fisher Scientific, USA | https://www.thermofisher.com/order/catalog/product/AM10050 | |
| bowtie (v1.2.3) | Open source (Langmead et al.) | http://bowtie-bio.sourceforge.net | |
| Centrifuge | Eppendorf, Germany | 5810R | |
| Chloroform | Sigma-Aldrich, USA | C2432 | |
| clusterProfiler (v2.4.2) | Bioconductor | https://bioconductor.org/packages/clusterProfiler | |
| Corning Costar Spin-X centrifuge tube filters | Sigma-Aldrich, USA | - | |
| DESeq2 (v1.10.1) | Bioconductor | https://bioconductor.org/packages/DESeq2 | |
| Ethanol | Sigma-Aldrich, USA | 1.00983 | |
| fastp (v0.19.5) | Open source (Chen et al.) | https://github.com/OpenGene/fastp | |
| Isopropanol | Sigma-Aldrich, USA | 190764 | |
| miRBase (v22) | University of Manchester | https://www.mirbase.org | |
| miRDB (v6.0) | Washington University | http://mirdb.org | |
| miRDeep2 (v0.1.3) | Open source (Friedländer et al.) | https://github.com/rajewsky-lab/mirdeep2 | |
| miRWalk (v3.0) | University of Heidelberg | http://mirwalk.umm.uni-heidelberg.de | |
| NanoDrop 2000 Spectrophotometer | Thermo Fisher Scientific, USA | https://www.thermofisher.com/order/catalog/product/ND-2000 | |
| Nanoparticle Tracking Analyzer | Particle Metrix, Germany | PMX120 | |
| NovaSeq High-throughput Platform | Illumina, USA | https://www.illumina.com/systems/sequencing-platforms/novaseq-x-plus.html | |
| Novex TBE Running Buffer (5X) | Thermo Fisher Scientific, USA | LC6675 | |
| Qubit 3.0 Spectrophotometer | Thermo Fisher Scientific, USA | https://www.thermofisher.com/order/catalog/product/Q33216/ | |
| Qubit dsDNA HS Kit | Thermo Fisher Scientific, USA | Q32851 | |
| Qubit RNA HS Kit | Thermo Fisher Scientific, USA | Q32852 | |
| R language (v4.1.2) | R Core Team | https://www.r-project.org | |
| TargetScan (v8.0) | Whitehead Institute | https://www.targetscan.org | |
| Thermal Cycler | Thermo Fisher Scientific, USA | ABI 2720 | |
| Transmission Electron Microscope | Hitachi, Japan | HT-7700 | |
| TRIzol Reagent | Thermo Fisher Scientific, USA | https://www.thermofisher.com/in/en/home/brands/product-brand/trizol.html | |
| TruSeq smallRNA sample Preparation kit | Illumina, USA | https://www.illumina.com/products/by-type/sequencing-kits/library-prep-kits/truseq-small-rna.html | |
| Uranyl Acetate | Sigma-Aldrich, USA | N/A |
Referencias
- Ye F, et al. Advancements in clinical aspects of targeted therapy and immunotherapy in breast cancer. Mol Cancer. 2023;22(1):105.
- Bray F, et al. Global cancer statistics 2022: GLOBOCAN estimates of incidence and mortality worldwide for 36 cancers in 185 countries. CA Cancer J Clin. 2024;74(3):229-63.
- Britt KL, Cuzick J, Phillips KA. Key steps for effective breast cancer prevention. Nat Rev Cancer. 2020;20(8):417-36.
- Liang L, et al. The impact of miR-34a on endothelial cell viability and apoptosis in ischemic stroke: unraveling the MTHFR-homocysteine pathway. Clin Invest Med. 2024;47(3):27-37.
- Shang R, Lee S, Senavirathne G, Lai EC. microRNAs in action: biogenesis, function and regulation. Nat Rev Genet. 2023;24(12):816-33.
- Hill M, Tran N. miRNA interplay: mechanisms and consequences in cancer. Dis Model Mech. 2021;14(4):dmm047662.
- Zhang M, et al. circRNA-miRNA-mRNA in breast cancer. Clin Chim Acta. 2021;523:120-30.
- Hannafon BN, et al. Plasma exosome microRNAs are indicative of breast cancer. Breast Cancer Res. 2016;18(1):90.
- Li J, He D, Bi Y, Liu S. The emerging roles of exosomal miRNAs in breast cancer progression and potential clinical applications. Breast Cancer (Dove Med Press). 2023;15:825-40.
- Thakur P, et al. Exosomal miRNAs as next-generation therapy vehicles in breast cancer. Curr Gene Ther. 2023;23(5):330-42.
- Zhang L, Yu D. Exosomes in cancer development, metastasis, and immunity. Biochim Biophys Acta Rev Cancer. 2019;1871(2):455-68.
- Shi F, et al. HOTAIR/miR-203/CAV1 crosstalk influences proliferation, migration, and invasion in the breast cancer cell. Int J Mol Sci. 2022;23(19):11755.
- Ho PTB, Clark IM, Le LTT. MicroRNA-based diagnosis and therapy. Int J Mol Sci. 2022;23(13):7167.
- Lan H, et al. Differential analysis of microRNAs in plasma exosomes in patients with cerebral ischemic stroke. Medicine (Baltimore). 2024;103(48):e40677.
- Duan H, et al. Isodon Suzhouensis extract interferes with miRNA expression profile for prevention and treatment of chronic obstructive pneumonia disease. Food Sci Hum Wellness. 2024.
- Krylova SV, Feng D. The machinery of exosomes: biogenesis, release, and uptake. Int J Mol Sci. 2023;24(2):1337.
- Zhou Y, et al. The role of exosomes and their applications in cancer. Int J Mol Sci. 2021;22(22):12204.
- Zhai KF, et al. miRNAs from plasma extracellular vesicles are signatory noninvasive prognostic biomarkers against atherosclerosis in LDLr(-/-) mice. Oxid Med Cell Longev. 2022;2022:6887192.
- S ELA, Mäger I, Breakefield XO, Wood MJ. Extracellular vesicles: biology and emerging therapeutic opportunities. Nat Rev Drug Discov. 2013;12(5):347-57.
- Zhai K, et al. Extracellular vesicle-derived miR-146a as a novel crosstalk mechanism for high-fat induced atherosclerosis by targeting SMAD4. J Adv Res. 2025;73:729-41.
- Seely JM, Alhassan T. Screening for breast cancer in 2018-what should we be doing today? Curr Oncol. 2018;25(Suppl 1):S115-24.
- Wang J, Wu SG. Breast cancer: an overview of current therapeutic strategies, challenge, and perspectives. Breast Cancer (Dove Med Press). 2023;15:721-30.
- He C, Zheng S, Luo Y, Wang B. Exosome theranostics: biology and translational medicine. Theranostics. 2018;8(1):237-55.
- Welsh JA, et al. Minimal information for studies of extracellular vesicles (MISEV2023): from basic to advanced approaches. J Extracell Vesicles. 2024;13(2):e12404.
- Ma L, Teruya-Feldstein J, Weinberg RA. Tumour invasion and metastasis initiated by microRNA-10b in breast cancer. Nature. 2007;449(7163):682-8.
- Bhavsar SP, Løkke C, Flægstad T, Einvik C. Hsa-miR-376c-3p targets Cyclin D1 and induces G1-cell cycle arrest in neuroblastoma cells. Oncol Lett. 2018;16(5):6786-94.
- Tu L, et al. hsa-miR-376c-3p regulates gastric tumor growth both in vitro and in vivo. Biomed Res Int. 2016;2016:9604257.
- Lewis BP, Burge CB, Bartel DP. Conserved seed pairing, often flanked by adenosines, indicates that thousands of human genes are microRNA targets. Cell. 2005;120(1):15-20.
- Liang H, et al. Ras-proximate-1 (RAP1): a prognosis and therapeutic target in the metastatic spread of breast cancer. Clin Exp Metastasis. 2025;42(3):23.
- Gomez-Cambronero J. Phospholipase D in cell signaling: from a myriad of cell functions to cancer growth and metastasis. J Biol Chem. 2014;289(33):22557-66.
- Liu H, et al. The oxytocin receptor signalling system and breast cancer: a critical review. Oncogene. 2020;39(37):5917-32.
- Pei S, et al. Exploring the role of sphingolipid-related genes in clinical outcomes of breast cancer. Front Immunol. 2023;14:1116839.
- Choy C, et al. Cooperation of neurotrophin receptor TrkB and Her2 in breast cancer cells facilitates brain metastases. Breast Cancer Res. 2017;19(1):51.
- Chen X, Zheng Z, Chen L, Zheng H. MAPK, NFκB, and VEGF signaling pathways regulate breast cancer liver metastasis. Oncotarget. 2017;8(60):101452-60.
- Fox SB, Generali DG, Harris AL. Breast tumour angiogenesis. Breast Cancer Res. 2007;9(6):216.
- Yin J, et al. CENPL, ISG20L2, LSM4, MRPL3 are four novel hub genes and may serve as diagnostic and prognostic markers in breast cancer. Sci Rep. 2021;11(1):15610.
- Zheng K, et al. Sphingomyelin synthase 2 promotes an aggressive breast cancer phenotype by disrupting the homoeostasis of ceramide and sphingomyelin. Cell Death Dis. 2019;10(3):157.
- Xian L, et al. Expression of THSD7A in neoplasm tissues and its relationship with proteinuria. BMC Nephrol. 2019;20(1):332.
- Ma X, et al. Deubiquitinating enzyme OTUD4 regulates metastasis in triple-negative breast cancer by stabilizing Snail1. Exp Cell Res. 2024;434(1):113864.
- Sonbul SN, et al. Saccharomyces cerevisiae-like 1 (SEC14L1) is a prognostic factor in breast cancer associated with lymphovascular invasion. Mod Pathol. 2018;31(11):1675-82.
- Záveský L, et al. Long non-coding RNAs PTENP1, GNG12-AS1, MAGI2-AS3 and MEG3 as tumor suppressors in breast cancer and their associations with clinicopathological parameters. Cancer Biomark. 2024;40(1):61-78.
- Xie S, et al. Regulation of the stem-like properties of estrogen receptor-positive breast cancer cells through NR2E3/NR2C2 signaling. Exp Ther Med. 2023;26(4):474.
- Sun Z, et al. AKT1 phosphorylates FDX1 to promote cuproptosis resistance in triple-negative breast cancer. Adv Sci (Weinh). 2025;12(17):e2408106.
- Cabarcas-Petroski S, Schramm L. BDP1 alterations correlate with clinical outcomes in breast cancer. Cancers (Basel). 2022;14(7):1658.
- Liang YK, Lin HY, Chen CF, Zeng D. Prognostic values of distinct CBX family members in breast cancer. Oncotarget. 2017;8(54):92375-87.
- House RRJ, et al. NF1 deficiency drives metabolic reprogramming in ER+ breast cancer. Mol Metab. 2024;80:101876.
- Mishra RR, et al. Reactivation of cAMP pathway by PDE4D inhibition represents a novel druggable axis for overcoming tamoxifen resistance in ER-positive breast cancer. Clin Cancer Res. 2018;24(8):1987-2001.
- Xu C, Du Z, Ren S, Pian Y. Downregulation of GSK3B by miR-132-3p enhances etoposide-induced breast cancer cell apoptosis. Ann Clin Lab Sci. 2021;51(3):285-94.
- Wei C, et al. Tripartite motif-containing protein 6 facilitates growth and migration of breast cancer through degradation of STUB1. Eur J Histochem. 2021;65(1):3214.
- Guo Q, et al. The MNK1/2-eIF4E axis supports immune suppression and metastasis in postpartum breast cancer. Cancer Res. 2021;81(14):3876-89.
- Zhou X, et al. Circular RNA_0006014 promotes breast cancer progression through sponging miR-885-3p to regulate NTRK2 and PIK3/AKT pathway. Aging (Albany NY). 2022;14(7):3105-28.
- Li X, Zhang J, Ma D. [PPP2R2A binds and dephosphorylates GFPT2 in breast cancer cells]. Sheng Wu Gong Cheng Xue Bao. 2018;34(6):956-63.
- Johnstone CN, et al. FGF13 promotes metastasis of triple-negative breast cancer. Int J Cancer. 2020;147(1):230-43.
- Ruan Y, Qiao J, Wang J, Liu Z. NREP, transcriptionally upregulated by HIF-1α, aggravates breast cancer cell growth and metastasis by promoting glycolysis. Cell Death Discov. 2024;10(1):210.
- Wang G, et al. TCF12-regulated GRB7 facilitates the HER2+ breast cancer progression by activating Notch1 signaling pathway. J Transl Med. 2024;22(1):745.
- Moslehi R, et al. Integrative genomic analysis implicates ERCC6 and its interaction with ERCC8 in susceptibility to breast cancer. Sci Rep. 2020;10(1):21276.
- Peng M, Yuan H. LncRNA PSMA3-AS1 activates the progression of triple-negative breast cancer cells by blocking miR-186-5p-mediated PSME3 inhibition. Cell Mol Biol (Noisy-le-grand). 2023;69(14):81-7.
- Zhou X, et al. Overexpression of HMGB3 and its prognostic value in breast cancer. Front Oncol. 2022;12:1048921.
- Nawale L, et al. ATE1 promotes breast cancer progression via arginylation-dependent regulation of MAPK-MYC signaling. Cell Commun Signal. 2025;23(1):390.
- Zhuang S, Luo W, Lan B, Liu Y. Strategic design and engineering of CRISPR/Cas-powered sensing platforms for enhanced nucleic acid detection. ACS Sens. 2026;11(7):5342-5359.