Cette étude présente RareCode, un cadre d'apprentissage profond non supervisé qui détecte des anomalies dans les images histopathologiques du cancer colorectal en analysant la rareté d'activation du carnet de codes (CAR), avec un potentiel d'assistance au préscreening sans données d'entraînement annotées.
Article de recherche
RareCode : Un cadre d'apprentissage profond non supervisé pour la détection d'anomalies dans les images histopathologiques du cancer colorectal
Dans cet article
Résumé
Résumé
La détection non supervisée d'anomalies dans les images histopathologiques a été largement explorée à l'aide d'approches fondées sur la reconstruction qui mesurent les erreurs de reconstruction, mais ces méthodes échouent souvent à capturer les variations pathologiques subtiles au niveau sémantique en raison de l'hétérogénéité intrinsèque des textures tissulaires. Pour pallier cette limitation, cette étude présente RareCode, un cadre basé sur la quantification vectorielle qui étend le paradigme de détection au-delà de la reconstruction au niveau des pixels, en intégrant une analyse des activations au niveau sémantique du carnet de codes. L'innovation principale réside dans le score de rareté d'activation du carnet de codes (CAR), qui caractérise la fréquence d'activation de chaque entrée du carnet de codes durant l'apprentissage sur des échantillons exclusivement normaux, et signale les activations rares comme des indicateurs d'anomalie au moment de l'inférence, complétant ainsi les erreurs de reconstruction par une discrimination au niveau sémantique. S'appuyant sur ce mécanisme CAR monocouche, un module de carnet de codes hiérarchique multi-échelle (MHC) est ensuite introduit, utilisant des carnets de codes de tailles variées et des poids d'agrégation apprenables afin de capturer des motifs pathologiques allant des structures tissulaires globales aux détails cellulaires fins. Grâce à cette conception multi-échelle, des cartes de chaleur d'anomalie hiérarchiques sont générées à chaque niveau de granularité du carnet de codes, fournissant aux pathologistes des indices visuels interprétables et multidimensionnels indiquant à la fois l'emplacement et le niveau structural des anomalies. Une validation croisée en cinq plis sur un jeu de données d'images histopathologiques annotées cliniquement, provenant de l'hôpital populaire de Shenzhen, démontre que RareCode atteint une aire sous la courbe (AUC) de 96,82 %, surpassant les méthodes de référence. Une analyse par classe a révélé des performances supérieures pour la détection du cancer (AUC = 99,44 %, spécificité = 94,21 %) par rapport à la détection de l'inflammation (AUC = 94,30 %, spécificité = 60,44 %). Ces résultats suggèrent que l'analyse CAR pourrait offrir une approche non supervisée prometteuse pour la détection d'anomalies histopathologiques, pouvant potentiellement aider au préscreening clinique du diagnostic du cancer colorectal.
Introduction
Le dépistage histopathologique fiable du cancer colorectal reste limité par l'annotation réalisée par des experts et par l'examen manuel, particulièrement lorsque les lésions inflammatoires et les tumeurs malignes présentent une morphologie chevauchante1,2. Ces limitations justifient le recours à des approches computationnelles non supervisées capables d'apprendre à partir de tissus normaux sans nécessiter d'annotations exhaustives des anomalies3,4.
L'urgence clinique du dépistage histopathologique automatisé est soulignée par le déséquilibre croissant entre la demande diagnostique et l'expertise pathologique disponible, la charge de travail diagnostique par pathologiste aux États-Unis ayant augmenté de plus de 40 % en une seule décennie alors que l'effectif de pathologistes continue de diminuer5. Dans le cancer colorectal (CCR), des programmes de dépistage organisés ont été associés à une réduction de la mortalité de 29 à 68 %6, mais la capacité d'analyse pathologique manuelle reste limitée par la disponibilité des effectifs. Un système de présélection automatisé capable d'identifier de manière fiable les cas suspects nécessitant un examen prioritaire pourrait aider à alléger cette charge et à améliorer les délais de diagnostic. Toutefois, le déploiement de tels systèmes exige à la fois une sensibilité élevée pour éviter de manquer les vrais positifs et une spécificité adéquate pour prévenir un nombre excessif de faux positifs7.
La détection non supervisée d'anomalies (UAD) devient de plus en plus pertinente dans l'analyse d'images médicales8, car elle permet de modéliser les distributions des tissus normaux sans nécessiter d'étiquettes d'apprentissage pour les anomalies3,9,10. Les modèles fondés sur la reconstruction, notamment les autoencodeurs, les autoencodeurs variationnels, les réseaux antagonistes génératifs et leurs variantes augmentées par mémoire, identifient les anomalies à partir des erreurs de reconstruction, mais les decodeurs à haute capacité peuvent néanmoins reconstruire les régions anormales avec une grande fidélité11,12,13,14,15,16,17. Les méthodes basées sur les caractéristiques, telles que PatchCore et PaDiM, utilisent des représentations pré-entraînées, bien que les caractéristiques apprises à partir d'images naturelles ne capturent pas toujours complètement les atypies microscopiques en histopathologie18,19,20,21. Les modèles fondamentaux spécifiques à la pathologie et les détecteurs d'anomalies basés sur la diffusion offrent des alternatives puissantes, mais leurs besoins en données ou leurs coûts computationnels peuvent limiter leur utilisation directe dans le dépistage à haut débit22,23. Des méthodes récentes automatisées et évolutionnaires, telles que EvoAAE24 et MoARNN-AM25, illustrent davantage l'intérêt de l'optimisation adaptative des modèles pour la détection d'anomalies, bien que leurs contextes d'application diffèrent de l'analyse d'images histopathologiques. En revanche, les méthodes basées sur la quantification vectorielle (VQ) imposent des contraintes de dictionnaire discret qui peuvent réduire la correspondance identitaire ; toutefois, les approches VQ existantes s'appuient encore principalement sur les erreurs de reconstruction spatiale et exploitent insuffisamment l'information sémantique contenue dans les motifs d'activation du dictionnaire26,27.
Bien que les méthodes susmentionnées démontrent des performances prometteuses dans des domaines généraux, leur application à des scénarios histopathologiques complexes fait face à des défis spécifiques. Les images histopathologiques se caractérisent par une hétérogénéité tissulaire complexe à travers plusieurs niveaux structurels28. En pratique, l'analyse d'image opère généralement sur des fragments d'image locaux extraits de sections tissulaires, et le diagnostic pathologique est intrinsèquement multi-échelle : les pathologistes évaluent la morphologie des glandes et des tissus à faible grossissement, tout en examinant le polymorphisme nucléaire et les figures mitotiques à fort grossissement29. Nous identifions trois limitations majeures des approches actuelles : premièrement, les anomalies pathologiques et les tissus normaux présentent une grande similarité dans les caractéristiques visuelles de bas niveau, telles que les styles de coloration et les textures locales, ce qui conduit les méthodes fondées sur la reconstruction à échouer dans la détection d'anomalies subtiles, car des échantillons normaux et anormaux peuvent produire une qualité de reconstruction similaire au niveau sémantique. Deuxièmement, la plupart des méthodes existantes utilisent une extraction de caractéristiques à une seule échelle, ce qui rend difficile la capture simultanée des caractéristiques anormales aux niveaux tissulaire et cellulaire30,31. Troisièmement, bien que les méthodes dominantes puissent générer des cartes de chaleur au niveau des pixels, elles échouent souvent à représenter intuitivement les attributs hiérarchiques des anomalies, limitant ainsi l'utilité de ces modèles comme aides diagnostiques cliniques.
Pour répondre aux défis susmentionnés, nous proposons RareCode, un cadre d'apprentissage non supervisé pour la détection d'anomalies (UAD) qui explore les motifs d'activation des codebooks et la représentation hiérarchique des caractéristiques à plusieurs niveaux d'abstraction. Ce cadre introduit trois composants principaux : (1) le mécanisme de notation basé sur la rareté d'activation du codebook (CAR), qui calcule des scores de rareté à partir des fréquences d'activation des entrées entraînées exclusivement sur des échantillons normaux, permettant ainsi de distinguer les échantillons normaux des échantillons anormaux au niveau sémantique et fournissant des signaux discriminants complémentaires aux erreurs traditionnelles de reconstruction spatiale. (2) L'architecture de fusion de codebooks hiérarchiques multi-échelles (MHC), qui capture les caractéristiques pathologiques à plusieurs niveaux de granularité — depuis les motifs structurels grossiers jusqu'aux détails cellulaires fins — en utilisant des codebooks de capacités variables, la fusion adaptative étant réalisée grâce à des poids apprenables. (3) Le module de localisation hiérarchique interprétable, qui exploite l'architecture multi-échelle pour générer des cartes de chaleur d'anomalie à différentes granularités, offrant ainsi aux pathologistes des références diagnostiques sémantiquement interprétables et multi-échelles.
L'hypothèse principale de cette étude était que les profils de fréquence d'activation de codebook, dérivés de codebooks entraînés exclusivement sur des images histopathologiques colorectales normales, coderaient des informations sémantiques pertinentes pour la détection d'anomalies allant au-delà de l'erreur de reconstruction au niveau des pixels, et qu'une intégration multi-échelle de ces signaux complémentaires améliorerait la discrimination des images contenant des tissus cancéreux ou inflammatoires par rapport aux images normales, comparé aux méthodes représentatives de détection d'anomalies non supervisées (UAD), évaluée principalement par l'AUC. Pour tester cette hypothèse, nous avons évalué RareCode à l'aide d'une validation croisée en 5 folds sur un jeu de données CRC annoté cliniquement, et réalisé des analyses d'ablation et de localisation afin d'examiner les contributions et l'interprétabilité de ses composants essentiels.
Protocole
This study was approved by the Clinical Research Ethics Committee of Shenzhen People's Hospital (Approval No. LL-KY-2025300-01). The requirement for informed consent was waived by the ethics committee because this retrospective study used existing histopathological images and clinical materials without direct patient contact or intervention. All clinical data and histopathological images were de-identified before analysis, and no personally identifiable information was used in this study. All data used in this research were handled in accordance with the ethical standards of the institutional and national research committees.
Framework overview
The overall architecture of the proposed UAD framework, RareCode, is illustrated in Figure 1. The framework employs a parallel dual-branch architecture. For each 512 x 512 input image, non-overlapping 32 x 32 and 64 x 64 patches are extracted as fine- and coarse-scale inputs, respectively. The 64 x 64 patches are resized to 32 x 32 before being passed to the network so that both branches share the same encoder-decoder input size while preserving different receptive fields. Encoders in each branch map the extracted features into a latent space, where the MHC module imposes discretization constraints. Subsequently, decoders reconstruct the image from quantized features to compute spatial-domain reconstruction errors. The CAR mechanism then measures the degree of semantic-level anomaly by profiling codebook activation frequencies. Finally, the model fuses reconstruction scores and CAR scores through a weighted combination to obtain image-level anomaly scores. The RareCode framework is trained end-to-end using only normal samples, requiring no anomaly annotations. The dual-branch design was used to capture both local cellular features and broader glandular structures. The MHC module was used to model these features with codebooks of different capacities.
Encoder-decoder architecture
RareCode constructs structurally independent encoders and decoders for the fine- and coarse-scale branches. Each branch uses the same encoder-decoder design but does not share parameters. The encoder consists of four convolutional blocks, each including a 3 x 3 convolution, batch normalization, ReLU activation, and dropout. The channel width increases from 64 to 128, then to 256, and the final feature map is flattened and projected into a 64-dimensional latent embedding. The decoder mirrors the encoder with a fully connected projection layer followed by four transposed convolution layers, reconstructing each patch to the original input size of the network. Reconstruction error is calculated as the mean squared error between the input and reconstructed patches. By combining this encoder-decoder structure with discrete codebook constraints, RareCode learns compact representations of normal tissue and measures deviations during inference.
Multi-scale hierarchical codebook
To capture pathological features at multiple levels of abstraction—from broad tissue patterns to localized cellular variations—the MHC module employs K discrete codebooks  with varying capacities n1, n2, ..., nK. In the final FourScales configuration, each branch contains four codebooks with 64, 128, 256, and 512 entries, respectively, and each codebook entry has a 64-dimensional embedding. For each encoded patch feature, the nearest codebook entry is selected according to Euclidean distance. The quantized outputs from different codebooks are then fused using learnable weights normalized across codebooks. Smaller codebooks, due to stronger compression constraints, are expected to encode coarse-grained prototypical patterns that abstract away local variations, whereas larger codebooks preserve finer-grained features that capture more specific structural characteristics. For each codebook
  , where ek(i)
  Rd denotes the i-th embedding vector in the k-th codebook, continuous features are mapped to the discrete codebook space via nearest neighbor lookup (Eq. 1 and 2):


To achieve adaptive fusion of multi-scale features, we introduce learnable weights . After softmax normalization, weighted summation is performed over the quantized outputs from each codebook (Eq. 3):

where σ(·) denotes the softmax function, ensuring that weights satisfy Σk σ(wk) = 1. This design enables the model to automatically adjust the contribution ratios of codebooks at different granularities based on the semantic content of the input features.
To optimize codebook learning, we adopt the standard VQ loss function (Eq. 4):

where sg[·] denotes the stop-gradient operation, and β = 0.25 is the commitment loss weight coefficient. The first term encourages codebook vectors to move toward encoder outputs, while the second term encourages encoder outputs to remain consistent with their corresponding codebook vectors. The complete mechanism of multi-scale VQ is illustrated in Figure 2.
Codebook activation rarity scoring
CAR measures semantic-level anomalies based on codebook activation statistics estimated from normal training samples. After model training, all normal training images were passed through the encoder and MHC module without data augmentation. For each branch and each codebook, the assignment index of every patch feature was recorded, and the number of assignments to each codebook entry was counted. The counts were then normalized to obtain the activation-frequency distribution for that codebook (Eq. 5):

During inference, each test image was processed through the same patch extraction, encoding, and nearest-neighbor codebook assignment procedure. For each assigned codebook entry, the rarity score is calculated as the negative logarithm of its activation frequency in the normal training set (Eq. 6):

where ε is a small constant used for numerical stability. A low-frequency codebook entry, therefore, receives a higher rarity score, suggesting that the corresponding patch feature is less consistent with the learned normal-tissue distribution. Patch-level rarity scores were averaged within each image and across the fine- and coarse-scale branches to obtain an image-level rarity response.
To complement activation-frequency rarity, we also compute a percentile-based quantization distance score (Eq. 7):

This score is derived from the Euclidean distance between each encoded feature vector and its nearest codebook entry. The distance distribution is estimated from normal training samples, and test-sample distances are converted into percentile scores. Larger percentile scores indicate that the encoded feature is more difficult to represent using the learned normal codebook prototypes.
The final CAR score combines activation rarity and quantization distance across all codebooks using the learnable codebook weights (Eq. 8):

The same normalized codebook weights used for multi-scale feature fusion are applied to score-level fusion, maintaining consistency between representation learning and anomaly scoring. The resulting CAR score is calculated at the image level and is then combined with the reconstruction score to obtain the final anomaly score. The overall CAR scoring mechanism is illustrated in Figure 3.
Final anomaly score computation
We fuse spatial-domain reconstruction errors with semantic-level CAR scores. Before fusion, both scores are separately normalized using percentile-based min-max normalization to reduce the influence of extreme outliers. The final image-level anomaly score is then defined as (Eq. 9):

where Srecon denotes the normalized mean squared reconstruction error, reflecting sample reconstruction quality in pixel space; SCAR is the CAR score described above, capturing degrees of semantic-level anomaly. The hyperparameter α [0,1] controls the relative weighting between the two components, with optimal values determined on validation sets.
Training objective
The RareCode framework is trained end-to-end using only normal samples. The total training loss comprises the following components (Eq. 10):

Each term is defined as follows: Reconstruction Loss:  , measuring the mean squared error between input patches p and reconstructed patches D(zq) after quantization. This loss is applied separately to the 32 × 32 patch branch (
 ) and 64 × 64 patch branch (
 ) to ensure effective learning of features at both spatial scales.
Dataset description
To evaluate RareCode, experiments were conducted on a clinically annotated CRC histopathological image dataset comprising images of colorectal tissue sections stained with hematoxylin and eosin (H&E), obtained from Shenzhen People's Hospital. All images in this dataset originate from real clinical cases. Images were digitized at 40x magnification with an original resolution of 1024 × 1024 pixels. To ensure annotation reliability and quality, all sample category labels were jointly reviewed and confirmed by two or more senior professional pathologists following a double-blind protocol.
Based on histopathological characteristics, the dataset was categorized into three classes: normal tissue (1,226 images), cancer (1,215 images), and inflammation (1,214 images). In the binary UAD setting, cancer and inflammation samples were treated as anomalous, while normal samples served as the reference distribution. This formulation reflects the intended triage task of separating cases requiring further pathological review from those that are morphologically normal.
All H&E-stained images were resized to 512 × 512 pixels before being used as network input. Stratified 5-fold cross-validation was used for evaluation. In each fold, the normal samples were first divided into training, validation, and held-out test subsets. RareCode was trained only on the training normal samples. The validation subset, which also contained only normal samples, was used for model selection, hyperparameter tuning, and selection of the fusion weight α. The held-out test set, consisting of unseen normal samples and anomalous samples including cancer and inflammation, was used only for final performance evaluation and was not used for model training, hyperparameter selection, or α selection. The representative categories, dataset structure, and validation protocol are shown in Figure 4.
Implementation details
The proposed RareCode framework and comparison baselines were implemented using PyTorch. All experiments were conducted on a workstation equipped with a single NVIDIA GeForce RTX 4060 Ti GPU (16 GB). For network architecture configuration, to capture features at different spatial extents, the dual-branch architecture processes non-overlapping patches at two scales: 32 × 32 pixels (smaller receptive field, capturing local texture patterns) and 64 × 64 pixels (larger receptive field, capturing broader spatial context), respectively. The continuous feature embedding dimension produced by both branch encoders is uniformly set to 64. In the MHC module, we configure four codebooks with different capacities for each branch, with discrete prototype quantities of 64, 128, 256, and 512, respectively.
During optimization, the network was trained end-to-end for 50 epochs with a batch size of 8. We employ the AdamW optimizer for weight updates, with an initial learning rate of 5 × and weight decay of to prevent overfitting. Additionally, to ensure smooth training convergence, a cosine annealing learning rate schedule was used, enabling finer optimization in later training stages. Patch sizes and codebook sizes were selected to balance multi-scale representation and computational cost. The final FourScales configuration was supported by ablation analysis, and α was selected on the validation set before test-set evaluation.
For the decoder-complexity ablation, a complex-decoder variant was implemented based on the FourScales configuration. This variant used the same data split, codebook sizes, training epochs, optimizer, learning rate, validation-based α selection, and evaluation metrics as the FourScales model. The basic decoder was replaced with an EMCAD-style decoder containing multi-scale depthwise convolution blocks and Convolutional Block Attention Modules (CBAM). After each of the first three transposed-convolution upsampling stages, parallel 3 × 3, 5 × 5, and 7 × 7 depthwise convolutions were applied, followed by 1 × 1 pointwise fusion, batch normalization, ReLU activation, a residual connection, and CBAM attention. CBAM included channel attention based on average- and max-pooling descriptors and spatial attention using a 7 × 7 convolution. The final stage used transposed convolution and sigmoid activation to reconstruct 32 × 32 patches.
Résultats
Comparison with baseline methods
To evaluate the RareCode framework, multiple representative UAD methods were selected as baselines, spanning reconstruction-based methods (CAE32, VAE12, SAE33, MAE34, PatchSAE35), memory-augmented reconstruction (MemAE36), knowledge distillation (STFPM37), synthetic anomaly generation (DRAEM38), and pretrained feature extraction (PatchCore18). Baseline selection focused on methods that can be trained or applied under comparable computational budgets and data assumptions (access only to unlabeled normal training samples), thereby ensuring that performance differences reflect methodological contributions rather than disparities in pretraining data scale. To ensure fair comparison, all methods were evaluated using the same 5-fold data splits, preprocessing pipeline, evaluation metrics, and computational environment. Models were trained under the same UAD protocol using only normal training samples, with hyperparameters and thresholds selected on the validation set and final performance assessed only on the held-out test set. Table 1 summarizes 5-fold cross-validation results, and Figure 5 provides multi-metric radar chart comparisons.
As shown in Table 1 and Figure 5, RareCode achieves favorable detection performance and statistical stability on the CRC dataset. In terms of AUC, RareCode (96.82 ± 0.23%) outperforms multiple reconstruction-based baseline models, including MemAE (94.97 ± 0.81%). Statistical analysis confirms that RareCode outperforms all reconstruction-based baselines (paired t-tests, p < 0.05), with the improvement over MemAE reaching statistical significance (p < 0.01). RareCode exhibits low performance variance (standard deviation of 0.23%), indicating consistent cross-fold stability. The limited effectiveness of DRAEM, based on synthetic anomalies, likely reflects the fact that simple texture overlay strategies cannot adequately simulate complex pathological atypia.
Regarding specificity, RareCode achieves 58.24 ± 5.99%, outperforming all comparison methods in reducing false positive rates. This represents approximately a 25-percentage-point improvement over the reconstruction-only baseline (NoCAR, 33.76%), demonstrating the CAR mechanism's contribution to reducing false positives. The lower specificity of STFPM and PatchCore, which rely natural-image-pretrained features, may partially reflect the domain gap between natural and histopathological images. Notably, STFPM and DRAEM exhibit high specificity variance (±33.53% and ±7.09%), with per-fold specificity ranging from near-zero to moderate levels, raising concerns about their deployment reliability.
Per-class detection performance
Per-class analysis was conducted by separately comparing cancer and inflammation samples against normal samples (Table 2). RareCode achieved higher performance for cancer detection (AUC = 99.44 ± 0.12%, recall = 98.13 ± 0.29%, specificity = 94.21 ± 2.22%) than for inflammation detection (AUC = 94.30 ± 0.44%, recall = 96.55 ± 0.78%, specificity = 60.44 ± 4.34%). These findings suggest that RareCode may show stronger discrimination for malignant abnormalities than for inflammatory changes, whereas the inflammation-normal boundary appears to contribute substantially to the reduced overall specificity.
Ablation study
To investigate the contributions of key components within the RareCode framework, ablation experiments were conducted to assess the impact of the CAR mechanism and the MHC module on detection performance. Results are detailed in Table 3. As shown in Figure 6A, adding CAR to the reconstruction-only baseline improved AUC from 92.81% to 95.92%, and multi-scale codebook fusion further increased AUC to 96.82%. Figure 6B shows that CAR also improved specificity, increasing it from 33.76% in the NoCAR baseline to 58.24% in the full FourScales model. These results support the complementary value of codebook activation rarity and multi-scale fusion.
Additionally, a decoder-complexity ablation was conducted using the FourScales configuration. As shown in Table 3, the complex-decoder variant with multi-scale depthwise convolution blocks and Convolutional Block Attention Modules (CBAM) showed lower AUC than the basic FourScales model (95.17 ± 0.44% vs. 96.82 ± 0.23%). This result suggests that, within the present VQ-AE-based RareCode setting, increasing decoder capacity did not improve anomaly detection performance and may reduce the effectiveness of the codebook-constrained representation.
Hierarchical spatial response analysis
To examine the spatial responses generated by RareCode, patch-level reconstruction error and codebook rarity maps were aggregated at the image level and compared between normal and anomalous samples. Energy ratio, Cohen's d, and AUC were used to quantify image-level response separation. Detailed results are presented in Table 4 and Figure 7 and Figure 8.
Results show that codebook rarity scores at all scales exhibit response elevation on anomalous samples (energy ratios > 1). Smaller-capacity codebooks (Codebook 64) achieve stronger localization-level discrimination (78.79% AUC), consistent with the expectation that higher compression rates encourage learning of more abstract prototypical patterns that are more sensitive to deviations from normal tissue archetypes. Reconstruction error alone provides substantial anomaly capture capability (93.31% AUC), while CAR scores offer complementary signals from the semantic frequency dimension.
Qualitative examination of Figure 7 showed that elevated responses in cancer samples overlapped with irregular and crowded glands, nuclear enlargement, hyperchromasia, pseudostratification, and loss of epithelial polarity. In inflammatory samples, stronger responses were observed around distorted crypts and dense inflammatory-cell infiltrates. Lower-capacity codebooks tended to capture broader architectural deviations, whereas higher-capacity codebooks produced more localized cellular-level responses. These findings provide qualitative morphological interpretation but not pixel-level validation.
Fusion parameter analysis
The fusion weight α balances the contributions of spatial reconstruction error and the CAR score to the final anomaly score. Optimal α values for each fold were determined via a grid search (step size 0.05) on the validation sets, with the results presented in Table 5 and Figure 9. Optimal α values primarily concentrate in the 0.85-0.95 range, with a mean of 0.90 ± 0.05. Under optimal configurations, the model achieves an average AUC of 96.82 ± 0.23% on test sets. Higher optimal weights (approximately 0.90) suggest that CAR scores contribute more to final detection than reconstruction error, while reconstruction error provides auxiliary local constraints. Compared with the α = 0 setting in the sensitivity analysis (AUC = 93.29%), the validation-selected fusion setting improved AUC by approximately 3.53 percentage points.
To summarize the present work presents the RareCode framework for unsupervised anomaly detection in histopathological images, aiming to mitigate the identity-mapping problem encountered by traditional generative models. The CAR mechanism reduces over-reliance on pixel-level reconstruction errors, while the MHC module provides hierarchical feature representations at multiple granularities, enabling complementary anomaly discrimination at different levels of abstraction. Experiments on the CRC dataset demonstrate that RareCode achieves 96.82% AUC, with per-class analysis showing effective cancer detection (AUC = 99.44%) and stronger discrimination for cancer than inflammation, suggesting that inflammation-normal overlap remains a major challenge. Ablation studies confirm that integrating discrete semantic features from VQ with multi-scale tissue morphological representations improves detection performance. RareCode's high recall (98.40%) and moderate specificity (58.24%) suggest its potential as a pre-screening tool for prioritizing suspicious histopathological images; however, its actual effect on pathologist workload will require prospective workflow evaluation.
Data Availability:
The CRC histopathological image dataset used in this study was obtained from Shenzhen People's Hospital under institutional ethics approval (Approval No. LL-KY-2025300-01). Due to patient privacy and institutional data sharing policies, the dataset is not publicly available. Access may be granted upon reasonable request to the corresponding author, subject to institutional approval and data use agreements. The source code for the RareCode framework is publicly available at https://github.com/XL-alg/RareCode.
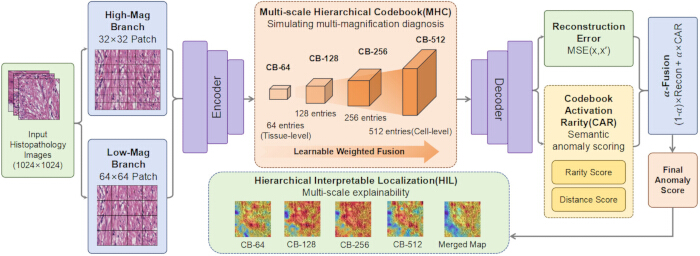
Figure 1: Overall architecture and data flow of the RareCode framework. A 512 × 512 H&E-stained histopathological image is divided into non-overlapping 32 × 32 and 64 × 64 patches as fine- and coarse-scale inputs. The two branches encode patches into latent embeddings, apply Multi-scale Hierarchical Codebook (MHC) discretization, and reconstruct patches to compute reconstruction-error scores. In parallel, the Codebook Activation Rarity (CAR) mechanism estimates semantic rarity from codebook activation-frequency profiles learned from normal training samples. Normalized reconstruction and CAR scores are then fused to generate the final image-level anomaly score, while patch-level responses are projected back to the image plane for hierarchical localization. Please click here to view a larger version of this figure.
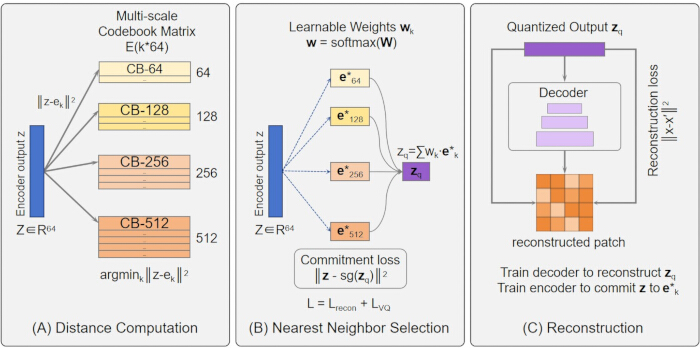
Figure 2: Multi-scale vector quantization mechanism. (A) Distance computation between encoder output features and codebook embedding vectors. (B) Nearest neighbor selection and weighted fusion across codebooks with capacities of 64, 128, 256, and 512. (C) Reconstruction from quantized features via transposed convolutional decoder. Please click here to view a larger version of this figure.
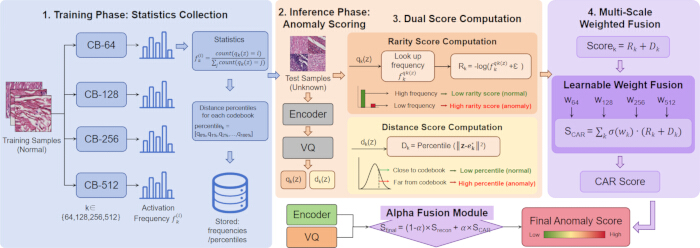
Figure 3: CAR scoring mechanism. This figure illustrates four stages: Stage 1: activation frequency statistics are computed solely on normal training samples. Stage 2: test samples obtain activation indices and distances through encoder and vector quantization. Stage 3: rarity scores and distance scores are computed based on training-set frequency profiles. Stage 4: scores from each codebook scale are fused through learnable weights to produce the final CAR score. Please click here to view a larger version of this figure.
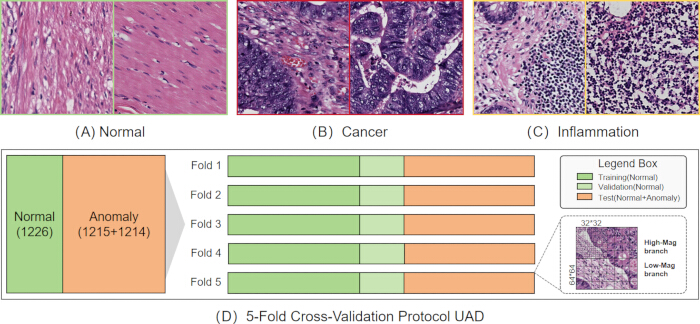
Figure 4: CRC dataset composition and experimental protocol. (A–C) Representative H&E-stained histopathological images of normal colorectal tissue, colorectal cancer, and colorectal inflammation. (D) 5-fold cross-validation protocol for UAD, in which normal samples were used for training and validation, while held-out normal and anomalous samples were used for testing. Images were digitized at 40x magnification and processed into 32 x 32 and 64 x 64 patches. Green, light green, and orange indicate training, validation, and test sets, respectively. Please click here to view a larger version of this figure.
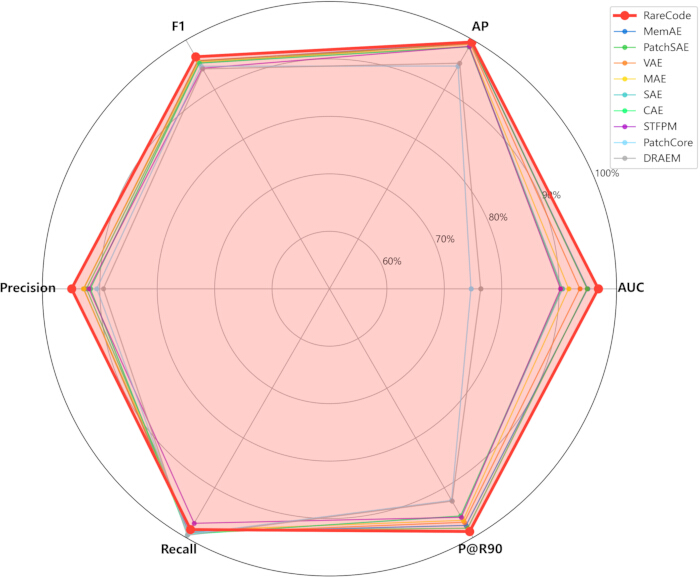
Figure 5: Multi-metric comparison radar chart of anomaly detection methods. Radar chart comparing RareCode against baseline methods across AUC, average precision (AP), F1-score, precision, recall, and precision at 90% recall (P@R90). All values represent mean performance across 5-fold cross-validation. Please click here to view a larger version of this figure.
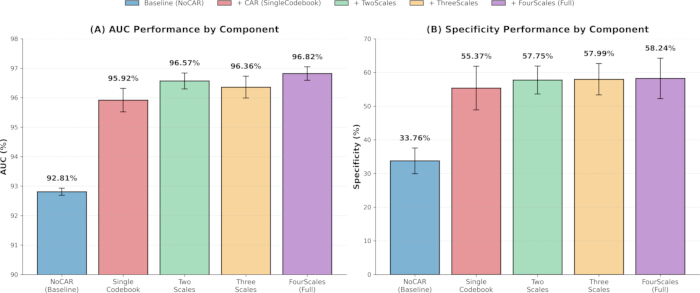
Figure 6: Incremental contribution analysis of ablation study components. (A) AUC performance comparison showing the progressive improvement from reconstruction-only baseline (NoCAR) through single-codebook to multi-scale configurations. (B) Specificity performance comparison demonstrating the CAR mechanism's effect on false positive reduction. All error bars represent standard deviation (SD) across 5-fold cross-validation. Please click here to view a larger version of this figure.
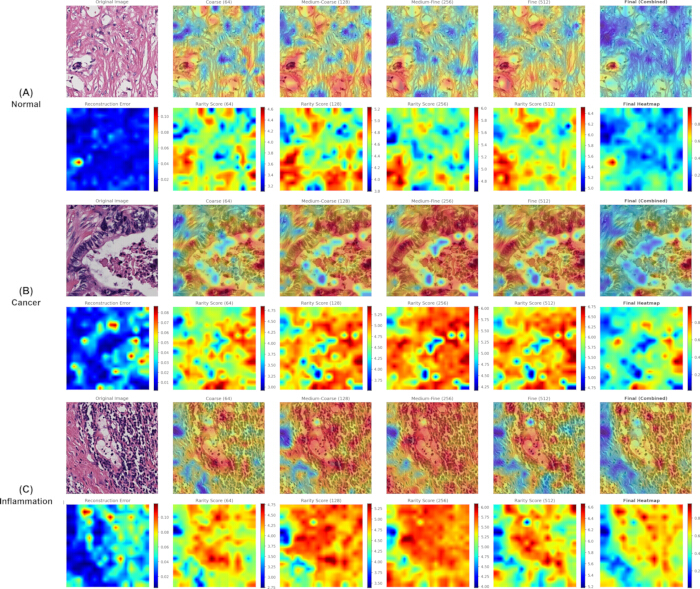
Figure 7: Multi-scale codebook hierarchical localization heatmaps. Representative examples are shown for (A) normal, (B) cancer, and (C) inflammation samples. Each row includes the original image, overlay, reconstruction-error map, rarity-score maps from codebooks of different capacities (64, 128, 256, and 512), and the final fused localization map. Smaller-capacity codebooks highlight coarse-grained patterns through stronger compression abstraction, whereas larger-capacity codebooks preserve finer structural details. High-response regions qualitatively correspond to cancer- or inflammation-related histopathological features, but were not validated with pixel-level expert annotations. Please click here to view a larger version of this figure.
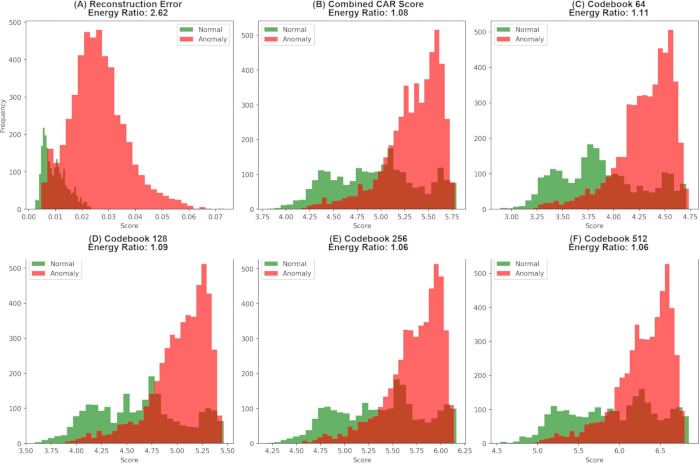
Figure 8: Distribution histograms of different score types. Histograms compare score distributions between normal and anomalous samples for (A) reconstruction error, (B) combined CAR score, (C) Codebook 64, (D) Codebook 128, (E) Codebook 256, and (F) Codebook 512. Green and red histograms indicate normal and anomalous samples, respectively. Please click here to view a larger version of this figure.
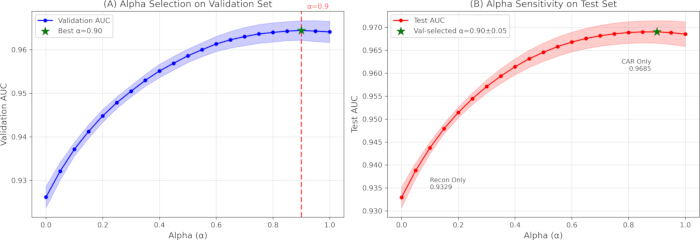
Figure 9: Alpha parameter sensitivity analysis. (A) Validation-set AUC used for α selection. (B) Test-set AUC under different α values. The validation-selected α values ranged from 0.85 to 0.95, with a mean of 0.90 ± 0.05, consistent with Table 5. AUC variation remained below 0.5% when α varied within the [0.70, 1.00] range, indicating stable performance across a wide parameter range. Please click here to view a larger version of this figure.
| Method | AUC (%) | AP (%) | F1 (%) | Precision (%) | Recall (%) | Specificity (%) | P@R90 (%) |
| CAE | 90.37 ± 0.94 | 98.62 ± 0.18 | 95.34 ± 0.15 | 91.64 ± 0.40 | 99.35 ± 0.22 | 28.14 ± 3.88 | 95.66 ± 0.32 |
| SAE | 90.58 ± 0.94 | 98.66 ± 0.18 | 95.34 ± 0.15 | 91.67 ± 0.40 | 99.32 ± 0.24 | 28.46 ± 3.97 | 95.71 ± 0.30 |
| VAE | 93.60 ± 0.82 | 99.13 ± 0.12 | 95.86 ± 0.19 | 92.81 ± 0.49 | 99.12 ± 0.29 | 39.07 ± 4.70 | 96.94 ± 0.43 |
| MAE | 91.65 ± 2.75 | 98.76 ± 0.50 | 95.61 ± 0.60 | 92.87 ± 1.56 | 98.55 ± 0.55 | 39.74 ± 14.32 | 96.55 ± 0.97 |
| MemAE | 94.97 ± 0.81 | 99.35 ± 0.11 | 95.78 ± 0.33 | 92.82 ± 1.07 | 98.95 ± 0.60 | 39.15 ± 9.99 | 97.57 ± 0.33 |
| PatchSAE | 94.86 ± 0.36 | 99.34 ± 0.05 | 95.39 ± 0.13 | 92.32 ± 0.27 | 98.67 ± 0.12 | 34.91 ± 2.57 | 98.13 ± 0.24 |
| STFPM | 90.23 ± 3.05 | 98.70 ± 0.44 | 94.32 ± 0.21 | 91.90 ± 3.51 | 97.14 ± 3.38 | 29.82 ± 33.53 | 95.93 ± 1.96 |
| DRAEM | 76.34 ± 2.82 | 95.34 ± 0.90 | 94.19 ± 0.07 | 89.39 ± 0.65 | 99.56 ± 0.65 | 6.19 ± 7.09 | 92.69 ± 0.57 |
| PatchCore | 74.64 ± 1.82 | 94.76 ± 0.55 | 94.73 ± 0.05 | 90.52 ± 0.15 | 99.36 ± 0.12 | 17.49 ± 1.54 | 92.54 ± 0.15 |
| RareCode | 96.82 ± 0.23 | 99.59 ± 0.03 | 96.63 ± 0.15 | 94.93 ± 0.67 | 98.40 ± 0.48 | 58.24 ± 5.99 | 98.80 ± 0.10 |
Table 1: Comparison results with baseline methods (5-fold cross-validation). Detection performance of RareCode and nine baseline UAD methods on the CRC dataset. Metrics include AUC, average precision (AP), recall, specificity, F1-score, precision at 90% recall (P@R90), and precision. All values represent mean ± SD across 5-fold cross-validation. Bold values indicate the best performance for each metric.
| Category | AUC (%) | AP (%) | F1 (%) | Recall (%) | Specificity (%) |
| Cancer | 99.44 ± 0.12 | 99.86 ± 0.03 | 98.34 ± 0.17 | 98.13 ± 0.29 | 94.21 ± 2.22 |
| Inflammation | 94.30 ± 0.44 | 98.48 ± 0.12 | 93.44 ± 0.29 | 96.55 ± 0.78 | 60.44 ± 4.34 |
Table 2: Per-class detection performance across anomaly subtypes. Separate evaluation of RareCode's detection performance for cancer and inflammation samples against normal samples. Per-class metrics, including AUC, AP, F1-score, recall, and specificity, were computed using class-specific optimal thresholds.
| Variant | Codebook Config | CAR | AUC (%) | AP (%) | F1 (%) | Specificity (%) | P@R90 (%) |
| NoCAR |  | | 92.81 ± 0.12 | 99.05 ± 0.02 | 95.30 ± 0.08 | 33.76 ± 3.82 | 96.72 ± 0.12 |
| SingleCodebook | [256] |  | 95.92 ± 0.40 | 99.47 ± 0.05 | 96.25 ± 0.14 | 55.37 ± 6.51 | 98.31 ± 0.43 |
| TwoScales | [128, 512] | | 96.57 ± 0.27 | 99.56 ± 0.04 | 96.45 ± 0.12 | 57.75 ± 4.14 | 98.75 ± 0.12 |
| ThreeScales | [128, 256, 512] | | 96.36 ± 0.37 | 99.53 ± 0.05 | 96.52 ± 0.17 | 57.99 ± 4.65 | 98.60 ± 0.23 |
| FourScales | [64, 128, 256, 512] | | 96.82 ± 0.23 | 99.59 ± 0.03 | 96.63 ± 0.15 | 58.24 ± 5.99 | 98.80 ± 0.10 |
| FourScales + complex decoder | [64, 128, 256, 512] | | 95.17 ± 0.44 | 99.39 ± 0.06 | 95.32 ± 0.20 | 53.83 ± 21.45 | 98.40 ± 0.37 |
Table 3: Ablation study results. Performance comparison of RareCode configurations with progressive addition of components: reconstruction-only baseline (NoCAR), single-codebook CAR (SingleCodebook), and multi-scale configurations (TwoScales, ThreeScales, FourScales). An additional decoder-complexity ablation using the FourScales configuration is also included. Metrics include AUC, average precision (AP), F1-score, specificity, and precision at 90% recall (P@R90).
| Score Type | Energy Ratio | Cohen's d | AUC (%) |
| Reconstruction Error | 2.623 | 2.006 | 93.31 |
| Combined CAR | 1.078 | 1.002 | 74.85 |
| Codebook 64 | 1.109 | 1.207 | 78.79 |
| Codebook 128 | 1.085 | 1.067 | 76.19 |
| Codebook 256 | 1.065 | 0.916 | 72.80 |
| Codebook 512 | 1.064 | 0.833 | 70.38 |
Table 4: Image-level analysis of localization-derived responses. Image-averaged reconstruction error and codebook rarity responses were compared between normal and anomalous samples using the energy ratio, Cohen's d, and AUC.
| Fold | Optimal α | Val AUC (%) | Test AUC (%) |
| 1 | 0.95 | 96.22 | 96.91 |
| 2 | 0.9 | 96.38 | 96.39 |
| 3 | 0.85 | 96.71 | 96.82 |
| 4 | 0.85 | 96.22 | 96.93 |
| 5 | 0.95 | 96.72 | 97.05 |
| Mean | 0.90 ± 0.05 | 96.45 ± 0.23 | 96.82 ± 0.23 |
Table 5: Optimal alpha values across folds. Optimal fusion weight alpha determined via grid search (step size 0.05) on validation sets for each cross-validation fold, with mean and SD statistics.
Discussion
Les résultats suggèrent que les motifs d'activation des codebooks pourraient fournir des informations complémentaires aux erreurs de reconstruction spatiale. L'amélioration observée entre NoCAR et le modèle complet FourScales soutient la contribution potentielle du score CAR, tandis que les poids de fusion sélectionnés indiquent que la rareté sémantique pourrait jouer un rôle important dans le score d'anomalie final. Une explication possible est que les anomalies liées au CCR peuvent s'étendre sur différentes échelles morphologiques, allant de l'atypie nucléaire à la perturbation architecturale des glandes, et pourraient donc bénéficier de représentations de caractéristiques à plusieurs niveaux de granularité14. Le modèle actuel capture différentes étendues spatiales à l'aide de fragments de 32 × 32 et 64 × 64 à un même niveau de grossissement ; une intégration future avec des cadres de traitement d'images de coupe entière (WSI) pourrait davantage favoriser une analyse hiérarchique au niveau des lames39.
Sur le plan clinique, RareCode pourrait être considéré avant tout comme un outil de tri préalable plutôt qu’un système diagnostique autonome. Son rappel élevé (98,40 %) indique un risque relativement faible de manquer des cas atypiques40, tandis que sa spécificité modérée (58,24 %) reflète probablement la difficulté de distinguer les modifications inflammatoires du tissu normal dans un contexte non supervisé. La spécificité plus élevée spécifique au cancer (94,21 %) suggère en outre que les fausses alertes pourraient être moins fréquentes pour le sous-type cliniquement le plus critique. Ces caractéristiques de performance soutiennent l’utilisation potentielle de RareCode comme outil de présélection permettant de prioriser les cas nécessitant une évaluation spécialisée et d’optimiser l’analyse anatomopathologique5,6.
Les résultats par classe peuvent davantage étayer le rôle potentiel de RareCode dans le triage. La performance relativement supérieure pour le cancer par rapport à l'inflammation pourrait refléter les écarts architecturaux et cytologiques plus marqués souvent observés dans les tissus malins, notamment la perte de polarité, le polymorphisme nucléaire et la desmoplasie stromale14,39. En revanche, les modifications inflammatoires peuvent présenter davantage de similitudes avec les variations bénignes du tissu, ce qui pourrait expliquer en partie la spécificité moindre spécifique à l'inflammation. Par conséquent, la spécificité globale doit être interprétée avec prudence, la détection du cancer constituant un cas d'usage cliniquement important plutôt qu'un diagnostic autonome définitif.
Les modes potentiels d'échec de RareCode doivent être interprétés dans le contexte de son objectif d'apprentissage monocatégoriel. Étant donné que le modèle apprend les motifs de tissu normal plutôt que des catégories spécifiques à une maladie, des modifications non néoplasiques telles que l'épithélium régénératif, la fibrose, la nécrose ou une inflammation marquée peuvent également obtenir des scores d'anomalie élevés. Inversement, une dysplasie discrète ou un carcinome bien différencié présentant une architecture glandulaire quasi normale peut produire des réponses plus faibles. Des facteurs techniques, tels que les variations de coloration, les plis du tissu, les artéfacts de sectionnement, le flou ou la compression d'image, peuvent également influencer les erreurs de reconstruction et les fréquences d'activation du carnet de codes. Ces considérations suggèrent que la traduction clinique nécessiterait un contrôle de la qualité des images, une harmonisation des colorations, un étalonnage tenant compte du scanner utilisé et une validation multicentrique39,41.
Portée des comparaisons de base. L'évaluation expérimentale de cette étude se concentre sur des méthodes fonctionnant selon des hypothèses comparables en matière de données et de calcul — plus précisément, des méthodes pouvant être entraînées de bout en bout en utilisant uniquement de petits échantillons normaux non étiquetés, sans nécessiter de corpus externes de pré-entraînement. Cette portée englobe les principaux paradigmes de détection non supervisée d'anomalies : basés sur la reconstruction (CAE, VAE, SAE, MAE, PatchSAE), augmentés par mémoire (MemAE), par distillation de connaissances (STFPM), par augmentation synthétique (DRAEM) et par appariement de caractéristiques pré-entraînées (PatchCore). Nous reconnaissons que deux catégories de méthodes n'ont pas été incluses comme références directes. Premièrement, les modèles fondamentaux spécifiques à la pathologie (UNI, CONCH, CTransPath) tirent parti d'un pré-entraînement sur des millions d'images de pathologie soigneusement sélectionnées, et leurs avantages en termes de performance sont principalement attribuables à l'ampleur et à la diversité des données de pré-entraînement, plutôt qu'au mécanisme de détection d'anomalies ; une comparaison directe confondrait ainsi l'apport des données de pré-entraînement avec celui de la méthodologie de détection. La performance sous-optimale de STFPM et de PatchCore — tous deux utilisant des squelettes pré-entraînés sur ImageNet — illustre empiriquement l'impact du fossé de domaine lorsque des caractéristiques pré-entraînées à usage général sont appliquées à des scénarios histopathologiques, suggérant que le pré-entraînement spécifique à la pathologie pourrait combler cet écart. Deuxièmement, les méthodes de détection d'anomalies basées sur la diffusion, bien qu'encourageantes, entraînent un coût computationnel nettement plus élevé lors de l'inférence (nécessitant typiquement des centaines d'étapes itératives de débruitage), ce qui limite leur applicabilité dans les flux de travail de dépistage clinique à haut débit, où l'efficacité de traitement constitue une exigence pratique. De futures recherches examineront si l'intégration d'encodeurs pré-entraînés spécifiques à la pathologie dans l'architecture RareCode — en remplacement de l'encodeur actuellement entraîné de bout en bout — pourrait améliorer davantage la performance de détection tout en conservant les avantages d'interprétabilité du mécanisme CAR.
Plusieurs limites doivent être reconnues. Premièrement, la validation s'est limitée à un ensemble de données de CCR monocentrique, et une évaluation multicentrique supplémentaire entre différents établissements, scanners et protocoles de coloration est nécessaire. Deuxièmement, bien que la spécificité spécifique au cancer soit encourageante, la spécificité globale restait affectée par la limite entre inflammation et tissu normal. Troisièmement, des annotations expertes au niveau des pixels n'étaient pas disponibles ; par conséquent, le score de Dice et l'indice de Jaccard (IoU) n'ont pas pu être calculés, et l'évaluation de la localisation s'est limitée à une visualisation qualitative et à une analyse au niveau des images des réponses spatiales agrégées. Quatrièmement, des études formelles avec lecteurs sont encore nécessaires pour déterminer si les cartes de chaleur hiérarchiques peuvent améliorer la précision diagnostique ou l'efficacité de l'analyse. Enfin, RareCode effectue actuellement une analyse au niveau des fragments et des images, et le déploiement au niveau des images numérisées en entier (WSI) nécessiterait une intégration avec des cadres de traitement supplémentaires39,41,42.
Les travaux futurs devraient évaluer RareCode sur des référentiels publics et des cohortes multicentriques après son intégration à des cadres de traitement de l'analyse de coupes entières (WSI). Des études prospectives auprès de lecteurs pourraient aider à évaluer son impact potentiel sur la précision diagnostique, le temps d'analyse et l'accord inter-observateurs42. D'autres axes de recherche incluent l'amélioration de l'efficacité computationnelle, l'extension du modèle vers une sous-typologie multiclasse des anomalies et l'intégration de l'apprentissage multi-instance pour le diagnostic au niveau de la lame28,39.
Déclarations de divulgation
Les auteurs déclarent ne pas avoir d'intérêts financiers concurrents connus ni de relations personnelles pouvant avoir influencé, ou semblé influencer, le travail rapporté dans cet article. Pendant la préparation de ce travail, nous avons utilisé ChatGPT pour améliorer la langue et la lisibilité du manuscrit, ainsi que pour aider à générer le code de visualisation des données. Après avoir utilisé cet outil, nous avons relu et modifié le contenu selon les besoins, et assumons l'entière responsabilité de l'article publié.
Remerciements
Cette recherche a été soutenue par la station de travail de l'académicien Yong Dai (technologie de diagnostic des maladies auto-immunes) (science et technologie de Wan Ke [2023] n° 317), le projet du fonds d'innovation des étudiants diplômés du centre national de recherche de Hefei pour la santé et le centre de recherche conjoint en médecine du travail et santé (fonds ouvert n° OMH-2023-04), ainsi que le projet de recherche clinique et translationnelle de la province d'Anhui (n° 202427610020132).
Matériaux
| Nom | Entreprise | Numéro de catalogue | Commentaires |
|---|---|---|---|
| GeForce RTX 4060 Ti GPU | NVIDIA | N/A | 16 Go de mémoire vidéo ; une seule GPU utilisée pour toutes les expériences (RRID:SCR_022858) |
| Matplotlib | Matplotlib Development Team | Version 3.8.4 | Visualisation des données et génération de figures (RRID:SCR_008624) |
| NumPy | NumPy Developers | Version 1.26.4 | Calcul numérique et opérations sur les tableaux (RRID:SCR_008633) |
| pandas | pandas Development Team | Version 2.2.3 | Organisation des données et traitement des résultats sous forme tabulaire (RRID:SCR_018214) |
| Pillow | Python Imaging Library / Pillow Contributors | Version 10.3.0 | Chargement et prétraitement des images |
| Python | Python Software Foundation | Version 3.12.3 | Langage de programmation utilisé pour le développement du modèle et l'analyse des données (RRID:SCR_008394) |
| PyTorch | Meta Platforms, Inc. | Version 2.7.0+cu118 | Infrastructure d'apprentissage profond utilisée pour l'implémentation et l'entraînement du modèle (RRID:SCR_018536) |
| scikit-learn | scikit-learn Developers | Version 1.4.2 | Validation croisée, division entre ensembles d'apprentissage et de test, et métriques d'évaluation (RRID:SCR_002577) |
| SciPy | SciPy Developers | Version 1.13.1 | Analyse statistique (RRID:SCR_008058) |
| torchvision | PyTorch Project | Version 0.22.0+cu118 | Prétraitement des images et transformation des données |
| tqdm | tqdm Developers | Version 4.66.4 | Surveillance de la progression de l'entraînement et de l'évaluation |
Références
- Fan J, Sun Q, Di Y, et al. DIPathMamba: A domain-incremental weakly supervised state space model for pathology image segmentation. Med Image Anal. 2025;103:103563.
- Nan T, Zheng S, Qiao S, et al. Deep learning quantifies pathologists' visual patterns for whole slide image diagnosis. Nat Commun. 2025;16(1):5493.
- Lagogiannis I, Meissen F, Kaissis G, et al. Unsupervised pathology detection: a deep dive into the state of the art. IEEE Trans Med Imaging. 2024;43(1):241-252.
- Tian Y, Liu F, Pang G, et al. Self-supervised pseudo multiclass pre-training for unsupervised anomaly detection and segmentation in medical images. Med Image Anal. 2023;90:102930.
- Metter DM, Colgan TJ, Leung ST, et al. Trends in the US and Canadian pathologist workforces from 2007 to 2017. JAMA Netw Open. 2019;2(5):e194337.
- Shaukat A, Levin TR. Current and future colorectal cancer screening strategies. Nat Rev Gastroenterol Hepatol. 2022;19(8):521-531.
- Ancker JS, Edwards A, Nosal S, et al. Effects of workload, work complexity, and repeated alerts on alert fatigue in a clinical decision support system. BMC Med Inform Decis Mak. 2017;17(1):36.
- Litjens G, Kooi T, Ehteshami Bejnordi B, et al. A survey on deep learning in medical image analysis. Med Image Anal. 2017;42:60-88.
- Stepec D, Skocaj D. Unsupervised detection of cancerous regions in histology imagery using image-to-image translation. In: Proceedings of the IEEE/CVF Conference on Computer Vision and Pattern Recognition Workshops. 2021:3785-3792.
- Li Y, Lao Q, Kang Q, et al. Self-supervised anomaly detection, staging and segmentation for retinal images. Med Image Anal. 2023;87:102805.
- Hinton GE, Salakhutdinov RR. Reducing the dimensionality of data with neural networks. Science. 2006;313(5786):504-507.
- Kingma DP, Welling M. Auto-encoding variational Bayes. In: Proceedings of the 2nd International Conference on Learning Representations (ICLR). 2014.
- Goodfellow IJ, Pouget-Abadie J, Mirza M, et al. Generative adversarial nets. In: Advances in Neural Information Processing Systems. 2014;27:2672-2680.
- Lu S, Zhang W, Zhao H, et al. Anomaly detection for medical images using heterogeneous auto-encoder. IEEE Trans Image Process. 2024;33:2770-2782.
- Yang Z, Zhang T, Soltani Bozchalooi I, et al. Memory-augmented generative adversarial networks for anomaly detection. IEEE Trans Neural Netw Learn Syst. 2022;33(6):2324-2334.
- Huyan N, Quan D, Zhang X, et al. Unsupervised outlier detection using memory and contrastive learning. IEEE Trans Image Process. 2022;31:6440-6454.
- Jézéquel L, Beaudet J, Histace A, et al. Unified anomaly detection via multi-scale contrasted memory. IEEE Trans Image Process. 2026;35:2802-2815.
- Roth K, Pemula L, Zepeda J, et al. Towards total recall in industrial anomaly detection. In: Proceedings of the IEEE/CVF Conference on Computer Vision and Pattern Recognition. 2022:14298-14308.
- Defard T, Setkov A, Loesch A, et al. PaDiM: a patch distribution modeling framework for anomaly detection and localization. In: International Conference on Pattern Recognition. Cham: Springer; 2021:475-489.
- Zingman I, Stierstorfer B, Lempp C, et al. Learning image representations for anomaly detection: application to discovery of histological alterations in drug development. Med Image Anal. 2024;92:103067.
- Jiang Y, Cao Y, Shen W. Prototypical learning guided context-aware segmentation network for few-shot anomaly detection. IEEE Trans Neural Netw Learn Syst. 2025;36(7):12016-12026.
- Wang X, Zhao J, Marostica E, et al. A pathology foundation model for cancer diagnosis and prognosis prediction. Nature. 2024;634(8035):970-978.
- Frotscher A, Kapoor J, Wolfers T, et al. Unsupervised anomaly detection in medical imaging using aggregated normative diffusion. Med Image Anal. 2026;109:103895.
- Zeng GQ, Yang YW, Lu KD, et al. Evolutionary adversarial autoencoder for unsupervised anomaly detection of industrial Internet of Things. IEEE Trans Reliab. 2025;74(3):3454-3468.
- Lu KD, Zhang BX, Xu Y, et al. MoARNN-AM: multi-objective automated recurrent neural network with attention mechanism for cyber-attack detection of UAV. IEEE Trans Consum Electron. 2026;72(1):1738-1749.
- van den Oord A, Vinyals O, Kavukcuoglu K. Neural discrete representation learning. In: Advances in Neural Information Processing Systems. 2017;30:6306-6315.
- Ghafourian A, Shui H, Upadhyay D, et al. Targeted collapse regularized autoencoder for anomaly detection: black hole at the center. IEEE Trans Neural Netw Learn Syst. 2025;36(6):10348-10358.
- Gao Z, Mao A, Dong Y, et al. SMMILe enables accurate spatial quantification in digital pathology using multiple-instance learning. Nat Cancer. 2025;6(12):2025-2041.
- Wang X, Liu H, Zhang Y, et al. Joint modeling histology and molecular markers for cancer classification. Med Image Anal. 2025;102:103505.
- Jin H, Shen J, Cui L, et al. Dynamic graph based weakly supervised deep hashing for whole slide image classification and retrieval. Med Image Anal. 2025;101:103468.
- Schmitz R, Madesta F, Nielsen M, et al. Multi-scale fully convolutional neural networks for histopathology image segmentation: from nuclear aberrations to the global tissue architecture. Med Image Anal. 2021;70:101996.
- Masci J, Meier U, Ciresan D, et al. Stacked convolutional auto-encoders for hierarchical feature extraction. In: International Conference on Artificial Neural Networks. Berlin: Springer; 2011:52-59.
- Ng A. Sparse autoencoder. CS294A Lecture Notes. 2011;72:1-19.
- He K, Chen X, Xie S, et al. Masked autoencoders are scalable vision learners. In: Proceedings of the IEEE/CVF Conference on Computer Vision and Pattern Recognition. 2022:16000-16009.
- Lim H, Choi J, Choo J, et al. Sparse autoencoders reveal selective remapping of visual concepts during adaptation. In: Proceedings of the 13th International Conference on Learning Representations (ICLR). 2025.
- Gong D, Liu L, Le V, et al. Memorizing normality to detect anomaly: memory-augmented deep autoencoder for unsupervised anomaly detection. In: Proceedings of the IEEE/CVF International Conference on Computer Vision. 2019:1705-1714.
- Wang G, Han S, Ding E, et al. Student-teacher feature pyramid matching for anomaly detection. In: Proceedings of the 32nd British Machine Vision Conference (BMVC). 2021.
- Zavrtanik V, Kristan M, Skocaj D. DRAEM: a discriminatively trained reconstruction embedding for surface anomaly detection. In: Proceedings of the IEEE/CVF International Conference on Computer Vision. 2021:8330-8339.
- Niazi MKK, Parwani AV, Gurcan MN. Digital pathology and artificial intelligence. Lancet Oncol. 2019;20(5):e253-e261.
- Raab SS, Grzybicki DM, Janosky JE, et al. Clinical impact and frequency of anatomic pathology errors in cancer diagnoses. Cancer. 2005;104(10):2205-2213.
- Schömig-Markiefka B, Pryalukhin A, Hulla W, et al. Quality control stress test for deep learning-based diagnostic model in digital pathology. Mod Pathol. 2021;34(12):2098-2108.
- Steiner DF, MacDonald R, Liu Y, et al. Impact of deep learning assistance on the histopathologic review of lymph nodes for metastatic breast cancer. Am J Surg Pathol. 2018;42(12):1636-1646.