La plateforme automatisée d'acceptation en basse tension proposée intègre l'Internet des objets (IoT), l'orchestration visuelle de flux de travail, l'informatique en périphérie et le cloud computing, l'ingénierie des caractéristiques et l'apprentissage automatique afin d'automatiser les tests d'acceptation des systèmes basse tension (BT). La plateforme permet une détection intelligente des défauts, une prise de décision en temps réel, une acceptation automatisée, une grande précision, une faible latence opérationnelle et un déploiement évolutif.
Un abonnement JoVE est requis pour visualiser ce contenu. Connectez-vous ou commencez votre période d'essai gratuite.
Article de recherche
Une plateforme d'automatisation de la recette basse tension pilotée par les processus, avec orchestration visuelle du flux de travail et validation par apprentissage automatique
Dans cet article
Résumé
Résumé
The rapid expansion of low-voltage (LV) networks and their integration with distributed energy resources requires intelligent and automated management solutions. Cloud-edge collaborative Internet of Things (IoT) platforms support real-time monitoring, control, and data acquisition. However, existing platforms generally lack workflow automation, visual process orchestration, user-guided decision support, and comprehensive validation. Consequently, they do not provide process-driven solutions for automated LV network acceptance testing. This study presents the design and evaluation of a Low-Voltage Acceptance Automation Platform based on a visualized process canvas. The proposed platform adopts a process-driven architecture in which acceptance workflows are visually created, managed, and executed. The visual process canvas transforms conventional static monitoring into dynamic workflow automation by enabling real-time workflow execution, validation, and decision-making. The framework incorporates the Open LV Network & Smart Meter dataset to support realistic modeling of electrical load behavior. The workflow includes IoT-based data acquisition, data preprocessing, feature engineering, workflow orchestration using the visual process canvas, machine learning-based validation, and real-time dashboard visualization. The proposed framework achieved a fault detection rate of 98.4%, a receiver operating characteristic area under the curve (ROC-AUC) of 0.968, and an operational decision latency of 31 ms, outperforming traditional cloud-centric and IoT-based baseline approaches by approximately 30%–40%.
Introduction
L'industrie 4.0 (I4.0)1 repose sur plusieurs technologies émergentes, parmi lesquelles l'Internet industriel des objets (IIoT) est l'une des plus importantes. L'IIoT désigne l'application des technologies de l'Internet des objets (IoT) dans les environnements industriels, où des dispositifs et machines interconnectés communiquent principalement par des interactions machine-à-machine. Étant donné que les défaillances des systèmes industriels peuvent entraîner des pertes opérationnelles importantes, les applications de l'IIoT exigent une communication hautement fiable tout en générant des volumes de données nettement plus importants que les systèmes IoT conventionnels2. En outre, certaines études considèrent l'IIoT comme un concept étroitement lié à l'industrie 4.03. Les technologies IoT transforment les architectures hiérarchiques traditionnelles en permettant des systèmes plus flexibles assurant un échange de données fluide4. De nombreuses études récentes ont passé en revue les architectures IIoT existantes et proposé de nouvelles conceptions de cadres5,6,7,8,9. Malgré ces progrès, deux limitations majeures persistent. Premièrement, de nouveaux cadres sont fréquemment proposés afin de pallier les insuffisances des architectures antérieures, ce qui entraîne un nombre croissant de modèles alternatifs augmentant la diversité architecturale et la complexité de mise en œuvre. Deuxièmement, le haut niveau d'abstraction associé à de nombreuses architectures proposées limite leur adoption pratique dans les environnements industriels10.
Plusieurs architectures de l'IIoT ont été décrites dans la littérature. Une architecture IIoT basée sur la norme Open Platform Communications (OPC) a été présentée conjointement avec un intergiciel Python permettant de gérer la communication OPC11. Une architecture IIoT en sept couches a été proposée dans ; toutefois, les détails de mise en œuvre et les expériences de validation n'ont pas été fournis12. Un cadre intégrant les technologies 5G et l'IIoT a été décrit conjointement avec un cas d'utilisation représentatif, bien que la validation expérimentale ait été limitée13. Un cadre de conception émotionnelle pour l'industrie 4.0 a été introduit, et ses implications potentielles ont été discutées sans vérification expérimentale14. Une plateforme IIoT multicouche a été évaluée dans un banc d'essai réel, en mettant l'accent sur les considérations liées aux télécommunications15. De même, un cadre IoT modulaire pour la surveillance de la qualité de l'air intérieur a été présenté dans et ses performances ont été évaluées à l'aide de données recueillies auprès de 84 ménages avec enfants16.
L'Internet des objets (IoT) est devenu une technologie en évolution rapide, offrant un potentiel considérable pour des applications dans le secteur de l'électricité17,18. L'intégration des technologies IoT dans les nœuds des systèmes électriques permet une production, un transport, une distribution, une exploitation et une utilisation de l'énergie plus intelligentes et plus efficaces, grâce à une prise de décision autonome appuyée par une surveillance en temps réel continue du flux d'électricité au sein du réseau intelligent. Par conséquent, ces nœuds intelligents améliorent la performance opérationnelle globale du réseau électrique19. La technologie de communication constitue un élément fondamental de la mise en œuvre des réseaux intelligents, car deux catégories principales d'informations doivent être transmises de manière fiable : les mesures des capteurs et les signaux de commande. Outre une faible latence de communication, les applications des réseaux intelligents exigent une qualité de service (QoS) appropriée et une sécurité des données adéquate afin d'assurer un fonctionnement fiable20.
Le choix d'une technologie de communication appropriée pour les applications de réseau intelligent nécessite de prendre en compte les intervalles de communication, les débits de transmission de données et les coûts de communication21. Les réseaux de communication IoT comprennent généralement des couches logicielles, de sécurité, de service, système et de connectivité. Au sein de la couche de connectivité, les protocoles de communication sont généralement classés en trois catégories. Les protocoles longue portée incluent la Long Range (LoRa) et le Narrowband-IoT (NB-IoT) ; les protocoles moyenne portée incluent le Wi-Fi, le 4G/LTE et le 5G ; et les protocoles courte portée incluent le Bluetooth et le ZigBee. Avec la déréglementation croissante des marchés de l'électricité, la prévision de la charge est devenue plus importante pour évaluer les effets des conditions météorologiques, des pannes d'équipement, des changements réglementaires et d'autres facteurs opérationnels sur le coût des services électriques. Par conséquent, une prévision précise de la charge résidentielle est devenue essentielle pour le fonctionnement et la supervision des réseaux intelligents, des micro-réseaux et des bâtiments intelligents22.
Le fonctionnement fiable des réseaux basse tension (BT) dépend du maintien d'une qualité élevée de l'énergie électrique23. La qualité de l'énergie est déterminée par l'efficacité de la régulation de tension, de l'équilibrage du courant et de l'atténuation des perturbations techniques en cas de conditions de fonctionnement déséquilibrées24. Parmi ces facteurs, l'équilibrage des phases est particulièrement important car il détermine la répartition uniforme des tensions et des courants entre les phases25. Un mauvais équilibrage des phases peut augmenter le chauffage des conducteurs, les écarts de tension et les courants de neutre, réduisant ainsi l'efficacité du système et sa fiabilité opérationnelle26. Par conséquent, l'équilibrage des phases doit être pris en compte lors de la phase de conception afin d'améliorer les performances du système, sa stabilité opérationnelle et sa fiabilité à long terme. Néanmoins, cet aspect est rarement intégré aux méthodologies conventionnelles de conception de mini-réseaux.
De récents progrès dans les systèmes d'orchestration de flux de travail ont démontré les avantages de l'automatisation pilotée par événements et de la gestion visuelle des processus dans les environnements de l'Internet industriel des objets. Néanmoins, leur application à la validation des réseaux de distribution et aux tests d'acceptation en basse tension reste limitée. La plupart des systèmes d'automatisation en basse tension existants se concentrent principalement sur la surveillance et la commande de supervision, tandis que relativement peu d'études explorent la gestion des acceptations pilotée par flux de travail ou la vérification automatisée de la conformité. De même, bien que les techniques d'apprentissage automatique aient suscité un intérêt considérable pour la détection d'anomalies dans les compteurs intelligents et l'évaluation de la qualité de l'énergie, ces approches sont généralement conçues comme des modèles analytiques indépendants plutôt que comme des composants d'un cadre intégré d'orchestration de flux de travail.
Diverses solutions de compteurs d'énergie intelligents pour la gestion des bâtiments intelligents et l'automatisation domestique ont été proposées ces dernières années27. Un prototype de compteur intelligent a été présenté dans la référence27 afin de démontrer l'intégration de concepts éducatifs de niveau universitaire dans les technologies de comptage intelligent. Le compteur intelligent développé a montré un potentiel significatif pour la gestion et le contrôle de l'énergie, réduisant la consommation d'énergie et profitant à la fois aux fournisseurs et aux consommateurs grâce à une communication IoT bidirectionnelle. Un système de prise intelligente basé sur un microcontrôleur a ensuite été introduit pour soutenir une surveillance intelligente de l'énergie28.
Le système de prise intelligente proposé affiche en temps réel la consommation d'énergie via une interface graphique basée sur Android. En outre, l'appareil peut détecter la présence d'appareils électriques connectés, une fonctionnalité appelée mesure invasive de la charge28. Une prise intelligente commerciale peu coûteuse a été utilisée pour la mise en œuvre. Les améliorations futures incluent la surveillance du courant efficace (RMS), de la puissance active, de la puissance réactive et de l'angle de phase entre la tension et le courant. Comme décrit dans nos études précédentes, une microrégion photovoltaïque partiellement raccordée au réseau utilise les protocoles de communication ZigBee et LoRa pour échanger des informations avec des dispositifs de comptage intelligent, démontrant ainsi la faisabilité d'une communication activée par l'Internet des objets (IoT) pour les systèmes d'énergie distribués29,30.
Pour pallier les limites de la planification conventionnelle des systèmes de distribution, les pratiques d'ingénierie et la recherche scientifique ont progressé selon plusieurs axes complémentaires. Une première direction de recherche s'est concentrée sur la planification stratégique à l'aide de systèmes d'information géographique (SIG) pour la sélection des sites et l'évaluation préliminaire des ressources31,32. Une autre direction a porté sur l'amélioration de composants et de sous-systèmes individuels, notamment le choix des conducteurs, le dimensionnement optimal de la production et du stockage d'énergie, ainsi que des évaluations comparatives des systèmes de distribution en courant alternatif (AC) et en courant continu (DC)33,34,35,36. Une troisième voie de recherche a appliqué des algorithmes d'optimisation à la planification des réseaux de distribution, au tracé des alimentations et à la conception de la topologie du réseau. Parmi les avancées récentes figurent des cadres tels que la plateforme uGrid des chercheurs, qui intègre le positionnement des dispositifs et la configuration du réseau, mais ne dispose pas d'une analyse standard de flux de puissance pour la vérification et l'optimisation. D'autres approches s'appuient sur un réglage manuel des paramètres pour la génération de topologies ou se concentrent sur des applications spécialisées, comme les microréseaux DC à faible puissance37,38,39. Bien que ces approches représentent des progrès significatifs, des travaux supplémentaires sont nécessaires pour établir une méthodologie intégrée permettant une conception complète des systèmes de distribution en basse tension. En outre, les évaluations techno-économiques exhaustives des systèmes monophasés, triphasés et hybrides en basse tension restent limitées.
Les récents progrès réalisés dans le domaine de l'intelligence artificielle (IA) et de l'apprentissage automatique ont encore élargi les capacités des systèmes électriques intelligents. Une revue complète présentée dans a résumé les applications de l'IA et de l'apprentissage automatique dans les réseaux intelligents, incluant des technologies émergentes telles que l'apprentissage fédéré, l'IA générative, les grands modèles linguistiques, l'intelligence artificielle des objets (IAoT) et les jumeaux numériques40. Cette revue a mis en lumière des applications dans la prévision de charge, la maintenance prédictive, la détection d'anomalies, la gestion côté demande et l'intégration des véhicules électriques, tout en soulignant les défis persistants liés à l'interopérabilité, à la confidentialité, à l'évolutivité, à la robustesse et aux considérations éthiques. Une autre revue récente a évalué les méthodes d'IA pour la gestion décentralisée de l'énergie dans les infrastructures IoT-bords-nuage, en se concentrant sur l'apprentissage automatique, l'apprentissage par renforcement et les systèmes multi-agents pour le contrôle décentralisé de l'énergie41.
Dans leur ensemble, les études antérieures ont fait progresser la surveillance activée par l'Internet des objets (IoT), la comptabilité intelligente, l'informatique cloud-edge, l'intelligence artificielle et la gestion intelligente de l'énergie pour les systèmes de distribution basse tension (LV). Toutefois, ces technologies ont été principalement développées indépendamment. L'orchestration des flux de travail, la gestion automatisée des validations, la validation pilotée par processus et l'aide à la décision intégrée restent limitées, ce qui souligne le besoin d'un cadre unifié d'automatisation orienté vers les flux de travail.
En conséquence, cette étude présente une plateforme automatisée d'acceptation basse tension basée sur un canevas de processus visualisé. Le cadre proposé intègre l'acquisition de données fondée sur l'Internet des objets (IoT), le prétraitement des données, l'ingénierie des caractéristiques, l'orchestration des flux de travail, la validation assistée par apprentissage automatique, le calcul nuage-bord (cloud-edge) et la visualisation en temps réel au sein d'une architecture unifiée, afin de soutenir des tests automatisés et fiables d'acceptation des réseaux BT à l'aide de données réelles provenant de compteurs intelligents. Figure 1 présente un aperçu de l'architecture orientée flux de travail de la plateforme proposée. Le flux de travail comprend l'acquisition de données, le prétraitement, l'ingénierie des caractéristiques, l'orchestration des flux de travail, la prise de décision intelligente et l'intégration nuage-bord, permettant ainsi une validation automatisée des réseaux de distribution BT au moyen d'un cadre orienté processus. La plateforme a démontré une grande précision de validation tout en réduisant la latence des décisions opérationnelles et le temps d'exécution du flux de travail par rapport aux approches conventionnelles.
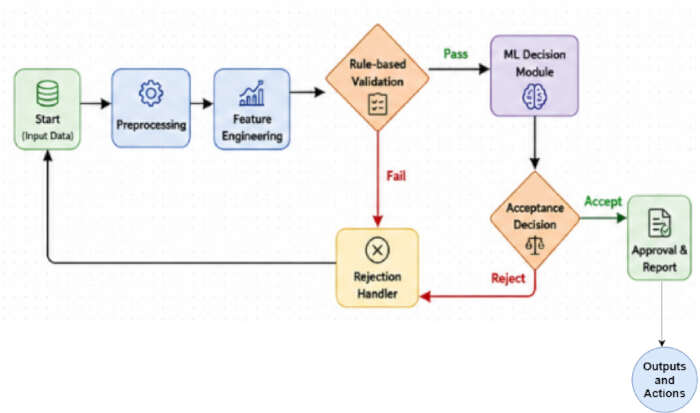
Figure 1. Architecture orientée processus de la plateforme automatisée de réception basse tension proposée. Architecture de haut niveau de la plateforme automatisée de réception basse tension (BT) pilotée par les processus. Le cadre illustre l'intégration séquentielle de l'acquisition de données activée par l'internet des objets (IdO), du prétraitement des données, de l'ingénierie des caractéristiques, de l'orchestration des flux de travail, de la prise de décision intelligente, de la collaboration cloud-edge et de la réception automatisée pour la validation du réseau de distribution basse tension. IdO = Internet des objets ; BT = basse tension ; ML = apprentissage automatique. Veuillez cliquer ici pour afficher une version agrandie de cette figure.
Accès restreint. Veuillez vous connecter ou commencer un essai pour afficher ce contenu.
Protocole
This study did not involve human participants, animals, or identifiable personal data. The analyses were performed using a publicly available dataset (UK Power Networks Open LV Network & Smart Meter dataset) together with synthetically generated data for validation; therefore, ethics committee approval and informed consent were not required. The research tools used in the protocol are listed in the Table of Materials.
1. Data acquisition
The Low-Voltage (LV) Acceptance Automation Platform was developed using electrical measurements acquired from smart meters, IoT sensors, and the Open LV Network & Smart Meter Dataset. Electrical parameters, including voltage, current, active power, reactive power, and energy consumption, were collected through Wi-Fi-, PLC-, and RS-485-based communication protocols. Real-time measurements were used for live system monitoring, whereas historical data supported model development and validation.
The proposed framework used the Open LV Network & Smart Meter Dataset provided by UK Power Networks42. The dataset comprises household smart meter consumption, feeder-level load profiles, and feeder voltage measurements. Time-series subsets containing load consumption and voltage data were selected for model training and evaluation. In addition, a simulated smart meter dataset was generated to represent operational conditions and fault scenarios required for workflow validation and machine learning model evaluation. The simulated dataset included timestamped measurements of voltage, current, active power, reactive power, energy consumption, total harmonic distortion (THD), and voltage imbalance. Fault samples were generated by simulating undervoltage, overvoltage, excessive harmonic distortion, and voltage imbalance based on established low-voltage operational thresholds. The dataset characteristics are summarized in Table 1.
| Attribute | Description |
| Dataset Name | Open LV Network & Smart Meter Dataset |
| Simulated Smart Meter Dataset | Geneated 1000 smaples for Fault simulation and workflow validation |
| Data Type | Time-series (historical smart meter data) |
| Data Granularity | Household-level and feeder-level measurements |
| Key Features | Voltage, current, active power, reactive power, energy consumption, timestamps |
| Data Frequency | High-resolution (e.g., half-hourly / minute-level depending on subset) |
| Coverage | Residential low-voltage distribution networks |
| Usage in Proposed Work | Model training, validation, load behavior analysis, and acceptance workflow evaluation |
Table 1: Dataset description. Summary of the Open LV Network & Smart Meter dataset used for model development and performance evaluation. The table presents the dataset components, measured electrical variables, sampling characteristics, and dataset partitioning for training, validation, and testing.
Because the Open LV Network & Smart Meter Dataset does not contain predefined fault labels, a rule-based labeling strategy was applied to both the real and simulated datasets. Samples satisfying normal operating limits were assigned a label of 0 (Normal), whereas samples exceeding operational thresholds (e.g., voltage deviations greater than ±10% of the nominal voltage, THD > 5%, or voltage unbalance > 2%) were assigned a label of 1 (Fault). These labels served as the ground truth during model training, validation, and testing. The proposed rule engine also allows threshold values to be configured in accordance with regional standards or utility-specific acceptance criteria.
The dataset was partitioned into training (70%), validation (15%), and testing (15%) subsets. Missing values were addressed using linear interpolation, mean imputation, and forward-fill techniques as described in the preprocessing stage. To ensure statistical robustness and reproducibility, all experiments were repeated five times using different random seeds.
2. Data preprocessing
Raw data from the Open LV Network & Smart Meter Dataset and IoT sensor measurements were preprocessed to improve data quality prior to feature extraction and model development. Missing values, noise, and inconsistencies caused by communication interruptions and sensor malfunctions were identified and corrected using interpolation, mean imputation, and forward-fill techniques. The detailed mathematical derivations are provided in Supplementary File 1 (Section S1).
The preprocessed time-series data were segmented into representative operational intervals (S₁–S₅ and Sk). Statistical and electrical features, including average load, peak load, minimum load, standard deviation, voltage deviation, and power consumption, were extracted from each segment. The extracted features are summarized in Table 2 and served as inputs for the subsequent feature engineering stage.
| Segment ID | Mean Load (kW) | Peak Load (kW) | Min Load (kW) | Std Deviation (kW) | Voltage Deviation (p.u.) | Power Consumption (kWh) | Time Interval |
| S₁ | 2.45 | 3.8 | 1.2 | 0.65 | 0.032 | 58.4 | 00:00–01:00 |
| S₂ | 2.9 | 4.1 | 1.5 | 0.72 | 0.028 | 64.2 | 01:00–02:00 |
| S₃ | 3.25 | 4.85 | 1.8 | 0.81 | 0.035 | 71.6 | 02:00–03:00 |
| S₄ | 3.8 | 5.2 | 2.1 | 0.9 | 0.041 | 78.9 | 03:00–04:00 |
| S₅ | 4.1 | 5.75 | 2.4 | 0.95 | 0.045 | 85.3 | 04:00–05:00 |
| Sk | 3.6 | 5.1 | 2 | 0.88 | 0.038 | 76.5 | tk |
Table 2: Representative feature representation extracted from time-series segments. Representative statistical, electrical, load behavior, voltage stability, and power quality features extracted from segmented LV time-series data during feature engineering. The values illustrate the engineered feature representation and are not experimental performance results. LF = Load Factor; PAR = Peak-to-Average Ratio; VSI = Voltage Stability Index; PF = Power Factor; THD = Total Harmonic Distortion.
3. Feature engineering
Feature engineering was performed to improve the representation of the preprocessed data for workflow orchestration and intelligent decision-making. Principal Component Analysis (PCA)^43 was applied to reduce data dimensionality by removing redundant and highly correlated variables while retaining the most informative feature components. The mathematical derivations are provided in Supplementary File 1 (Section S2).
Statistical descriptors, load behavior indicators, voltage stability indices, and power quality metrics were derived from the segmented time-series data. These engineered features included Load Factor (LF), Peak-to-Average Ratio (PAR), Voltage Stability Index (VSI), Voltage Unbalance Index, Power Factor (PF), and Total Harmonic Distortion (THD). The resulting feature set was used as the input to the workflow orchestration and intelligent decision-making modules.
The feature engineering workflow is summarized in Supplementary File 1 (Supplementary Algorithm 1). The procedure consisted of segmenting the preprocessed data, extracting statistical and electrical features, calculating load behavior, voltage stability, and power quality indicators, and applying PCA to generate the final feature vector used for model training and validation.
4. Visualized process canvas design
The Visualized Process Canvas was developed as a graph-based workflow orchestration framework for automating low-voltage (LV) acceptance procedures. The workflow was represented as a directed graph, G = (N, E), where N = {n1, n2, …, nm}denotes the workflow nodes corresponding to individual processing stages (e.g., data input, preprocessing, validation, and decision-making), and E = {eij}represents the directed edges defining the execution sequence between nodes. This graph-based representation enabled the creation of configurable workflows and their automated execution without manual coding.
Each workflow node performed a specific processing task by receiving input data, executing predefined operations, and forwarding the processed output to subsequent nodes. Acceptance criteria, including voltage and load thresholds, were implemented as configurable validation rules that could be updated without modifying the workflow structure. The workflow supported both sequential and parallel execution to improve computational efficiency. Machine learning models were integrated into designated workflow nodes to perform anomaly detection and automated acceptance validation (Figure 2).
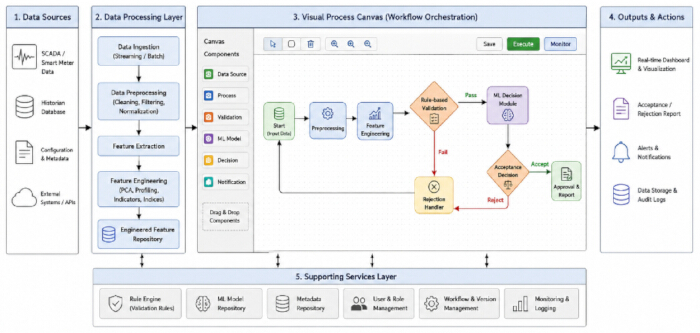
Figure 2: Visualized process canvas architecture for LV acceptance automation. Overview of the visual workflow orchestration framework used for LV acceptance automation. The process canvas illustrates the graphical organization of workflow nodes for data processing, feature engineering, rule-based validation, intelligent decision-making, and output generation to support workflow design, execution, and monitoring. Please click here to view a larger version of this figure.
The mathematical formulation describing information flow through the workflow graph is provided in Supplementary File 1 (Section S3). Supplementary File 1 (Supplementary Algorithm 2) describes the workflow orchestration procedure, including workflow traversal, node execution, rule validation, decision generation, and output aggregation.
The Visualized Process Canvas was implemented using a microservice-oriented software architecture to support scalability and modular deployment. The graphical workflow interface was developed using React.js to provide drag-and-drop workflow configuration. Backend orchestration services were implemented using Flask/FastAPI, while Eclipse Mosquitto served as the MQTT message broker for communication between workflow modules. EdgeX Foundry provided edge device management and IoT integration. Machine learning services were implemented with Scikit-learn, TensorFlow, and PyTorch, and containerized with Docker and Kubernetes.
5. Workflow orchestration engine
The workflow orchestration engine coordinated execution of the configured acceptance workflow. A detailed description is provided in Supplementary File 1 (Section S4), and the execution sequence is summarized in Supplementary Figure 1.
The workflow execution process consisted of validating the workflow definition, initializing the execution environment, scheduling workflow nodes according to their dependencies, executing nodes sequentially or in parallel, applying rule-based validation, aggregating intermediate outputs, and generating the final acceptance or rejection decision based on rule-based and machine learning evaluation. Execution results were published through dashboards, reports, application programming interfaces (APIs), and data storage services. The overall workflow orchestration process is illustrated in Figure 3.
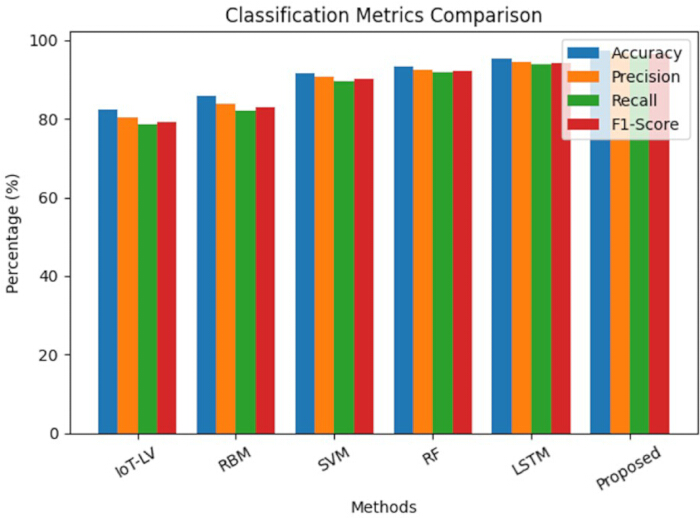
Figure 3: Comparison of classification performance metrics across different methods. Comparison of the classification performance of IoT-LV, RBM, Support Vector Machine (SVM), Random Forest (RF), Long Short-Term Memory (LSTM), and the proposed framework using the Open LV Network & Smart Meter dataset. Performance is evaluated using Accuracy, Precision, Recall, and F1-score. Results are presented as mean ± standard deviation (SD) from five independent experimental runs using a 70%/15%/15% training/validation/testing split. Error bars represent one standard deviation. Please click here to view a larger version of this figure.
6. Intelligent decision module
The Intelligent Decision Module was developed to automate low-voltage (LV) acceptance decisions using supervised machine learning models. Classification and regression algorithms were applied to the engineered feature vectors to support operational decision-making. Classification models identified normal and abnormal operating conditions, whereas regression models estimated future energy consumption and operational trends.
The input feature vector, X ∈ ℝd, comprised the statistical, voltage stability, load behavior, and power quality features extracted during the feature engineering stage. Standalone Support Vector Machine (SVM)44, Random Forest (RF)45, and Long Short-Term Memory (LSTM)46 models were implemented as baseline classifiers for comparative evaluation. The mathematical formulation of the learning models is provided in Supplementary File 1 (Section S5).
For classification, the output variable y ∈ {0,1} represented normal (0) and abnormal (1) operating conditions. When abnormal operating conditions or overload events were detected, the workflow generated a fault notification and flagged the acceptance process as invalid; otherwise, the process was classified as accepted.
The workflow orchestration engine integrated machine-learning predictions with rule-based validation, using a priority-based conflict-resolution strategy. Safety-critical operational rules and regulatory acceptance criteria were treated as hard constraints and therefore took precedence over machine-learning predictions when conflicts occurred. Final acceptance decisions were generated using the combined outputs of the rule-based validation and intelligent decision modules.
7. Cloud–edge integration and visualization dashboard
A cloud-edge computing architecture was implemented to support scalable data processing, storage, and visualization for the LV acceptance automation platform. Smart meters, SCADA systems, and IoT devices continuously collect electrical measurements, which are processed at the edge layer via filtering, normalization, feature extraction, and real-time inference to reduce communication overhead and enable low-latency decision-making. The mathematical derivations are provided in Supplementary File 1 (Section S6).
Processed data were transmitted to the cloud layer for long-term storage, advanced analytics, feature engineering, model training, and model management. Interactive dashboards provided real-time system monitoring, alerts, reporting, and operational decision support. The cloud-edge architecture is illustrated in Supplementary Figure 2, and the implementation details are summarized in Table 3.
| Layer | Component | Hardware / Software | Specification / Version | Purpose / Description |
| Edge Layer | Edge Device | Raspberry Pi 4 / NVIDIA Jetson Nano | Quad-core CPU, 4–8 GB RAM | Real-time data acquisition and local processing |
| IoT Gateway | Industrial IoT Gateway | MQTT / Modbus / OPC-UA support | Communication between sensors and edge/cloud | |
| Sensors / Smart Meters | Digital Smart Meters | Voltage, Current, Power Measurement | Data collection from LV network | |
| Edge Software | Python, EdgeX Foundry, MQTT Broker | Python 3.x | Data preprocessing, filtering, local inference | |
| Communication Protocols | Wi-Fi / PLC / RS-485 | Standard protocols | Data transmission to cloud layer | |
| Cloud Layer | Cloud Platform | AWS / Microsoft Azure / Google Cloud | Scalable cloud services | Data storage, analytics, and model training |
| Storage | AWS S3 / Azure Blob / InfluxDB | Time-series database | Storing historical and real-time data | |
| Compute & ML | Python, TensorFlow, PyTorch, Scikit-learn | ML libraries (latest versions) | Model training, evaluation, deployment | |
| Containerization | Docker, Kubernetes | Latest stable versions | Workflow orchestration and scalability | |
| Data Processing | Apache Spark / Pandas | Distributed processing | Large-scale data analytics | |
| Visualization Layer | Dashboard Tools | Grafana / Apache Superset / Plotly Dash | Web-based tools | Real-time monitoring and visualization |
| Web Framework | React.js / Angular / Flask / FastAPI | Modern web stack | UI development and API integration | |
| Notification System | Email / SMS Gateway / Push Notifications | Twilio / Firebase | Alert generation and communication | |
| API Services | REST APIs | JSON-based communication | Integration between modules |
Table 3: System implementation details. Summary of the hardware configuration, software environment, communication protocols, and cloud–edge computing components used for implementing the proposed LV acceptance automation platform.
Accès restreint. Veuillez vous connecter ou commencer un essai pour afficher ce contenu.
Résultats
The performance of the proposed Low-Voltage (LV) Acceptance Automation Platform was evaluated using the Open LV Network & Smart Meter Dataset together with a synthetic smart meter dataset generated to represent additional operating conditions and fault scenarios. The synthetic dataset enabled controlled evaluation of workflow orchestration, intelligent decision-making, and fault detection under abnormal operating conditions. The Open LV Network & Smart Meter Dataset comprised household smart meter measurements, f...
Accès restreint. Veuillez vous connecter ou commencer un essai pour afficher ce contenu.
Discussion
The experimental evaluation demonstrated that the proposed workflow-oriented Low-Voltage (LV) Acceptance Automation Platform consistently outperformed the benchmark approaches in classification, forecasting, fault detection, operational decision latency, and scalability. These performance improvements resulted from the integration of advanced feature engineering, workflow orchestration, cloud-edge collaboration, and hybrid rule-based and machine learning decision-making rather than from the use of a single machine learni...
Accès restreint. Veuillez vous connecter ou commencer un essai pour afficher ce contenu.
Déclarations de divulgation
Les auteurs déclarent qu'ils n'ont aucun intérêt financier ou non financier en conflit.
Remerciements
The authors thank the UK Power Networks Open Data Portal for providing the publicly available Open LV Network & Smart Meter dataset used in this study. This research received no external funding.
Accès restreint. Veuillez vous connecter ou commencer un essai pour afficher ce contenu.
Matériaux
| Nom | Entreprise | Numéro de catalogue | Commentaires |
|---|---|---|---|
| Apache Spark | Apache Software Foundation | Version 3.4+ | Analyses de données à grande échelle |
| Apache Superset | Apache Software Foundation | Version 3.x | Tableau de bord analytique |
| Docker Engine | Docker Inc. | Version 24.x | Déploiement d'applications |
| Eclipse Mosquitto MQTT Broker | Eclipse Foundation | Version 2.x | Échange de données |
| EdgeX Foundry (version Jakarta ou ultérieure) | LF Edge (Linux Foundation) | Version Jakarta / Geneva | Gestion des dispositifs périphériques |
| Flask / FastAPI | Pallets Projects / Sebastián Ramírez | Flask 2.3+ / FastAPI 0.100+ | Intégration d'API backend |
| Grafana | Grafana Labs | Version 10.x | Visualisation et surveillance |
| Passerelle IoT industrielle | Advantech / Siemens | ECU-1251 / SIMATIC IOT2040 | Communication capteur-vers-cloud |
| Capteurs IoT (capteurs de tension/courant) | Texas Instruments / Analog Devices | INA219 / ACS712 | Surveillance en temps réel du réseau |
| Kit de développement Jetson Nano | NVIDIA Corporation | 945-13450-0000-100 | Inférence d'intelligence artificielle en périphérie |
| Kubernetes | Cloud Native Computing Foundation (CNCF) | Version 1.27+ | Évolutivité des flux de travail |
| Modèle LSTM (Keras/TensorFlow) | Google (TensorFlow/Keras) | Inclus dans TF 2.12+ | Prévision et prédiction de charge |
| Module de communication par ligne électrique (PLC) | STMicroelectronics | ST7580 | Communication pour réseau intelligent |
| Plotly Dash | Plotly Inc. | Version 2.x | Visualisation interactive |
| Python 3.10 | Python Software Foundation | Version 3.10.x | Traitement et analyse de données |
| PyTorch | Meta AI | Version 2.0+ | Mise en œuvre de l'apprentissage profond |
| Algorithme de forêt aléatoire | Scikit-learn | Inclus dans la version 1.3+ | Classification des défauts |
| Raspberry Pi 4 Modèle B (4 Go de RAM) | Raspberry Pi Foundation | RPI4-MODBP-4GB | Traitement en périphérie |
| React.js / Angular | Meta / Google | React 18.x / Angular 16+ | Développement d'interface utilisateur |
| Module transceiver RS-485 | Maxim Integrated (Analog Devices) | MAX485 | Connectivité des dispositifs industriels |
| Scikit-learn | Développeurs de Scikit-learn | Version 1.3+ | Modèles d'apprentissage automatique |
| Machine à vecteurs de support (SVM) | Scikit-learn | Inclus dans la version 1.3+ | Classification et validation |
| TensorFlow | Google LLC | Version 2.12+ | Entraînement de modèles |
| Twilio / Firebase Cloud Messaging | Twilio Inc. / Google | Non applicable | Alertes et notifications |
| Module Wi-Fi | Espressif Systems | ESP8266 / ESP32 | Transmission de données |
| XGBoost | DMLC (Distributed ML Community) | Version 1.7+ | Soutien intelligent à la prise de décision |
Références
- Tong L, Zhou J, Li J. IoT-based low-voltage power distribution system management and control platform. Front Energy Res. 2022;10:902715. https://doi.org/10.3389/fenrg.2022.902715
- Babayigit B, Abubaker M. Industrial Internet of Things: A review of improvements over traditional SCADA systems for industrial automation. IEEE Syst J. 2023;18:120–133.
- Nakagawa EY, et al. Industry 4.0 reference architectures: State of the art and future trends. Comput Ind Eng. 2021;156:107241. https://doi.org/10.1016/j.cie.2021.107241
- Ladegourdie M, Kua J. Performance analysis of OPC UA for industrial interoperability towards Industry 4.0. Internet Things. 2022;3:507–525.
- Bader SR, Maleshkova M, Lohmann S. Structuring reference architectures for the industrial Internet of Things. Future Internet. 2019;11:151. https://doi.org/10.3390/fi11070151
- Fun TS, Samsudin A. Recent technologies, security countermeasure and ongoing challenges of industrial Internet of Things (IIoT): A survey. Sensors (Basel). 2021;21:6647. https://doi.org/10.3390/s21196647
- Mirani AA, et al. Key challenges and emerging technologies in industrial IoT architectures: A review. Sensors (Basel). 2022;22:5836. https://doi.org/10.3390/s22155836
- Fraile F, et al. Reference models for digital manufacturing platforms. Appl Sci. 2019;9:4433. https://doi.org/10.3390/app9204433
- Serôdio C, et al. Software and architecture orchestration for process control in Industry 4.0 enabled by cyber-physical systems technologies. Appl Sci. 2024;14:2160. https://doi.org/10.3390/app14052160
- Ungurean I, Gaitan NC. A software architecture for the industrial Internet of Things—A conceptual model. Sensors (Basel). 2020;20:5603. https://doi.org/10.3390/s20195603
- Hsiao CH, Lee WP. OPIIoT: Design and implementation of an open communication protocol platform for industrial Internet of Things. Internet Things. 2021;16:100441. https://doi.org/10.1016/j.iot.2021.100441
- Domínguez-Bolaño T, et al. An overview of IoT architectures, technologies, and existing open-source projects. Internet Things. 2022;20:100626. https://doi.org/10.1016/j.iot.2022.100626
- Sasiain J, et al. Towards flexible integration of 5G and IIoT technologies in Industry 4.0: A practical use case. Appl Sci. 2020;10:7670. https://doi.org/10.3390/app10217670
- Cañas H, et al. A conceptual framework for smart production planning and control in Industry 4.0. Comput Ind Eng. 2022;173:108659. https://doi.org/10.1016/j.cie.2022.108659
- Cabrini FH, et al. Enabling the industrial Internet of Things to cloud continuum in a real city environment. Sensors (Basel). 2021;21:7707. https://doi.org/10.3390/s21227707
- Gabriel MF, et al. Implementation of an IoT architecture for promoting healthy air quality in 84 homes of families with children. Build Environ. 2024;266:112040. https://doi.org/10.1016/j.buildenv.2024.112040
- Silva BN, Khan M, Han K. Internet of Things: A comprehensive review of enabling technologies, architecture, and challenges. IETE Tech Rev. 2018;35:205–220.
- Dhaou ISB, et al. Internet of Things technologies for smart grid. In: Research Anthology on Smart Grid and Microgrid Development. IGI Global; Hershey; 2022. p. 805–832.
- Kondoro A, et al. A low latency secure communication architecture for microgrid control. Energies. 2021;14:6262. https://doi.org/10.3390/en14196262
- Tightiz L, Yang H. A comprehensive review on IoT protocols' features in smart grid communication. Energies. 2020;13:2762. https://doi.org/10.3390/en13112762
- Kondoro A, et al. Real-time performance analysis of secure IoT protocols for microgrid communication. Future Gener Comput Syst. 2021;116:1–12.
- Rodrigues R, et al. A review of solid-state circuit breakers. IEEE Trans Power Electron. 2020;36:364–377.
- IEEE. IEEE Std 1159-2019: IEEE recommended practice for monitoring electric power quality. IEEE; Piscataway (NJ); 2019. https://doi.org/10.1109/IEEESTD.2019.8800097
- Otcenasova A, et al. The influence of power quality indices on active power losses in a local distribution grid. Energies. 2019;12:1389. https://doi.org/10.3390/en12071389
- Ma K, et al. Review of distribution network phase unbalance: Scale, causes, consequences, solutions, and future research direction. CSEE J Power Energy Syst. 2020;6:479–488.
- Peppanen J, et al. Modeling power electronic equipment to improve distribution feeder current and voltage balance [Presentation]. Presented at: IEEE PES Transmission and Distribution Conference and Exposition (T&D); Denver, CO; 2018. Available from: https://ieeexplore.ieee.org/ https://doi.org/10.1109/TDC.2018.8440261
- Sayed S, et al. Design and realization of an open-source and modular smart meter. Energy Sci Eng. 2019;7:1405–1422.
- Satapathy LM, et al. Arduino based home automation using Internet of Things (IoT). Int J Pure Appl Math. 2018;118:769–778.
- Shaban M, et al. Design of a partially grid-connected photovoltaic microgrid using IoT technology. Appl Sci. 2021;11:11651. https://doi.org/10.3390/app112411651
- Shaban M, Dhaou IB. Design of an IoT-enabled microgrid architecture for a partial grid-connected mode [Presentation]. Presented at: 18th International Multi-Conference on Systems, Signals and Devices (SSD); Virtual; 2021. Available from: https://ieeexplore.ieee.org/ https://doi.org/10.1109/SSD52085.2021.9429443
- Taye BZ, et al. Rural electrification planning using geographic information system (GIS). Cogent Eng. 2020;7:1836730. https://doi.org/10.1080/23311916.2020.1836730
- Huld T, et al. Geospatial analysis of photovoltaic mini-grid system performance. Energies. 2017;10:218. https://doi.org/10.3390/en10020218
- Domínguez J, et al. IntiGIS-Local: A geospatial approach to assessing rural electrification alternatives for sustainable socio-economic development in isolated communities—A case study of Guasasa, Cuba. Energies. 2024;17:3835. https://doi.org/10.3390/en17153835
- Tafula JE, et al. Multicriteria decision-making approach for optimum site selection for off-grid solar photovoltaic microgrids in Mozambique. Energies. 2023;16:2894. https://doi.org/10.3390/en16062894
- Isihak S, et al. Evolution of GIS-based rural electrification planning models and an application of OnSSET in Nigeria. Renew Sustain Energy Transit. 2022;2:100019. https://doi.org/10.1016/j.rset.2022.100019
- Korkovelos A, et al. The role of open access data in geospatial electrification planning and the achievement of SDG7: An OnSSET-based case study for Malawi. Energies. 2019;12:1395. https://doi.org/10.3390/en12071395
- Cicilio P, et al. uGrid: Reliable minigrid design and planning toolset for rural electrification. IEEE Access. 2019;7:163988–163999.
- Nasir M, et al. Optimal planning and design of low-voltage low-power solar DC microgrids. IEEE Trans Power Syst. 2018;33:2919–2928.
- Vai V, et al. Optimal low-voltage distribution topology with integration of PV and storage for rural electrification in developing countries: A case study of Cambodia. J Mod Power Syst Clean Energy. 2020;8:531–539.
- Banad Y, Sharif S, Rezaei Z. Artificial intelligence and machine learning for smart grids: from foundational paradigms to emerging technologies with digital twin and large language model-driven intelligence. Energy Convers Manag X. 2025;28:101329. https://doi.org/10.1016/j.ecmx.2025.101329
- Álvarez-López C, González-Briones A, Li T. Explainable AI and multi-agent systems for energy management in IoT-edge environments: a state-of-the-art review. Electronics. 2026;15(2):385. https://doi.org/10.3390/electronics15020385
- UK Power Networks. Open data portal [Online]. Available from: https://www.ukpowernetworks.co.uk/our-company/open-data-portal (Accessed June 2026).
- Jolliffe IT. Principal Component Analysis. 2nd ed. Springer; New York; 2002. https://doi.org/10.1007/b98835
- Cortes C, Vapnik V. Support-vector networks. Mach Learn. 1995;20:273–297.
- Breiman L. Random forests. Mach Learn. 2001;45:5–32.
- Hochreiter S, Schmidhuber J. Long short-term memory. Neural Comput. 1997;9:1735–1780.
- Fawcett T. An introduction to ROC analysis. Pattern Recognit Lett. 2006;27:861–874.
- Montgomery DC, Runger GC. Applied Statistics and Probability for Engineers. 8th ed. John Wiley & Sons; Hoboken (NJ); 2020.
- Montgomery DC. Design and Analysis of Experiments. 10th ed. John Wiley & Sons; Hoboken (NJ); 2020.
Accès restreint. Veuillez vous connecter ou commencer un essai pour afficher ce contenu.