This protocol describes the generation of fibrin-based three-dimensional engineered vascular tissues from human aortic smooth muscle cells and subsequent processing for extracellular matrix analysis using immunofluorescence staining, mass spectrometry–based proteomics, and Western blotting.
מאמר שיטה
Generation of Fibrin-Based Three-Dimensional Engineered Vascular Tissues from Human Aortic Smooth Muscle Cells for Proteomic Analysis
במאמר זה
סיכום
תקציר
Vascular smooth muscle cells (SMCs) reside within the medial layer of blood vessels, where they interact with an extracellular matrix (ECM) composed of collagen, elastin, and proteoglycans to maintain vascular structure and function. Aberrant ECM remodeling contributes to multiple vascular diseases; however, conventional two-dimensional culture systems do not adequately recapitulate the three-dimensional (3D) cellular and matrix environment required to study SMC–ECM interactions and matrix remodeling. This protocol describes the generation of engineered vascular tissues (EVTs) from primary human aortic SMCs cultured within fibrin-based 3D hydrogels. Following casting between flexible polydimethylsiloxane posts, EVTs undergo cellular alignment, contraction, and deposit de novo ECM, providing a physiologically relevant platform for studying vascular matrix biology. The protocol details tissue fabrication, culture, harvesting, and downstream analysis of newly deposited ECM by immunofluorescence staining. In addition, a workflow is presented for qualitative and quantitative characterization of EVT-derived proteins using Western blotting and mass spectrometry-based proteomics. Sequential protein extraction enables assessment of soluble and ECM-enriched protein fractions, facilitating in-depth evaluation of ECM composition. This platform provides a reproducible approach for investigating ECM production and remodeling by human SMCs in a 3D environment.
מבוא
The development of more physiologically relevant in vitro tissue models in high-throughput, reproducible formats can enhance mechanistic investigations of cardiovascular disease (CVD) and reduce attrition in drug discovery1,2. For vascular diseases in particular, extracellular matrix (ECM) remodeling is a common hallmark3, and tissue-based models offer clear advantages over traditional monolayer cultures, which do not feature a three-dimensional (3D) ECM microenvironment. Previous studies have indicated that the absence of an ECM niche may contribute to phenotypic switching of smooth muscle cells (SMCs)4, the dominant ECM-producing cells in blood vessels, thereby confounding investigations into SMC–ECM crosstalk in disease.
The SMC-derived ECM comprises more than 300 matrisome proteins that form a complex structural scaffold essential for vessel integrity and function5. Principal components include collagen types I and III, which provide tensile strength and prevent overstretching, and crosslinked elastin lamellae, which enable distensibility in response to blood flow6. Chondroitin sulfate proteoglycans, such as versican, also contribute to vascular compressive resilience by maintaining tissue hydration7. Since the first description of a tissue-engineered blood vessel construct approximately 40 years ago8, several models have been developed to mimic the ECM architecture of vascular tissue using different scaffold materials9,10,11,12 and fabrication strategies13,14,15. Despite the emerging role of artificial intelligence in standardizing these approaches16, many currently require specialized equipment and have limited scalability.
For disease modeling applications, reductionist 3D models that require less technical expertise are advantageous and may be more readily adopted and transferred between laboratories. A successful example is fibrin-based engineered heart tissue (EHT) generated from human induced pluripotent stem cell (iPSC)-derived cardiomyocytes, which is now widely used for cardiac disease modeling and drug screening17,18,19,20. Recently, our laboratory adapted the EHT platform to generate engineered vascular tissues (EVTs) from mouse aortic SMCs and applied this system to model vascular calcification21.
The model exploits the natural fibrin polymerization process to rapidly form an insoluble fibrin matrix suspended between flexible polydimethylsiloxane (PDMS) posts. Embedded cells anchor to Arg-Gly-Asp (RGD) domains within the biopolymer scaffold, allowing them to secrete and accumulate their own ECM over time21. This process generates a more physiologically relevant 3D environment, while the ability of SMCs within EVTs to contract over time also makes the system well suited for studying SMC contractility22.
Here, we provide a detailed protocol for generating EVTs using human aortic SMCs. Downstream embedding in optimal cutting temperature (OCT) compound or paraffin can be performed, and transverse or longitudinal sections can be stained for a range of applications, including terminal deoxynucleotidyl transferase dUTP nick end labeling (TUNEL) for assessment of apoptosis. In addition, we describe a two-step protein extraction approach that enables efficient separation of intracellular and soluble matrisome proteins from less soluble, highly crosslinked ECM proteins. Analysis of these fractions by mass spectrometry-based proteomics enables characterization of de novo ECM production in EVTs.
פרוטוקול
Primary human aortic SMCs were commercially obtained from PromoCell (Cat. No. C-12533), Lonza (Cat. No. CC-2571), Thermo Fisher Scientific (Cat. No. C0075C), and Tebu-Bio/Cell Applications (Cat. No. 354-05a). All cells were acquired from commercial vendors and were supplied in accordance with the vendors’ ethical procurement policies and applicable regulations.
1. Preparation of Reagents (Aprotinin, Thrombin, and Fibrinogen)
- Under a sterile hood, add 303 µL of sterile distilled water to 10 mg of lyophilized bovine aprotinin. Mix carefully until the powder is completely resuspended. Prepare six 50 µL aliquots (33 mg/mL) and store at −80°C.
- Under a sterile hood, add 5 mL of sterile 0.9% NaCl solution to 500 mg of lyophilized human fibrinogen containing sodium citrate and sodium chloride. Do not mix with a pipette, as this may cause clumping and material loss.
- Seal the fibrinogen bottle with its lid under a sterile hood. Incubate the bottle in a 37°C water bath for 30 min, swirling periodically to facilitate complete resuspension. Prepare ten 500 µL aliquots (100 mg/mL) and store at −80°C.
NOTE: Ensure that no visible clumps remain after fibrinogen resuspension. Incomplete resuspension will reduce the effective concentration of dissolved fibrinogen and may affect protocol reproducibility. - Thaw one aliquot of aprotinin and one aliquot of fibrinogen solution. Add 0.76 µL of aprotinin solution to a 500 µL fibrinogen aliquot to achieve a final aprotinin concentration of 50 µg/mL.
- Aliquot the fibrinogen–aprotinin mixture into 50 µL volumes and store at −80°C together with the remaining aprotinin aliquot.
- Under a sterile hood, prepare a diluent by mixing 6.6 mL of sterile Dulbecco’s phosphate-buffered saline (DPBS) with 4.4 mL of sterile water.
- Under a sterile hood, add 10 mL of the DPBS–water diluent to 1 kU of lyophilized bovine thrombin supplied in 50 mM sodium citrate, 0.2 M NaCl, and 0.1% PEG-8000 (pH 6.5). Mix carefully until the thrombin is completely resuspended.
- Aliquot the thrombin solution into eighty 125 µL aliquots (100 U/mL) and store at −80°C. Further subdivide one 125 µL aliquot into forty 3 µL aliquots, allowing for residual volume during pipetting, and store at −80°C with the remaining aliquots.
NOTE: Limit freeze–thaw cycles for fibrinogen, aprotinin, and thrombin aliquots to a maximum of three. Aliquots are stable for at least 2 years when stored at −80°C.
2. Preparation of Culture Media, Casting Apparatus, and Agarose Solution
NOTE: This protocol uses Smooth Muscle Cell Growth Medium 2 (SMCGM-2) as the complete medium for growth and maintenance of SMCs prior to casting EVTs. Plan culture vessel numbers and sizes based on a requirement of 550,000 cells per EVT.
- Under a sterile hood, add 5.3 mL of 100× penicillin–streptomycin (10,000 U/mL) solution to a 500 mL bottle of SMCGM-2 basal medium.
- Complete the medium formulation by adding the manufacturer-provided fetal bovine serum (FBS; 25 mL) and 500 µL each of the following supplements: recombinant human epidermal growth factor (0.5 µg/mL stock; final concentration 0.5 ng/mL), recombinant human basic fibroblast growth factor (2 µg/mL stock; final concentration 2 ng/mL), and recombinant human insulin (5 mg/mL stock; final concentration 5 µg/mL).
- Culture SMCs, splitting the cells at a 1:3 ratio at each passage until approximately 80% confluency is reached in a T225 flask.
NOTE: EVTs used to generate the data presented in this manuscript were cast using SMCs at passages 8 or 9. - On the day before EVT casting, autoclave the PDMS racks and polytetrafluoroethylene (PTFE) spacers in separate clean containers. Use one rack–spacer pair for casting four EVTs within one column of a 24-well tissue culture plate.
NOTE: PDMS racks and PTFE spacers used for EVT generation may be obtained commercially. Refer to the Table of Materials for product details. - On the day of EVT casting, prepare EVT medium by adding one 50 µL aprotinin stock aliquot prepared in Step 1.1 to 49.95 mL of SMCGM-2. Store the medium at 4°C until use.
- Weigh 670 mg of Dulbecco’s Modified Eagle Medium (DMEM) powder under a sterile hood and dissolve it in 5 mL of sterile water to prepare basal 10× DMEM. Sterile-filter the solution through a 0.22 µm filter into a sterile tube and store at 4°C until use.
- Prepare complete 3× DMEM by combining 3 mL of basal 10× DMEM, 1.5 mL of FBS, 300 µL of 100× penicillin–streptomycin solution, and 300 µL of GlutaMAX Supplement. Bring the volume to 10 mL with sterile water.
- Prepare a 2% agarose suspension by adding 2.0 g agarose powder to 100 mL DPBS under a sterile hood.
- Autoclave the agarose suspension before EVT casting and allow the autoclave cycle to complete fully.
- Transfer the agarose solution to a 60°C oven and maintain it in a liquid state until use. Store the molten agarose for no longer than 24 h and do not reuse it after solidification.
3. Casting and Culture of EVTs
- Warm SMCGM-2, 0.05% trypsin–ethylenediaminetetraacetic acid (EDTA), and DPBS to 37°C in a water bath.
- Wash the cells once with pre-warmed DPBS. Aspirate the DPBS and incubate the cells with 0.05% trypsin–EDTA in a cell culture incubator (37°C, 5% CO₂) for 3 min.
- After cell detachment, dissociate the cell suspension by pipetting. Neutralize the trypsin with an equal volume of pre-warmed SMCGM-2 and centrifuge at 220 × g for 5 min.
- During centrifugation, thaw fibrinogen–aprotinin aliquots (Step 1.5) and 3 µL thrombin aliquots (Step 1.8) on ice. Use one 50 µL fibrinogen–aprotinin aliquot for every nine EVTs. Use one 3 µL thrombin aliquot for each EVT.
- During centrifugation, place the molten agarose solution under a sterile hood. Dispense 1.6 mL agarose into each required well of a 24-well plate.
- Immediately insert the PTFE spacers into the agarose and allow the agarose to solidify for 10 min.
- Resuspend the cell pellet in 10 mL of pre-warmed SMCGM-2 and determine the cell concentration.
- Collect 550,000 cells for each EVT and centrifuge at 220 × g for 5 min.
- On ice, prepare 105 µL of EVT master mix per EVT to provide 100 µL for cell resuspension while allowing for pipetting loss. Prepare the master mix using fibrinogen–aprotinin solution (5% v/v), SMCGM-2 (91% v/v), and 3× DMEM (4% v/v). Add the components in this order.
- Resuspend the cell pellet in EVT master mix using 100 µL of master mix per EVT. Keep the cell suspension on ice.
- Remove the PTFE spacers from the solidified agarose molds.
- Position the PDMS racks in the center of each agarose mold.
- Prepare one 3 µL thrombin aliquot for each EVT. Aspirate 97 µL of the cell suspension with a P100 pipette and adjust the volume to 100 µL while retaining a small air gap at the tip.
- Dispense the retained air against the side of the thrombin tube. Add the 97 µL cell suspension directly to the 3 µL thrombin aliquot, gently mix twice, and immediately aspirate the entire 100 µL volume.
- Dispense the mixture between the PDMS posts, depressing the pipette plunger only to the first stop to minimize bubble formation. Discard the residual volume remaining in the pipette tip.
- Repeat Steps 3.13–3.15 for all remaining EVTs.
- Incubate the plate at 37°C and 5% CO₂ for 1 h.
- Warm SMCGM-2 to provide 500 µL per EVT.
- Slowly dispense 500 µL SMCGM-2 into the corner of each well containing an EVT. Return the plate to the incubator for 15 min.
- Warm EVT medium and prepare 1.5 mL per EVT.
- Transfer 1.5 mL EVT medium into new wells of a 24-well plate. Carefully lift the PDMS racks and transfer the EVTs into the prepared wells.
NOTE: EVTs are considered successfully formed if they remain attached to both PDMS posts following Step 3.21. Failed EVTs detach from one post and hang from the other and should be discarded because they are not subjected to the same mechanical tension. Successfully formed EVTs should exhibit a uniform cylindrical shape and be free of bubbles, as bubbles may alter EVT morphology and impair contraction. Healthy, viable EVTs are considered to contain <10% TUNEL-positive cells, as determined by the TUNEL assay (Step 5). - Replace the medium the following day and every 2–3 days thereafter for the desired culture duration.
- Acquire images of EVTs at 4× magnification using an inverted light microscope in darkfield mode.
- Using ImageJ, select the straight-line tool and draw a line between the inner edges of the two PDMS posts parallel to the longitudinal axis of the tissue. Select Analyze > Measure to determine the EVT length.
4. Fixation and Embedding of EVTs
- While the EVTs remain on the racks, wash them with pre-warmed PBS in new wells for 3 × 5 min in a cell culture incubator at 37°C and 5% CO₂.
- Transfer the racks to new wells containing 1.5 mL of 10% neutral buffered formalin per well. Seal the plate with Parafilm and incubate with gentle shaking at 300 rpm for 24 h at room temperature.
- Wash the EVTs with PBS in new wells for 3 × 5 min.
- Proceed with either cryo-embedding or paraffin embedding as described below.
- Cryo-embedding
- Using clean tweezers, carefully remove each EVT from the posts and transfer it to a well of a 48-well plate containing 300 µL of 30% sucrose in PBS. Incubate with gentle shaking at 300 rpm for 24 h at 4°C.
- Transfer the EVT to a new well containing 50% sucrose–OCT compound. Incubate with gentle shaking at 300 rpm for 24 h at 4°C.
- Transfer the EVT to a new well containing OCT compound. Incubate with gentle shaking at 300 rpm for 24 h at 4°C.
- Transfer the EVT to a cryomold containing OCT compound, orient the longer side flat (parallel to the cryomold), and rapidly freeze it over a pre-cooled reservoir of 2-methylbutane on dry ice.
- Section the EVTs at 10 µm (transverse) or 5 µm (longitudinal) using a cryostat with the specimen holder maintained at −20°C and the blade at −16°C. Collect the sections onto glass slides and either process them immediately or store them at −80°C.
- Paraffin embedding
- Using clean tweezers, remove each EVT from the posts and transfer it to 70% ethanol for 24 h.
- Dehydrate the EVTs sequentially in 70% ethanol for 15 min, 90% ethanol for 15 min, and 100% ethanol for 3 × 15 min.
- Clear the EVTs in xylene for 20 min. Repeat twice.
- Infiltrate the EVTs with paraffin wax at 60°C for 30 min. Repeat twice.
- Transfer each EVT to an embedding mold, attach a cassette, and allow the paraffin block to cool. For longitudinal sectioning, orient the longer side flat (parallel to the embedding mold). For transverse sectioning, orient the longer side upright (perpendicular to the embedding mold).
- Section the EVTs at 10 µm (transverse) or 5 µm (longitudinal) using a microtome.
- Float the sections on a 40°C water bath and mount them onto glass slides.
- Dry the sections overnight at 37°C.
5. TUNEL Assay Using EVT Transverse Cryosections
- Thaw the slides and allow them to air dry. Rinse the slides with PBS in a glass staining jar, draw hydrophobic barriers around each section using a PAP pen, and rinse the slides again with PBS.
- Transfer the slides to a humid chamber and remove excess PBS using absorbent tissue. Apply approximately 30 µL of 0.1% Triton X-100 in PBS to each section and incubate for 15 min at room temperature to permeabilize the tissue.
- Rinse the slides twice with PBS in a staining jar. Transfer the slides to a humid chamber and cover each section with approximately 30 µL PBS. For positive control sections, apply approximately 30 µL DNase I (2.73 Kunitz/µL) prepared in RNase-free water.
- Incubate the slides in a humid chamber at 37°C for 15 min. Seal the chamber with Parafilm to prevent evaporation.
- Rinse the slides twice with PBS in a staining jar. Prepare the TUNEL reaction mixture by combining the label solution and enzyme solution at a 9:1 ratio according to the manufacturer’s instructions. Apply approximately 30 µL of the reaction mixture to each section. For negative control sections, apply the label solution only.
- Incubate the slides in the humid chamber at 37°C for 60 min in the dark. Seal the chamber with Parafilm to prevent evaporation.
- Rinse the slides twice with PBS in a staining jar. Counterstain all sections with DAPI (4 µg/mL in PBS; approximately 30 µL per section) for 15 min.
- Rinse the slides twice with PBS in a staining jar. Apply approximately 20 µL aqueous mounting medium to each section, mount coverslips, and allow the slides to dry at room temperature.
- Acquire images using a confocal microscope with a 10× objective. Detect TUNEL-positive cells using an excitation wavelength of 450–500 nm and an emission detection wavelength of 515–565 nm. Detect DAPI using an excitation wavelength of 340–380 nm and an emission detection wavelength of 430–480 nm.
- Using ImageJ, convert the DAPI and TUNEL images to 8-bit grayscale. Select Image > Adjust > Threshold and adjust the threshold so that the processed image accurately reflects the original fluorescence image. Apply identical threshold settings to all DAPI images and all TUNEL images within the experiment.
- Select Process > Binary > Watershed to separate partially overlapping nuclei.
- Select Analyze > Analyze Particles to quantify total nuclei in the DAPI images and TUNEL-positive nuclei in the TUNEL images.
- For DAPI images, analyze particles from 5 pixels2 to infinity. For TUNEL images, analyze particles from 0 pixels2 to infinity. Use a circularity range of 0.00–1.00 for both analyses.
- Calculate the percentage of TUNEL-positive cells by dividing the number of TUNEL-positive nuclei by the total number of DAPI-positive nuclei and multiplying by 100.
NOTE: A single 10× image typically captures most of a transverse EVT cross-section; therefore, one field of view is generally sufficient for analysis. However, average the counts obtained from at least two sections per EVT. Successful assay performance is indicated by negative control sections exhibiting approximately 0% TUNEL-positive cells and positive control sections exhibiting approximately 100% TUNEL-positive cells.
6. Immunofluorescence Staining Using EVT Cryosections
- Thaw the slides and allow them to air dry. Rinse the slides with PBS in a glass staining jar, draw hydrophobic barriers around each section using a PAP pen, and rinse the slides again with PBS.
- Prepare 50 mM ammonium chloride (NH4Cl) in PBS. Incubate the slides in this solution for 15 min.
NOTE: This incubation reduces tissue autofluorescence during subsequent fluorescence imaging. - Prepare 10 mL blocking solution consisting of 10% donkey serum and 0.2% glycine in PBS. Sterile-filter the solution through a 0.22 µm filter and prepare 1 mL aliquots. Supplement one aliquot with 0.5% Triton X-100 to generate the permeabilization solution.
- Rinse the slides with PBS.
- Remove excess PBS using absorbent tissue. Apply approximately 30 µL of the permeabilization solution to each section and incubate for 1 h at room temperature in a humid chamber.
- Prepare matched dilutions of the primary antibodies and corresponding IgG controls in blocking solution.
NOTE: The primary antibodies and IgG controls used in this study are listed in the Table of Materials. - Aspirate the permeabilization solution and apply approximately 30 µL of the appropriate primary antibody or IgG control solution to each section. Incubate overnight at 4°C in a humid chamber.
- Rinse the slides with PBS for 3 × 5 min. Prepare the secondary antibodies at a 1:200 dilution in blocking solution.
NOTE: The secondary antibodies used in this study are listed in the Table of Materials. - Remove excess PBS using absorbent tissue. Apply approximately 30 µL of the secondary antibody solution to each section and incubate for 1 h at room temperature in a humid chamber.
- Aspirate the secondary antibody solution and counterstain each section with DAPI (4 µg/mL in PBS; approximately 30 µL per section) for 15 min.
- Rinse the slides twice with PBS. Apply approximately 20 µL aqueous mounting medium to each section, mount coverslips, and allow the slides to dry at room temperature.
- Image the sections using a fluorescence microscope with a 10× objective and appropriate excitation channels (350, 488, 555, and 647 nm).
7. Protein Extraction from EVTs
NOTE: This protocol uses a two-step extraction procedure to sequentially isolate soluble extracellular and intracellular proteins, followed by less soluble, highly crosslinked extracellular matrix (ECM) proteins.
- Prepare tissue lysis buffer (TLB) consisting of 20 mM Tris-HCl, 113 mM NaCl, 5 mM EDTA, 2 mM EGTA, 1% Triton X-100, and 0.1% SDS at pH 7.4.
- Prepare guanidine hydrochloride (GuHCl) buffer consisting of 4 M GuHCl, 50 mM sodium acetate, and 12.5 mM EDTA at pH 5.8.
- Supplement 10 mL of each buffer with one cOmplete Mini EDTA-free Protease Inhibitor Cocktail tablet and one PhosSTOP phosphatase inhibitor tablet, as specified in the Table of Materials.
- While the EVTs remain on the racks, wash them with 1.5 mL of pre-warmed PBS per well for 3 × 5 min in a cell culture incubator at 37°C and 5% CO₂.
- Remove the plate from the incubator. Using clean tweezers, detach each EVT from the posts and transfer it to a glass slide. Cut the EVTs into smaller pieces using Vannas-type micro scissors or a scalpel.
- Transfer the EVT fragments to a low-protein-binding 2 mL tube containing 100 µL of complete TLB. Ensure that all tissue fragments are fully submerged.
- Seal the tube lids with Parafilm and incubate at room temperature with vigorous shaking at 1,400 rpm for 24 h using the multi-tube vortexer specified in the Table of Materials.
NOTE: The TLB incubation is extended to 24 h to demonstrate that a proportion of the ECM deposited within the EVTs becomes integrated into the tissue and is no longer readily soluble. - Centrifuge the samples at 18,000 × g for 2 min. Using a gel-loading tip, transfer the supernatant to a new low-protein-binding tube and designate it as the TLB fraction. This fraction contains intracellular proteins together with soluble and weakly associated ECM proteins.
- Wash the remaining pellet with 1 mL of PBS and invert the tube several times to mix. Centrifuge at 18,000 × g for 2 min and remove the supernatant. Repeat the wash and centrifugation procedure once.
- Add 25 µL of complete GuHCl buffer to the washed pellet. Ensure that all tissue fragments are fully submerged.
- Seal the tube lids with Parafilm and incubate for 48 h at 37°C with gentle shaking at 750 rpm. Use a heated lid to minimize evaporation.
- Centrifuge the samples at 18,000 × g for 2 min. Using a gel-loading tip, transfer the supernatant to a new low-protein-binding tube and designate it as the GuHCl fraction. This fraction is enriched for less soluble, highly crosslinked ECM proteins and other insoluble matrix-associated components.
- Measure the protein concentrations in both fractions using a Bradford assay with a bovine serum albumin (BSA) standard curve ranging from 0.125 mg/mL to 2 mg/mL. Prepare separate BSA standard curves in TLB and GuHCl buffer.
- Normalize the samples by using 10 µg of protein from each TLB and GuHCl fraction for downstream Western blotting or mass spectrometry-based proteomics.
- Protein precipitation and deglycosylation for Western blot analysis
- Before Western blot analysis, precipitate 10 µg of protein from each TLB and GuHCl fraction. This precipitation step is required because direct loading of GuHCl-containing samples onto SDS-PAGE gels causes substantial band distortion.
- Add 10 volumes of ice-cold ethanol to each sample and store overnight at −20°C to induce protein precipitation.
- Centrifuge the samples at 18,000 × g for 30 min at 0°C. Remove most of the ethanol supernatant using a pipette and allow the remaining ethanol to evaporate in a fume hood or vacuum concentrator.
NOTE: Avoid acetone precipitation because it results in greater retention of residual GuHCl salts in the protein pellets. These salts remain after deglycosylation and cause substantial band distortion during SDS-PAGE. - Prepare a 4× deglycosylation buffer consisting of 0.6 M NaCl, 0.2 M sodium acetate, and 40 mM EDTA at pH 6.8.
- Prepare a 1× deglycosylation mastermix containing chondroitinase ABC at 1:100, heparinase II at 1:500, endo-β-galactosidase at 1:500, β1,4-galactosidase at 1:200, β-N-acetylglucosaminidase at 1:200, α2-3,6,8,9 neuraminidase at 1:200, and endo-α-N-acetylgalactosaminidase at 1:200.
- Resuspend each protein pellet in 20 µL of deglycosylation mastermix. Incubate at 25°C with shaking at 750 rpm for 2 h, followed by incubation at 37°C with shaking at 750 rpm for 24 h.
- After 24 h, dry the samples using a vacuum concentrator. Resuspend each sample in 20 µL of water containing PNGase F at 1:100 and incubate at 37°C with shaking at 750 rpm for 24 h.
- Add 6.66 µL of 4× SDS-PAGE loading buffer to each sample. Boil the samples and perform Western blotting according to standard procedures.
NOTE: The commercial primary and secondary antibodies used for Western blotting are listed in the Table of Materials.
- Protein preparation for mass spectrometry-based proteomics
- For mass spectrometry-based proteomics, perform Step 7.15.7 using 20 µL of H218O containing PNGase F at 1:100 instead of water. Incubate at 37°C with shaking at 750 rpm for 24 h.
NOTE: PNGase F digestion of N-linked glycans from asparagine residues in the presence of H218O converts asparagine to aspartic acid and introduces a +2.99 Da mass shift. Include deamidation with 18O on asparagine as a variable modification during database searching. Identification of this modification improves peptide coverage of N-glycosylated proteins and provides evidence of former N-linked glycosylation sites. - Prepare 1 M 4-(2-hydroxyethyl)piperazine-1-propanesulfonic acid (EPPS) buffer at pH 8.0. Prepare a denaturation solution containing 50 mM EPPS, 9 M urea, and 3 M thiourea. Store the solution in 1 mL aliquots at −80°C.
- Prepare 100 mM dithiothreitol and 500 mM iodoacetamide stock solutions separately in water. Store each solution in 0.5 mL aliquots at −80°C.
- To each 20 µL protein sample following PNGase F digestion, add 40 µL of urea/thiourea solution and 6.66 µL of 100 mM dithiothreitol. Vortex, briefly centrifuge, and incubate for 1 h at 37°C.
- To each 66.66 µL sample following denaturation and reduction, add 7.41 µL of 500 mM iodoacetamide. Vortex, briefly centrifuge, and incubate for 1 h at room temperature in the dark.
- To each 74.07 µL sample following alkylation, add 10 volumes of ice-cold ethanol and store overnight at −20°C to induce protein precipitation.
- Prepare 0.1 M triethylammonium bicarbonate (TEAB) buffer at pH 8.5. Reconstitute the mass spectrometry-grade Trypsin/Lys-C mix in 50 mM acetic acid to a final concentration of 0.04 µg/µL.
- Centrifuge the precipitated protein samples at 18,000 × g for 30 min at 0°C. Discard the supernatant and dry the samples using a vacuum concentrator.
- Redissolve the protein pellets in 170 µL of 0.1 M TEAB buffer. Add 10 µL of Trypsin/Lys-C to achieve an enzyme-to-protein mass ratio of 1:25 and incubate for 18 h at 37°C with shaking at 750 rpm.
- Quench the Trypsin/Lys-C digestion by adding 20 µL of 10% (v/v) trifluoroacetic acid (TFA) to each sample.
- Briefly centrifuge the samples and transfer them to a round-bottom 96-well plate.
- For mass spectrometry-based proteomics, perform Step 7.15.7 using 20 µL of H218O containing PNGase F at 1:100 instead of water. Incubate at 37°C with shaking at 750 rpm for 24 h.
- Peptide clean-up
- Prepare 50% acetonitrile (ACN) containing 1% TFA, 70% ACN containing 1% TFA, and 1% ACN containing 0.1% TFA for peptide clean-up using C18 cartridges on the AssayMAP Bravo Protein Sample Prep Platform.
- Clean the peptide samples using the Peptide Cleanup v4.0 protocol on the AssayMAP Bravo platform.
- Dry the eluates using a vacuum concentrator. Resuspend each sample in 40 µL of 1% ACN and 0.1% formic acid (FA) to obtain a peptide concentration of 250 ng/µL.
- Liquid chromatography–tandem mass spectrometry
- Analyze 500 ng of each peptide sample by liquid chromatography–tandem mass spectrometry using a Vanquish Neo UHPLC system coupled to an Orbitrap Astral Zoom mass spectrometer.
- Prepare mobile phase A as 0.1% FA in H₂O and mobile phase B as 80% ACN and 0.1% FA in H₂O.
- Use a trap-and-elute configuration with a PepMap Neo trap cartridge measuring 0.3 mm × 5 mm and an EASY-Spray PepMap RSLC C18 analytical column with 2 µm particles and dimensions of 15 cm × 150 µm.
- Equilibrate the system using four column volumes of 0.1% FA in H₂O.
- From 0 to 1 min, increase mobile phase B from 2% to 7% at a flow rate of 5 µL/min.
- From 1 to 2 min, increase mobile phase B from 7% to 10% while decreasing the flow rate from 5 µL/min to 1.25 µL/min.
- From 2 to 16.5 min, increase mobile phase B from 10% to 35% at a flow rate of 1.25 µL/min.
- From 16.5 to 18.5 min, increase mobile phase B from 35% to 45% at a flow rate of 1.25 µL/min.
- From 18.5 to 19 min, increase mobile phase B from 45% to 99% at a flow rate of 1.25 µL/min.
- From 19 to 20 min, maintain mobile phase B at 99% and increase the flow rate to 5 µL/min.
- Set the mass spectrometry acquisition period to 0–20 min and the expected liquid chromatography peak width to 6 s. Enable Advanced Peak Determination and use EASY-IC RunStart mode for Orbitrap lock-mass correction.
- Set the EASY-Spray ion source spray voltage to 2,000 V and the column temperature to 50°C.
- Set the FAIMS total carrier gas flow to 3.8 L/min and the compensation voltage to −48 V.
- Set the ion transfer tube temperature to 280°C.
- Acquire full MS scans in the Orbitrap over a range of 380–980 m/z at a resolution of 240,000. Set the RF lens to 40%, the normalized automatic gain control target to 500%, and the maximum injection time to 3 ms. Acquire the data in profile mode.
- Perform data-independent acquisition using the Astral analyzer with the DIA window type set to Auto and a coverage range of 380–980 m/z.
- Use non-overlapping isolation windows of 3 m/z with Window Placement Optimization and 200 scan events.
- Set the higher-energy collisional dissociation normalized collision energy to 25%, the Astral scan range to 150–2,000 m/z, the RF lens to 40%, and the normalized automatic gain control target to 500%.
- Enable pre-accumulation, set the maximum injection time to 7 ms, set the loop control to 0.6 s, and acquire the DIA data in centroid mode.
- Spectronaut processing and database searching
- Process the raw files using Spectronaut version 21.0.260609.94842 (Lovell) Enterprise (x64) with the directDIA workflow.
- In the Pulsar search settings, specify Trypsin/P as the enzyme, permit peptide lengths of 7–52 amino acids, and allow up to two missed cleavages.
- Search against the human one-gene-one-protein database version 202601 containing 20,659 entries, the bovine one-gene-one-protein database version 202601 containing 20,666 entries, and the Trypsin and Lys-C protein sequences.
- Specify carbamidomethylation of cysteine as a fixed modification.
- Specify protein N-terminal acetylation, deamidation with 18O on asparagine, oxidation of methionine, oxidation of proline, and oxidation of lysine as variable modifications.
- For DIA analysis, set the experiment-level precursor and protein q-value cutoffs to 0.01.
- Quantify proteins using MS2 peak area with cross-run normalization.
- Export PG.Quantity values for subsequent statistical analysis.
- Quantitative and statistical analysis
- Remove non-human proteins and proteins with PG.Qvalue values greater than or equal to 0.01.
- Remove proteins lacking a UniProt identifier-to-gene mapping.
- For proteins detected in more than 80% of samples in one extraction group, in less than 70% of samples overall, and in less than 50% of samples in the other extraction group, replace missing values with 20% of the minimum observed abundance for that protein before Log₂ transformation.
- For the remaining proteins detected in at least 70% of samples overall, perform k-nearest neighbor imputation with k = 5 after Log₂ transformation.
- Perform differential protein abundance analysis using the R limma package on the Log₂-transformed and imputed protein abundance matrix.
- Fit a paired linear model that includes donor as a blocking factor and extraction group, TLB or GuHCl, as the experimental variable of interest.
- Apply empirical Bayes moderation to improve variance estimation across proteins.
- Compare the GuHCl fraction with the TLB fraction and report Log₂ fold changes, moderated t-statistics, P values, false discovery rate-adjusted P values, and 95% confidence intervals.
- Annotate identified and quantified proteins using the core matrisome classification applied in the accompanying supplementary dataset.
- Treatment of scaffold- and reagent-derived proteins
- Include both human and bovine protein databases during database searching to distinguish human proteins from bovine reagent-derived proteins.
- Map peptides derived from bovine thrombin and bovine aprotinin to the bovine database. Remove these proteins from the final human dataset during the exclusion of non-human proteins.
- Retain human fibrinogen α, β, and γ chain proteins, FGA, FGB, and FGG, when detected in the human database because the fibrinogen scaffold is derived from human plasma.
- Interpret enrichment of FGA, FGB, and FGG in the GuHCl fraction as evidence of retained fibrin scaffold components rather than newly synthesized cell-derived ECM. Consider these scaffold-derived proteins separately from cell-derived ECM proteins, including collagens, during biological interpretation.
תוצאות
In vivo, except in avascular tissues, cells exchange nutrients with nearby capillaries located no more than 100–150 µm away23. Similarly, in vitro, the balance between nutrient consumption by peripheral cells and diffusion into the tissue is such that only cells within approximately 200 µm of the surface of an avascular engineered tissue are considered to receive an adequate nutrient supply24. Given that EVTs generally have widths of up to 1 mm, cells at the center of the tissue may experience reduced oxygen and nutrient availability relative to cells at the periphery because of diffusion limitations. Although oxygen availability may decrease toward the center of the tissue, EVTs are cultured under atmospheric oxygen conditions, and reduced oxygen diffusion toward the core does not necessarily indicate true hypoxia.
To assess how long human aortic SMCs remain viable in EVTs, we performed a TUNEL assay on transverse cryosections using fluorescein-dUTP. We consistently observed <10% TUNEL-positive cells in EVTs cultured for 3 days, which was the threshold used to define viable EVTs. This assay can also be used to monitor apoptosis following experimental perturbations. For example, we previously used TUNEL staining to assess cell death in EVTs cultured under calcifying conditions21.
Based on these findings, a 3-day culture period was selected for subsequent experiments. The EVT casting workflow is illustrated in Figure 1A, and representative EVTs after 1 day of culture are shown in Figure 1B. By day 3, EVTs exhibited aligned SMCs spanning the PDMS posts (Figure 1C) together with widespread deposition of type I collagen (COL1A1/2) and fibronectin (FN1) throughout the constructs (Figure 1D).
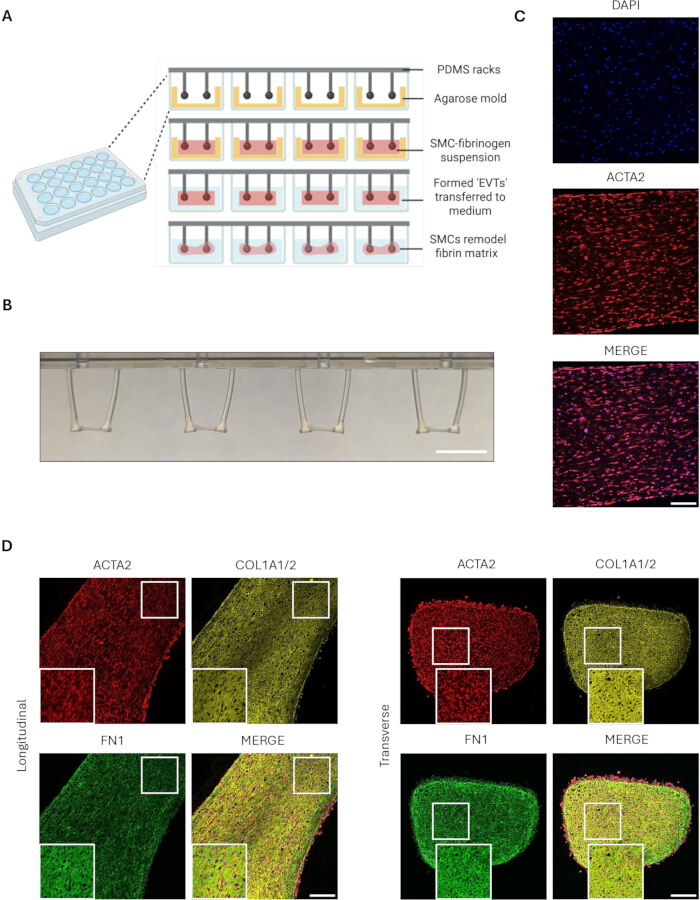
Figure 1. Casting and immunofluorescence staining of engineered vascular tissues. (A) Schematic overview of the EVT casting process. (B) Representative photograph of a rack of EVTs after 1 day of culture. (C) Representative fluorescence images of human smooth muscle cells within a longitudinal EVT section (10×). Blue = DAPI; red = smooth muscle alpha-actin (ACTA2). The merged image is shown at the bottom. (D) Representative fluorescence images of human smooth muscle cells and surrounding extracellular matrix within longitudinal and transverse EVT sections (10×). Blue = DAPI; red = smooth muscle alpha-actin (ACTA2); yellow = type I collagen (COL1A1/2); green = fibronectin (FN1). Merged images are shown in the bottom right. Insets (white boxes) show corresponding 40× magnified regions. Scale bars = 10 mm (B) and 200 µm (C,D). Panel A was created in BioRender. Duregotti, E. (2026) https://BioRender.com/cz4krdr. Please click here to view a larger version of this figure.
We next examined the composition of the de novo ECM deposited within EVTs after 3 days of culture using proteomics. To this end, we employed a sequential protein extraction workflow (Step 7 and Figure 2A) designed to isolate fractions enriched for soluble extracellular and intracellular proteins (TLB) and less soluble, highly crosslinked ECM proteins (GuHCl). The TLB extraction period was extended to 24 h to demonstrate that a proportion of the ECM was not readily soluble and had already become integrated into the developing matrix. In general, however, shorter TLB extraction periods are recommended to minimize the loss of ECM components.
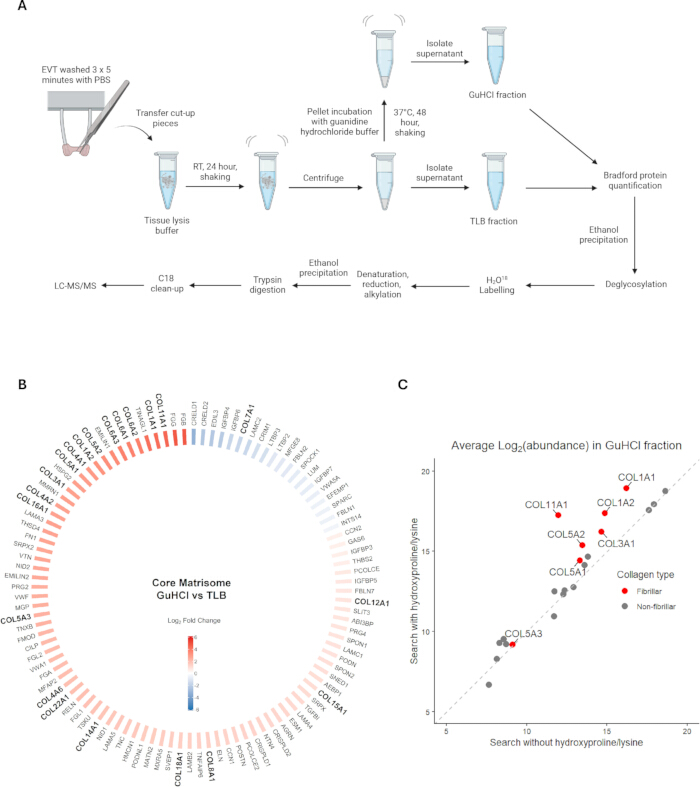
Figure 2. Proteomic profiling of engineered vascular tissues. (A) Schematic overview of the sequential protein extraction workflow used to isolate tissue lysis buffer (TLB) and guanidine hydrochloride (GuHCl) fractions from EVTs, followed by protein processing and liquid chromatography–tandem mass spectrometry (LC-MS/MS). (B) Circular heatmap showing Log₂ fold changes for core matrisome proteins comparing paired GuHCl and TLB fractions from human aortic smooth muscle cell donors (n = 7). Positive values (red) indicate enrichment in the GuHCl fraction, whereas negative values (blue) indicate enrichment in the TLB fraction. Only proteins belonging to the NABA Core Matrisome gene set with an adjusted P < 0.05 (limma analysis) are shown. Collagen family members (COL) are highlighted in bold. (C) Comparison of average Log₂ abundance for fibrillar (red) and non-fibrillar (grey) collagens in the GuHCl fraction following database searches performed with or without hydroxyproline and hydroxylysine variable modifications (n = 7 donors). Panel A was created in BioRender. Duregotti, E. (2026) https://BioRender.com/dkeyebj. Please click here to view a larger version of this figure.
Proteomic analysis of EVTs from seven human donors by liquid chromatography–tandem mass spectrometry with data-independent acquisition (Figure 2A) revealed enrichment of several collagen family members (COL) in the GuHCl fraction after 3 days of culture, together with regulators of collagen fibrillogenesis, including FMOD, PCOLCE, and PCOLCE2 (Figure 2B). The complete differential protein abundance dataset, including statistical analyses and core matrisome annotations, is provided in Supplementary Table 1. Conversely, more readily soluble SMC-secreted proteins, including MFGE8 and EDIL3, were more abundant in the TLB fraction, consistent with enrichment of the expected protein components in the sequentially extracted fractions.
Fibrillar collagens are characterized by a high hydroxyproline content that stabilizes their continuous triple-helical domains and promotes their assembly into large, cable-like fibrils. Consistent with this biology, detection of fibrillar collagens in the GuHCl fraction was sensitive to the inclusion of hydroxyproline and hydroxylysine as variable modifications during database searching (Figure 2C). In contrast, the measured abundance of non-fibrillar collagens was largely unchanged irrespective of whether these modifications were included, providing confidence that their identification was not driven by modification-dependent false-positive peptide assignments.
In addition to collagens, several basement membrane glycoproteins were enriched in the GuHCl fraction after 3 days of culture, including laminin (LAMA/B/C) subunits, nidogens (NID1 and NID2), and the heparan sulfate proteoglycans perlecan (HSPG2) and agrin (AGRN), demonstrating the presence of a diverse ECM within EVTs. Elastin (ELN), together with proteins involved in fibrillin-1 (FBN1) microfibril assembly (THSD4) and elastin deposition (MFAP2, EMILIN1, and EMILIN2), was also significantly enriched in the GuHCl fraction. Although FBN1 was enriched (Log2 fold change = 1.84), it did not reach statistical significance (adjusted P = 0.051). We previously demonstrated that TGF-β1 treatment induces elastin expression in murine EVTs21; therefore, a similar strategy may be used to further stimulate elastic matrix deposition in human EVTs.
Representative Western blot analysis demonstrated the presence of the SMC cytoskeletal protein transgelin (TAGLN) in both the TLB and GuHCl fractions, with stronger detection in the TLB fraction (Figure 3A). This finding suggests incomplete extraction of intracellular proteins by TLB, even after a 24 h incubation, potentially because cellular remnants remain trapped within the crosslinked ECM and are subsequently extracted using the more stringent GuHCl buffer. FN1, an ECM glycoprotein involved in the deposition of other matrix proteins, and the chondroitin sulfate proteoglycan versican (VCAN) were also detected in both fractions (Figure 3A). Consistent with the proteomic analysis (Figure 2B), FN1 showed a modest enrichment in the GuHCl fraction. The distribution of FN1 and VCAN across both fractions likely reflects the presence of both readily soluble and more tightly matrix-associated forms within EVTs.
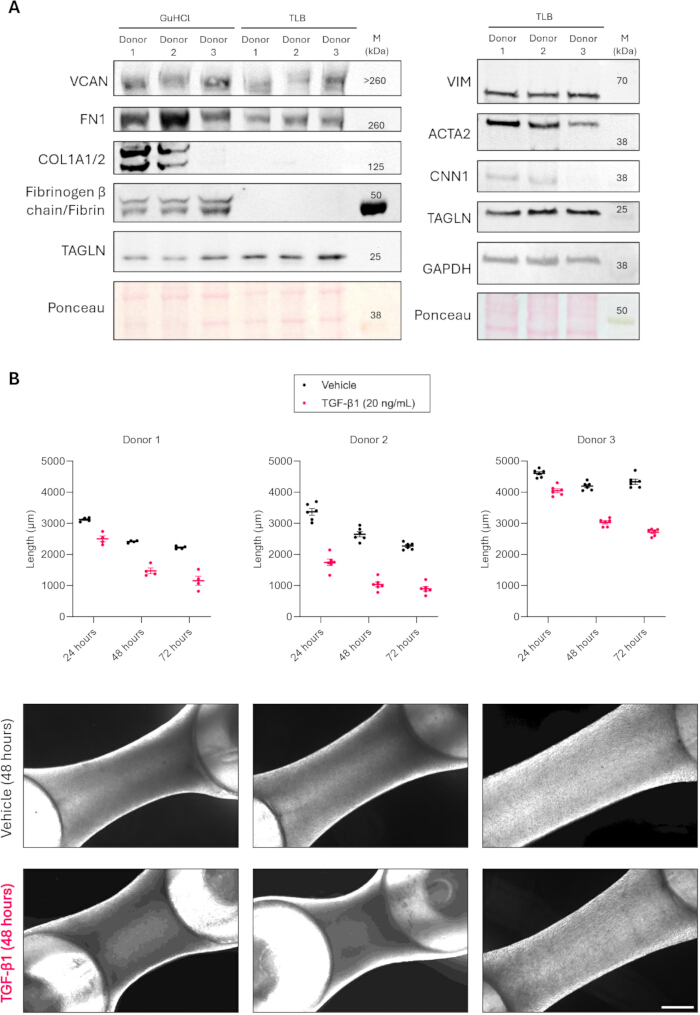
Figure 3. Analysis of engineered vascular tissue contraction and smooth muscle marker expression. (A) Left: Representative Western blot analysis of transgelin (TAGLN), type I collagen (COL1A1/2), fibronectin (FN1), versican (VCAN), and fibrinogen β chain/fibrin in paired GuHCl and TLB fractions from three representative human aortic smooth muscle cell donors (Donors 1–3). Ponceau S staining is shown as a loading control. Right: Western blot analysis of the corresponding TLB fractions probed for vimentin (VIM) and the smooth muscle cell markers TAGLN, smooth muscle alpha-actin (ACTA2), and calponin-1 (CNN1). GAPDH and Ponceau S staining are shown as loading controls. (B) Quantification of EVT contraction after 24, 48, and 72 h of culture under baseline (Vehicle, black) conditions or in the presence of TGF-β1 (20 ng/mL, pink). EVT length was measured from darkfield images using ImageJ. Data are shown for three representative human aortic smooth muscle cell donors corresponding to panel A (Donors 1–3). Individual data points represent technical replicates, and bars indicate the mean ± standard error of the mean (SEM). Representative darkfield images acquired after 48 h of culture using a 4× objective are shown below each graph. Scale bar = 500 µm. Please click here to view a larger version of this figure.
In contrast, the abundant ECM component type I collagen (COL1A1/2) was detected exclusively in the GuHCl fraction (Figure 3A). In addition to de novo ECM proteins, remnants of fibrinogen β chain and the fibrin scaffold were also detected exclusively in the GuHCl fraction (Figure 3A). Protein abundance varied among extracts from three representative donors, with fibrinogen β chain/fibrin showing an inverse relationship with collagen and fibronectin abundance. These findings demonstrate that the sequential extraction approach can be used to qualitatively assess differences in de novo ECM production among SMC donors. We previously demonstrated that deposition of space-filling proteoglycans characterizes the early ECM response in EVTs, followed by increased collagen deposition21.
In addition to differences in ECM production among SMC donors, variation in contractile marker abundance (ACTA2 and CNN1) and the degree of tissue contraction during culture was also observed (Figure 3A,B). Donor 3, which exhibited lower COL1A1/2, ACTA2, and CNN1 abundance than the other donors, also showed reduced contraction under baseline conditions (Figure 3B). Upon stimulation with TGF-β1, contraction increased to levels comparable to those observed in the other donors under baseline conditions. These findings illustrate the donor-to-donor variability in matrix production, contractile phenotype, and tissue contraction that may be observed using this method. They also demonstrate the enhanced contraction induced by TGF-β1 treatment, consistent with our previous findings in murine EVTs21. Variability among technical replicates for each primary donor was minimal (Figure 3B), indicating good reproducibility of the EVT casting protocol.
The mass spectrometry proteomics data generated in this study have been deposited to the ProteomeXchange Consortium via the PRIDE partner repository under accession number PXD080642. The complete processed quantitative proteomics dataset, including statistical analyses and core matrisome annotations, is provided in Supplementary Table 1.
Supplementary Table 1. Complete quantitative proteomic analysis of engineered vascular tissues (EVTs) following sequential extraction. Differential protein abundance between the guanidine hydrochloride (GuHCl) and tissue lysis buffer (TLB) fractions was determined by liquid chromatography–tandem mass spectrometry with data-independent acquisition. The table includes gene names, log₂ fold changes (GuHCl vs. TLB), 95% confidence intervals, mean protein abundance, moderated t-statistics, P-values, false discovery rate (FDR)-adjusted P-values, B statistics, –log₁₀(P) values, –log₁₀(FDR) values, and core matrisome annotations. Please click here to download this file.
דיון
This protocol describes the generation of EVTs21 adapted from previously published EHTs17. Within EVTs, primary human aortic SMCs remain viable and produce a diverse, collagen-rich ECM. Following quality control assessment of apoptotic cell death, these tissues can be processed efficiently for detailed analysis of de novo ECM production using mass spectrometry-based proteomics. Together, these methods establish EVTs as a practical platform for investigating cell–ECM interactions and ECM remodeling in vascular biology.
Our model differs from the original EHT protocol by using human rather than bovine fibrinogen, thereby reducing reliance on animal-derived reagents. Notably, the human fibrinogen preparation did not dissolve at the previously reported concentration of 200 mg/mL17. Therefore, the fibrinogen was reconstituted at a reduced concentration of 100 mg/mL, while the volume used in the EVT master mix was doubled. To compensate for the resulting dilution of culture medium components, complete 3× DMEM was incorporated into the EVT master mix.
In our experience, a fibrinogen concentration of 100 mg/mL is substantially easier to handle; however, several steps of the protocol are critical for successful EVT generation. When combining the EVT master mix with thrombin, the suspension should be mixed only twice because excessive mixing may result in premature fibrin polymerization and clot formation within the pipette tip. Rapid handling and the use of a fresh pipette tip for each EVT are therefore recommended. Following casting, the incubation period after addition of culture medium is another critical step because it facilitates release of the suspended EVTs from the agarose molds. Omitting this incubation frequently results in tissue detachment from the PDMS posts because of friction between the EVT and the agarose mold.
We routinely prepare EVTs using 550,000 primary human aortic SMCs per construct and have found this cell number suitable for capturing donor-dependent differences in ECM production and tissue contraction. However, optimization may be required when using other primary SMC populations or iPSC-derived SMCs. In the present study, EVTs cultured for 3 days consistently contained fewer than 10% TUNEL-positive cells, supporting the use of this culture period for downstream analyses while maintaining tissue viability.
A major advantage of this method is that it combines a relatively simple and scalable three-dimensional culture system with downstream histological, biochemical, and proteomic analyses. Unlike more technically demanding tissue-engineering approaches, EVTs can be generated without specialized fabrication equipment while still supporting de novo ECM deposition and tissue contraction. During proteomic analysis, inclusion of both human and bovine protein databases enabled discrimination of human ECM proteins from bovine reagent-derived proteins, whereas retained human fibrinogen chains were interpreted as scaffold-derived components rather than newly synthesized ECM. These considerations are important when interpreting ECM composition in fibrin-based engineered tissues.
Overall, EVTs provide a practical platform for studying SMC behavior, ECM production, and donor-dependent variability in vascular tissue remodeling. Potential applications include mechanistic studies of vascular disease, investigation of ECM-regulatory pathways, evaluation of patient- or donor-specific phenotypes, and assessment of therapeutic interventions that influence vascular ECM composition and organization.
גילויים
The authors declare no conflicts of interest.
תודות
B.A.S.M. is funded by a BHF–NC3Rs Joint PhD Studentship Award (NC/X001660/1). M.M. is a British Heart Foundation (BHF) Chair Holder and is supported by a BHF Programme Grant (CH/16/3/32406; RG/F/21/110053). M.M. is also supported by the Foundation Leducq (Demystifying Fibromuscular Dysplasia, 25CVD02) and by the Excellence Initiative VASCage (Centre for Promoting Vascular Health in the Ageing Community; project number 868624) of the Austrian Research Promotion Agency (FFG) through the COMET Programme (Competence Centers for Excellent Technologies), funded by the Austrian Federal Ministry for Climate Action, Environment, Energy, Mobility, Innovation and Technology; the Austrian Federal Ministry for Labour and Economy; and the federal states of Tyrol (via Standortagentur Tirol), Salzburg, and Vienna (via the Vienna Business Agency). M.M. is further supported by the Imperial BHF Research Excellence Award (RE/24/130023) and a BHF–NC3Rs Partnership and Impact Award (UKRI674: Accelerate Adoption of Engineered Vascular Tissues with Induced Pluripotent Stem Cell-Derived Smooth Muscle Cells).
The authors thank Dr. Honglin Chen and Mr. Austin Punnoose (Imperial College London) for technical support with mass spectrometry.
חומרים
| שם | חברה | מספר קטלוג | הערות |
|---|---|---|---|
| Aprotinin | Sigma-Aldrich | A1153-10MG | Fibrinolysis inhibitor used in fibrin hydrogel preparation and as a supplement during EVT culture |
| Fibrinogen from human plasma | Sigma-Aldrich | F4883-500MG | Scaffold component for EVT fabrication |
| Bovine thrombin | Sigma-Aldrich | 605157-1KU | Fibrin polymerization |
| Sodium chloride | Sigma-Aldrich | S9888-1KG | Used for fibrinogen resuspension. Tissue lysis buffer component. Deglycosylation buffer component |
| DPBS, without calcium and magnesium | Thermo Fisher Scientific | 15326239 | Cell washing and reagent preparation |
| Smooth Muscle Cell Growth Medium 2 | PromoCell | C-22062 | Growth and maintenance of human aortic SMCs |
| Penicillin-Streptomycin (10,000 U/mL) | Thermo Fisher Scientific | 11548876 | Antibiotic supplement |
| Trypsin-EDTA (0.05%), phenol red | Thermo Fisher Scientific | 25300054 | Cell detachment |
| Silicon Rack | DiNABIOS | C0001 | PDMS rack used for EVT casting |
| PTFE Spacer | DiNABIOS | C0002 | Mold-forming spacer used during casting |
| Cell culture multiwell plate, 24-well | Greiner Bio-One | 662160 | EVT casting and culture |
| DMEM powder, high glucose | Thermo Fisher Scientific | 52100021 | Preparation of 10× DMEM |
| Fetal bovine serum | Sigma-Aldrich | F9665-500ML | Cell culture supplement |
| GlutaMAX Supplement | Thermo Fisher Scientific | 35050061 | Cell culture supplement |
| Millex Syringe Filter, PES, 0.22 µm | Merck | 10509952 | Sterile filtration |
| UltraPure Agarose | Thermo Fisher Scientific | 16500500 | Agarose mold preparation |
| DMIL Fluorescence for Fluorescence Cell Culture with Documentation | Leica | 11521265 | Imaging of EVT contraction |
| Formalin solution, neutral buffered, 10% | Sigma-Aldrich | HT501128-4L | Tissue fixation |
| Eppendorf MixMate Mixer without Tube Holders | Scientific Laboratory Supplies | E5353000537 | EVT incubation in formalin |
| Sucrose | Sigma-Aldrich | S0389-500G | Cryoprotection prior to cryo-embedding |
| appROCK Orbital Shaker | Appleton Woods | AER0003 | EVT incubation in OCT/sucrose |
| OCT Embedding Matrix | CellPath | KMA-0100-00A | Cryo-embedding medium |
| Tissue-Tek Cryo-Mold, Intermediate 15 × 15 × 5 mm | Electron Microscopy Sciences | 62534-15 | Cryo-embedding mold |
| 2-Methylbutane | Sigma-Aldrich | 277258-1L | Rapid freezing of cryoblocks |
| CryoStar NX70 Cryostat | Scientific Laboratory Supplies | HIS3116 | Cryosectioning |
| Epredia SuperFrost Plus Adhesion Slides | Thermo Fisher Scientific | 10149870 | Tissue section mounting |
| Ethyl alcohol, pure | Sigma-Aldrich | 459844 | Tissue dehydration and protein precipitation |
| Xylenes | Sigma-Aldrich | 534056-4L | Paraffin processing |
| Paraffin wax | Sigma-Aldrich | 327204-1KG | Paraffin embedding |
| CellPath System III Biopsy Cassette | Thermo Fisher Scientific | 30226237 | Paraffin embedding |
| Leica Biosystems HistoCore MULTICUT Semi-Automated Rotary Microtome with Universal Cassette Clamp and 2-in-1 Blade Holder | Scientific Laboratory Supplies | HIS2304 | Paraffin sectioning |
| Triton X-100 | Sigma-Aldrich | X100-100ML | Tissue permeabilization and tissue lysis buffer component |
| RNase-Free DNase Set (50) | Qiagen | 79254 | Positive control for TUNEL assay |
| In Situ Cell Death Detection Kit, Fluorescein | Roche | 11684795910 | TUNEL assay |
| DAPI | Sigma-Aldrich | D9542-1MG | Nuclear counterstain |
| Invitrogen Fluoromount-G Mounting Medium | Thermo Fisher Scientific | 15586276 | Coverslip mounting |
| SP8 LIGHTNING confocal microscope | Leica | 12616gg | EVT section immunofluorescence imaging |
| Ammonium Chloride, ACS Reagent, Honeywell Fluka | Thermo Fisher Scientific | 15651960 | EVT immunostaining |
| Glycine | Sigma-Aldrich | G7126-100G | EVT immunostaining |
| Donkey serum | Sigma-Aldrich | D9663-10ML | EVT immunostaining |
| Rabbit anti-fibronectin antibody | Abcam | ab2413 | Western blot (1:1000); Immunofluorescence staining (1:100) |
| Goat anti-type I collagen antibody | SouthernBiotech | 1310-01 | Western blot (1:500); Immunofluorescence staining (1:100) |
| Mouse anti-ACTA2 antibody | R&D Systems | MAB1420 | Western blot (1:500); Immunofluorescence staining (1:100) |
| Rabbit IgG, Control Antibody | Vector Labs | I-1000-5 | Immunofluorescence staining |
| Mouse IgG, Control Antibody | Vector Labs | I-2000-1 | Immunofluorescence staining |
| Goat IgG, Control Antibody | Vector Labs | I-5000-5 | Immunofluorescence staining |
| Donkey anti-Rabbit IgG (H+L) Highly Cross-Adsorbed Secondary Antibody, Alexa Fluor 488 | Thermo Fisher Scientific | A-21206 | Immunofluorescence staining (1:200) |
| Donkey anti-Goat IgG (H+L) Cross-Adsorbed Secondary Antibody, Alexa Fluor 555 | Thermo Fisher Scientific | A-21432 | Immunofluorescence staining (1:200) |
| Donkey anti-Mouse IgG (H+L) Highly Cross-Adsorbed Secondary Antibody, Alexa Fluor 647 | Thermo Fisher Scientific | A-31571 | Immunofluorescence staining (1:200) |
| Tris hydrochloride | Roche | 10812846001 | Tissue lysis buffer component |
| Ethylenediaminetetraacetic acid disodium salt dihydrate | Sigma-Aldrich | E5134 | Tissue lysis buffer/GuHCl extraction buffer component. Deglycosylation buffer component |
| Ethylene glycol-bis(2-aminoethylether)-N,N,N',N'-tetraacetic acid | Sigma-Aldrich | 3777 | Tissue lysis buffer component |
| Sodium dodecyl sulfate | Sigma-Aldrich | L4509 | Tissue lysis buffer component |
| Guanidine hydrochloride | Sigma-Aldrich | G3272 | GuHCl extraction buffer component |
| Sodium acetate | Sigma-Aldrich | S7545 | GuHCl extraction buffer component. Deglycosylation buffer component |
| cOmplete Mini EDTA-free Protease Inhibitor Cocktail | Roche | 11836170001 | Protease inhibition |
| PhosSTOP | Roche | 4906845001 | Phosphatase inhibition |
| Vannas-type micro scissors | Agar Scientific | AGT5228 | Tissue dissection |
| BenchMixer XL Multi-Tube Vortexer | Benchmark Scientific | BV1010 | Tissue lysis buffer incubation |
| Eppendorf ThermoMixer F2.0 | Sigma-Aldrich | EP5387000030-1EA | GuHCl extraction buffer incubation. Deglycosylation buffer incubation. Trypsin digestion incubation |
| Eppendorf ThermoTop | Eppendorf | 5308000003 | GuHCl extraction buffer incubation. Deglycosylation buffer incubation. Trypsin digestion incubation |
| Quick Start Bradford Protein Assay Kit 1 | Bio-Rad | 5000201 | Protein quantification |
| Labconco Acid Resistant CentriVap Pro | Thermo Fisher Scientific | 30533456 | Vacuum concentrator |
| Glycoprotein Deglycosylation Kit | Sigma-Aldrich | 362280-1KIT | Protein deglycosylation |
| Chondroitinase ABC from Proteus vulgaris | Sigma-Aldrich | C3667-5UN | Protein deglycosylation |
| Heparinase II from Flavobacterium heparinum | Sigma-Aldrich | H6512-10UN | Protein deglycosylation |
| Endo-β-galactosidase from Bacteroides fragilis | Sigma-Aldrich | G6920-.5UN | Protein deglycosylation |
| Rabbit anti-versican antibody | Abcam | ab270444 | Western blot (1:500) |
| Mouse anti-fibrin antibody | Sigma-Aldrich | MABS2155 | Western blot (1:1000) |
| Rabbit anti-transgelin antibody | Abcam | ab14106 | Western blot (1:1000) |
| Mouse anti-vimentin antibody | Abcam | ab8069 | Western blot (1:1000) |
| Rabbit anti-calponin-1 antibody | Abcam | ab46794 | Western blot (1:1000) |
| Rabbit anti-GAPDH antibody | CST | 2118 | Western blot (1:1000) |
| IRDye 800CW/680RD Donkey Anti-Rabbit IgG | LI-COR Biosciences | 926-32213; 926-68073 | Western blot (1:10,000) |
| IRDye 800CW/680RD Donkey Anti-Mouse IgG | LI-COR Biosciences | 926-32212; 926-68072 | Western blot (1:10,000) |
| IRDye 800CW/680RD Donkey Anti-Goat IgG | LI-COR Biosciences | 926-32214; 926-68074 | Western blot (1:10,000) |
| Water (H218O) | Sigma-Aldrich | 329878-20G | Protein deglycosylation |
| EPPS | Sigma-Aldrich | E0276-100G | Protein denaturation |
| Urea | Sigma-Aldrich | U5128-100G | Protein denaturation |
| Thiourea | Sigma-Aldrich | T8656-100G | Protein denaturation |
| DL-Dithiothreitol | Sigma-Aldrich | D0632-100G | Protein reduction |
| Iodoacetamide | Sigma-Aldrich | I1149-100G | Protein alkylation |
| Triethylammonium bicarbonate (TEAB) buffer | Sigma-Aldrich | T7408-100ML | Trypsin digestion |
| Trypsin/Lys-C Mix, Mass Spec Grade | Promega | V5071 | Trypsin digestion |
| Acetic Acid, Optima LC/MS Grade, Fisher Chemical | Thermo Fisher Scientific | 10860701 | Trypsin digestion |
| Trifluoroacetic Acid, Optima LC/MS Grade, Fisher Chemical | Thermo Fisher Scientific | 10723857 | Trypsin digestion stop solution and C18 clean-up |
| MICROPLATE, 96 WELL, PP, U-BOTTOM, NATURAL | Greiner | 650201 | C18 clean-up sample loading plate |
| Acetonitrile, LC-MS Grade, 99.8% | Thermo Fisher Scientific | 15492857 | C18 clean-up and LC-MS/MS |
| Reservoir, 12 column, polypropylene | Agilent | 201280-100 | C18 clean-up buffer reservoir |
| 96 WELL PLATE, 5.6MM RND, TOTAL V, 100UL | Thermo Fisher Scientific | 17759598 | C18 clean-up collection plate |
| C18 cartridges | Agilent | 5190-6532 | C18 clean-up |
| AssayMAP Bravo Protein Sample Prep Platform | Agilent | G5571AA | C18 clean-up |
| Formic Acid, 99.0+%, Optima LC/MS Grade, Fisher Chemical | Thermo Fisher Scientific | 10780320 | Peptide resuspension solution and LC-MS/MS |
| Vanquish Neo UHPLC System | Thermo Fisher Scientific | VN-S10-A-01 and 6036.1180 (Vanquish Display) | LC-MS/MS |
| EASYSPRAY PEPMAP RSLC C18 2UM 15CMX150UM | Thermo Fisher Scientific | ES906 | LC-MS/MS |
| PepMap Neo Trap Cartridge, 174500, 0.3mm x 5mm | Thermo Fisher Scientific | 17417583 | LC-MS/MS |
| Orbitrap Astral Zoom Mass Spectrometer | Thermo Fisher Scientific | BRE725700 | LC-MS/MS |
מקורות
- van der Velden J, et al. Animal models and animal-free innovations for cardiovascular research: current status and routes to be explored. Consensus document of the ESC Working Group on Myocardial Function and the ESC Working Group on Cellular Biology of the Heart. Cardiovasc Res. 2022;118(15):3016-3051.
- Figtree GA, et al. A call to action for new global approaches to cardiovascular disease drug solutions. Circulation. 2021;144(2):159-169.
- Zhang L, Zhou J, Kong W. Extracellular matrix in vascular homeostasis and disease. Nat Rev Cardiol. 2025;22(5):333-353.
- Jensen LF, Bentzon JF, Albarrán-Juárez J. The phenotypic responses of vascular smooth muscle cells exposed to mechanical cues. Cells. 2021;10(9):2209.
- Hynes RO, Naba A. Overview of the matrisome—an inventory of extracellular matrix constituents and functions. Cold Spring Harb Perspect Biol. 2012;4(1):a004903.
- Barallobre-Barreiro J, et al. Extracellular matrix in vascular disease, Part 2/4: JACC focus seminar. J Am Coll Cardiol. 2020;75(17):2189-2203.
- Iozzo RV, Schaefer L. Proteoglycan form and function: a comprehensive nomenclature of proteoglycans. Matrix Biol. 2015;42:11-55.
- Weinberg CB, Bell E. A blood vessel model constructed from collagen and cultured vascular cells. Science. 1986;231(4736):397-400.
- Ryan AJ, Ryan EJ, Cameron AR, O’Brien FJ. Hierarchical biofabrication of biomimetic collagen-elastin vascular grafts with controllable properties via lyophilisation. Acta Biomater. 2020;112:52-61.
- Ma W, et al. Fabric-enhanced vascular graft with hierarchical structure for promoting the regeneration of vascular tissue. Adv Healthc Mater. 2024;13(16):e2302676.
- Ding Z, et al. Biomimetic vascular grafts with circumferentially and axially oriented microporous structures for native blood vessel regeneration. Adv Funct Mater. 2024;34(1).
- Luo J, et al. Tissue-engineered vascular grafts with advanced mechanical strength from human iPSCs. Cell Stem Cell. 2020;26(2):251-261.e8.
- Guo X, et al. Facile preparation of a controlled-release tubular scaffold for blood vessel implantation. J Colloid Interface Sci. 2019;539:351-360.
- Fernández-Pérez J, et al. Flexible, suturable, and leak-free scaffolds for vascular tissue engineering using melt spinning. ACS Biomater Sci Eng. 2023;9(8):5006-5014.
- Yu Y, et al. Vascular network-inspired fluidic system (VasFluidics) with spatially functionalizable membranous walls. Nat Commun. 2024;15(1):1437.
- Lee H. Engineering in vitro models: bioprinting of organoids with artificial intelligence. Cyborg Bionic Syst. 2023;4:0018.
- Breckwoldt K, et al. Differentiation of cardiomyocytes and generation of human engineered heart tissue. Nat Protoc. 2017;12(6):1177-1197.
- Lemme M, et al. Atrial-like engineered heart tissue: an in vitro model of the human atrium. Stem Cell Rep. 2018;11(6):1378-1390.
- Saleem U, et al. Force and calcium transients analysis in human engineered heart tissues reveals positive force-frequency relation at physiological frequency. Stem Cell Rep. 2020;14(2):312-324.
- Ismaili D, et al. Regulation of APD and force by the Na+/Ca2+ exchanger in human-induced pluripotent stem cell-derived engineered heart tissue. Cells. 2022;11(15):2424.
- Reed E, et al. Extracellular matrix profiling and disease modelling in engineered vascular smooth muscle cell tissues. Matrix Biol Plus. 2022;16:100122.
- Fellows AL, et al. Engineered pulmonary artery tissues for measuring contractility, drug testing and disease modelling. Br J Pharmacol. 2025;182(12):2585-2602.
- Augustin HG, Koh GY. A systems view of the vascular endothelium in health and disease. Cell. 2024;187(18):4833-4858.
- Rouwkema J, et al. Supply of nutrients to cells in engineered tissues. Biotechnol Genet Eng Rev. 2009;26(1):163-178.
הדפסות חוזרות והרשאות
מאמר זה פורסם
הסרטון יגיע בקרוב