This protocol describes the isolation of naïve CD4⁺ T cells from mouse spleen, exposure to Licochalcone A under Th17-skewing conditions, and assessment of Th17 differentiation via flow cytometry. This workflow provides a reliable platform for studying immunomodulatory effects of natural compounds in Th17-related diseases.
מאמר שיטה
A Magnetic Bead-Based Negative Selection and Flow Cytometry Protocol for Evaluating Licochalcone A-Mediated Inhibition of Murine Th17 Differentiation
* These authors contributed equally
במאמר זה
סיכום
תקציר
Naïve CD4⁺ T cell differentiation into Th17 cells is a key driver of autoimmune and chronic inflammatory skin diseases. Licochalcone A (Lico-A), a bioactive flavonoid from Glycyrrhiza inflata, exhibits anti-inflammatory activity in dermatological applications, yet its direct effect on Th17 commitment remains poorly characterized due to a lack of standardized evaluation protocols. To address this, this protocol establishes a complete in vitro workflow to assess Lico-A's inhibition of naïve CD4⁺ T cell differentiation into Th17 cells. The procedure comprises: isolation of highly pure naïve CD4⁺ T cells from mouse spleens via magnetic bead-based negative selection (>90% purity); induction of Th17 polarization under anti-CD3/CD28 costimulation with a defined cytokine cocktail (TGF-β, IL-6, IL-1β, IL-23, and IL-2, supplemented with anti-IL-4 and anti-IFN-γ); treatment with 500 nM Lico-A throughout the 72-hour polarization period; and quantification of differentiation efficiency by intracellular IL-17A staining followed by flow cytometric analysis. Critical controls, including parallel cell viability staining, are incorporated to distinguish specific inhibition of differentiation from nonspecific cytotoxicity. In a representative experiment, Lico-A reduced the proportion of CD4⁺IL-17A⁺ cells from 45.8% to 11.5% without compromising cell viability. This standardized protocol offers a reproducible platform for screening immunomodulatory compounds and investigating their mechanisms in Th17-associated inflammatory skin diseases. However, disease-relevant therapeutic effects require validation in appropriate in vivo animal models.
מבוא
The balance of CD4⁺ helper T (Th) cell subsets is fundamental to immune system homeostasis1,2. Among these, Th17 cells, which produce the signature cytokine interleukin-17A (IL-17A), represent a pro-inflammatory T helper cell subset3. They not only play a critical role in the host’s defense against extracellular pathogens but also drive pathogenic inflammation in autoimmune disorders such as multiple sclerosis and rheumatoid arthritis4,5,6. Th17 differentiation is orchestrated by a defined cytokine milieu, predominantly involving transforming growth factor-β (TGF-β), IL-6, and IL-23, which act through the signal transducer and activator of transcription 3 (STAT3)-retinoid-related orphan receptor γt (RORγt)/retinoid-related orphan receptor α signaling cascade to upregulate IL-17A and IL-17F production7,8.
In dermatology, the relevance of Th17 cells has gained substantial recognition. Beyond their established involvement in psoriasis pathogenesis, emerging evidence implicates Th17 cells in the immune networks underlying atopic dermatitis (AD)9, systemic lupus erythematosus, and scleroderma. In the chronic phase of AD, elevated Th17 cell frequencies have been observed in both lesional and non-lesional skin as well as in peripheral blood, with their abundance correlating with clinical disease severity10,11. Moreover, IL-17 secreted by Th17 cells stimulates keratinocytes to produce antimicrobial peptides, which may compromise skin barrier integrity, facilitate Staphylococcus aureus colonization, and amplify local inflammatory responses12. Given the multifaceted involvement of Th17 cells across these pathological conditions, pharmacological modulation of Th17 differentiation has emerged as a promising avenue for the development of therapies targeting inflammatory skin diseases.
Licochalcone A (Lico-A), a flavonoid compound derived from Glycyrrhiza inflata, possesses potent anti-inflammatory and immunomodulatory properties, acting in part through suppression of nuclear factor kappa-light-chain-enhancer of activated B cells (NF-κB) signaling and inhibition of NOD-like receptor thermal protein domain-associated protein 3 inflammasome activation13,14. Clinical evidence has supported its therapeutic benefits in inflammatory skin conditions, including AD and acne15. However, whether Lico-A exerts direct regulatory effects on Th17 cell commitment remains unresolved, and a standardized experimental protocol for evaluating this activity is presently unavailable.
To address this gap, a dedicated in vitro protocol was developed that builds on established Th17 differentiation methods while incorporating essential modifications and controls specifically designed for the pharmacological evaluation of natural compounds. Unlike conventional polarization protocols that primarily aim to maximize differentiation efficiency, the system is optimized to rigorously assess compound-mediated inhibition by including parallel cell viability staining, vehicle controls, and a defined 500 nM Lico-A treatment regimen. The procedure encompasses: isolation of highly purified naïve CD4⁺ T cells from murine spleens via magnetic bead-based negative selection; induction of Th17 differentiation under anti-CD3/CD28 co-stimulation with a customized cytokine cocktail (TGF-β, IL-6, IL-1β, IL-23, and IL-2, supplemented with anti-IL-4 and anti-IFN-γ); treatment with Lico-A during the 72-hour polarization period; and quantification of differentiation efficiency by intracellular IL-17A staining followed by flow cytometric analysis. This protocol offers a robust and reproducible in vitro platform tailored for screening the immunomodulatory effects of natural compounds on Th17 differentiation and is readily adaptable for mechanistic investigations or drug discovery targeting Th17-associated inflammatory skin diseases.
פרוטוקול
All animal procedures must comply with the national standard of the People's Republic of China for laboratory animal welfare (GB/T 42011‑2022) and require prior approval from the Institutional Animal Care and Use Committee of Yichun University (Approval No. 2025039). Use 6–8-week-old female C57BL/6J mice for all experiments. The animals were housed under specific pathogen-free conditions with a 12 h light/dark cycle and free access to food and water. All laboratory waste generated during the execution of this protocol was managed in strict accordance with Chongqing Traditional Chinese Medicine Hospital regulations, following the principles of classified collection, designated storage, specialized management, and centralized disposal. Based on its nature, waste was categorized into three types and disposed of as described below. Chemical waste (e.g., waste liquids containing PFA or DMSO) was never mixed with ordinary refuse or other waste categories, and no toxic or hazardous chemical liquids were poured directly into drains. Liquid wastes were segregated according to their properties (organic, inorganic, acidic, alkaline) and stored in leak‑proof containers placed within secondary spill trays. Each container was labeled with a hazardous waste tag indicating the main components and the generation date.
All solid materials contaminated with chemicals (e.g., gloves, pipette tips, centrifuge tubes) were collected separately. Temporary chemical waste was eventually collected by the institution and transferred to a licensed company for recycling and harmless disposal. Biological waste (e.g., mouse tissues and cells) with potential infectivity was inactivated before removal from the laboratory, typically by autoclaving at 121 °C for 30 min. Animal carcasses and tissues were placed in sealed, dedicated bags or containers and temporarily stored frozen (at –20 °C or below) in designated freezers marked “Waste Only” until centralized collection. All biological waste was ultimately removed and harmlessly treated by a certified medical waste disposal company. Sharps waste (needles, blades, surgical scalpel blades, and broken glass) was immediately disposed of in puncture‑proof sharps containers. Sharps were never placed in ordinary trash bins or biological waste bags to avoid puncture injuries and contamination. When a sharps container was filled to approximately three‑quarters of its capacity, it was sealed by designated personnel and transferred to the designated temporary storage area, from which it was eventually disposed of by professional agencies. All the materials used in this study are listed in the Table of Materials.
A schematic diagram of the entire workflow is explained in Figure 1.
1. Preparation of naïve CD4⁺ T cells from mouse spleens
- Anesthetize mice by inhalation of 3% isoflurane delivered in 100% oxygen. Verify adequate anesthesia depth by loss of the pedal‑withdrawal reflex and reduced respiratory rate. After confirming deep anesthesia, perform cervical dislocation and immediately sterilize the carcass by immersion in 75% ethanol for 2 min.
NOTE: After euthanasia, confirm the absence of breathing and heartbeat before proceeding to spleen extraction. - Spleen extraction
- Lay the mouse on a clean bench. Using sterile surgical scissors and blunt forceps, create a midline abdominal incision and carefully dissect the abdominal layers.
- Using tweezers, gently retract the omentum and stomach to expose the spleen. Carefully free the spleen from the gastrosplenic ligament and surrounding tissues by blunt dissection, taking care not to crush or rupture the organ.
NOTE: Perform all subsequent manipulations within a sterile biosafety cabinet to maintain aseptic conditions
- Spleen homogenization and cell suspension preparation
- Position a 70 µm cell strainer on a 50 mL conical tube and carefully handle to avoid spillage. Transfer the spleen onto the strainer and gently mash it with the plunger of a 1 mL syringe until only fibrous debris remains.
- During crushing, flush the strainer with 5–8 mL fluorescence-activated cell sorting (FACS) buffer or Roswell Park Memorial Institute (RPMI) 1640 medium to wash dissociated lymphocytes through the filter mesh.
- Using a pipette, collect the cell suspension and transfer it to a 15 mL centrifuge tube. To eliminate debris, repeat the straining step twice.
NOTE: Typically, one mouse spleen yields approximately 1 × 10⁸ total splenocytes
- Red blood cell (RBC) lysis and cell counting
- Centrifuge the cell suspension at 300 × g for 10 min at room temperature, then carefully aspirate the supernatant
- Resuspend the pelleted cells in 2 mL red‑blood‑cell lysis buffer, then incubate the mixture at room temperature for 3–5 min until the suspension turns translucent.
- Stop the lysis by adding 10 mL of Dulbecco's phosphate-buffered saline (DPBS), followed by centrifugation under the same conditions.
- Discard the supernatant and resuspend the cell pellet in 5 mL of DPBS for cell counting using a hemocytometer or automated cell counter. Use approximately 108 cells for subsequent naïve T‑cell isolation.
NOTE: Proceed to naïve T cell isolation only if cell viability is >90% as determined by trypan blue exclusion.
PAUSE POINT: Cells can be resuspended in RPMI-1640 supplemented with 10% fetal bovine serum (FBS) and stored overnight at 4 °C.
2. Purification of naïve CD4⁺ T cells from mouse spleen
- Use roughly 1 × 10⁸ splenocytes for naïve CD4⁺ T‑cell enrichment. Centrifuge cell suspensions at 300 × g for 10 min at 4 °C following the manufacturer’s protocol for the mouse naïve CD4⁺ T‑cell isolation kit. Discard the supernatant after centrifugation.
NOTE: Maintaining all buffers and reagents at 4 °C during magnetic separation is critical not only for preserving cell viability but also for preventing activation-induced phenotypic changes in naïve T cells. Any inadvertent activation prior to Lico-A treatment could alter the cells' responsiveness to the compound and compromise the accuracy of the inhibition assessment. - Using 400 µL of chilled 1× magnetically activated cell sorting (MACS) buffer, resuspend the pellet. Subsequently, add 100 µL of the CD4⁺ T‑Cell Biotin Antibody Cocktail, mix thoroughly, and incubate at 4 °C for 5 min.
- To the cell suspension, add 200 µL of chilled MACS buffer, 200 µL of Anti-Biotin MicroBeads, and 100 µL of CD44 MicroBeads. Swirl gently and incubate at 4 °C for 10 min.
NOTE: Pre-chill the MACS buffer before use. - Dilute the cell suspension with 2 mL of chilled 1× MACS buffer and centrifuge as before (300 × g, 10 min, 4 °C). Aspirate the supernatant and resuspend the pellet in 3 mL of the same buffer.
- Prior to sample loading, install an LS separation column onto the MACS Separator magnet, ensuring the entire assembly remains within a sterile biosafety cabinet. Equilibrate the column by passing 3 mL of ice-cold 1× MACS buffer through the matrix.
- Once the MACS buffer level drops to the minimum, carefully apply the cell suspension onto the column. Subsequently, add another 3 mL of ice‑cold 1× MACS buffer to the column reservoir.
NOTE: Avoid introducing air bubbles during sample loading
TROUBLESHOOTING: If the column becomes clogged, gently pipette the surface with a 1 mL pipette tip; do not apply excessive pressure - Once the entire sample has passed through, wash the column twice with 3 mL of ice-cold 1× MACS buffer per wash. Collect the total flow‑through, which contains the unlabeled naïve CD4⁺ T‑cell population.
NOTE: Perform each wash only after the previous liquid has completely drained from the column. - Centrifuge the collected cells flow-through at 300 × g for 10 min at 4 °C. Remove the supernatant and resuspend the cell pellet in 1 mL of complete RPMI-1640 medium.
NOTE: RPMI medium is supplemented with 10% fetal bovine serum (FBS, 100 U/mL penicillin, 100 µg/mL streptomycin, 50 µM β-mercaptoethanol, 1 mM sodium pyruvate, 2 mM L-glutamine, and 10 mM HEPES. Count the cells and adjust the concentration to 1 × 10⁶ cells/mL.
PAUSE POINT: Purified naïve T cells can be kept at 4 °C for 2–4 h before proceeding to differentiation. - Take a sample of 1 × 10⁴ cells and stain the cells with Pacific Blue-conjugated anti-mouse CD4 antibody, Alexa Fluor 647-conjugated anti-mouse CD62L antibody and FITC-conjugated anti-mouse CD44 antibody. And analyze by flow cytometry to evaluate the purity of the isolated cells.
- Use only preparations with >90% purity for CD4⁺CD62L⁺CD44⁻T cells in subsequent differentiation experiments.
NOTE: CD4⁺CD62L⁺CD44⁻ cells are defined as naïve T cells, as CD44 expression indicates antigen-experienced (memory) T cells. The purity of the CD4⁺CD62L⁺CD44⁻ naïve subset was calculated as the percentage of CD44⁻ cells within the CD4⁺ gate. If the purity is below 90%, repeat the magnetic separation step or optimize the bead incubation conditions.
3. Differentiation of naïve CD4⁺ T Cells into Th17 cells
- Precoating of 96-well plates with Anti-CD3/CD28 antibodies
- Dilute anti-mouse CD3 and anti-mouse CD28 monoclonal antibodies separately in sterile 1× phosphate‑buffered saline (PBS) to 2 µg/mL for each antibody stock. Mix equal volumes of these two working stocks to generate the coating solution, in which each antibody reaches a final concentration of 1 µg/mL.
- Dispense 100 µL of the antibody mixture into each well of a 96-well plate, and seal the plate with an adhesive film or Parafilm.
NOTE: Ensure the solution covers the entire bottom of each well. - Incubate the coated plate overnight (16–18 h) at 2–8 °C.
NOTE: For shortened incubation timelines, alternatively coat plates at 37 °C for 2–3 h.
- Cell seeding and initiation of Th17 polarization
- Resuspend purified naïve T cells in complete RPMI-1640 medium. Adjust the cell density to 1 × 10⁶ cells/mL.
- Remove the coated 96-well plate from the refrigerator, aspirate the coating solution, and gently wash the wells twice with 200 µL of pre-chilled sterile PBS to remove unbound antibodies.
- Set up the following experimental groups.
NOTE: The control group: Add only cells and medium without polarizing cytokines. Th17-positive group: With Th17-polarizing cytokine cocktail containing anti-IL-4 (10 µg/mL), anti-IFN-γ (10 µg/mL), rmIL-2 (10 ng/mL), rmIL-6 (10 ng/mL), rmIL-1β (10 ng/mL), rmIL-23 (30 ng/mL), and TGF-β (2 ng/mL). - Seed 200 µL of the cell suspension (containing 2 × 10⁵ cells) into each pre-coated well and incubate the plate at 37 °C in a 5% CO₂ atmosphere for 72 h.
PAUSE POINT: This step initiates a 72-hour culture that should not be interrupted.
- Cell stimulation for intracellular cytokine staining
- After 72 h of culture, gently pipette the cells from each well to collect the suspension cells.
- Wash each well once with 200 µL of pre-chilled PBS, combine the wash with the cell suspension, transfer to a 1.5 mL microcentrifuge tube, centrifuge at 300 × g for 5 min at room temperature, and discard the supernatant.
- Resuspend the cells in 1 mL of complete RPMI-1640 medium containing phorbol 12-myristate 13-acetate (PMA) (50 ng/mL), ionomycin (500 ng/mL), and brefeldin A (5 µg/mL). Then incubate at 37 °C in a 5% CO₂ atmosphere for 5–8 h.
NOTE: Brefeldin A inhibits protein transport and is essential for intracellular accumulation of IL-17A.
- After stimulation, proceed to flow cytometric analysis as described in Section 5.
4. Experiment of Lico-A inhibiting the differentiation of naïve CD4⁺ T cells into Th17 cells
NOTE: This section describes the experimental setup used to assess the inhibitory effect of Lico-A on naïve CD4⁺ T cell differentiation into Th17 cells. The key distinction from standard Th17 polarization protocols is the inclusion of parallel treatment groups and vehicle controls to ensure that any observed reduction in Th17 frequency reflects specific inhibition rather than compound-induced cytotoxicity.
- One day prior to the experiment, coat a 96-well plate with anti-CD3/CD28 antibodies (1 µg/mL) by following steps 3.1.1–3.1.3.
- Preparation of Lico-A solution
- Dissolve Lico-A (purity ≥98% by HPLC) in dimethyl sulfoxide (DMSO) to prepare a 10 mM stock solution. Store aliquots at -20 °C for up to 6 months.
- On the day of the experiment, dilute the stock solution with complete RPMI-1640 medium to a final working concentration of 500 nM. Prepare the solution fresh for each experiment.
- Prepare a matching vehicle control solution containing an equivalent volume of DMSO (final concentration ≤0.1%) in complete RPMI-1640 medium.
CAUTION: DMSO is a skin irritant and can facilitate the absorption of other substances through the skin. Handle with gloves in a fume hood. The final DMSO concentration must be ≤0.1% in all wells, as higher concentrations can independently affect T cell activation, cytokine production, and cell viability.
- Grouping and cell treatment
- Divide the naïve CD4⁺ T cells into three groups. Maintain at least three replicate wells per group for statistical analysis:
- Th0 + vehicle Group (negative control): Resuspend cells in culture medium containing 0.1% DMSO (vehicle control) without polarizing cytokines.
- Th17 + vehicle group (vehicle control): Resuspend cells in culture medium containing Th17-polarizing cytokines (as in step 3.2.3) with 0.1% DMSO.
- Lico-A Treatment Group: Resuspend cells in culture medium containing Th17-polarizing cytokines plus 500 nM Lico-A.
- Resuspend the cells in their respective media at a density of 1 × 10⁶ cells/mL. Seed 200 µL of each cell suspension (2 × 10⁵ cells) into the pre-coated wells. Incubate the plate at 37 °C in a 5% CO₂ atmosphere for 72 h.
- Divide the naïve CD4⁺ T cells into three groups. Maintain at least three replicate wells per group for statistical analysis:
- After 72 h of culture, collect the cells from each well by gentle pipetting. Transfer the suspension to 1.5 mL microcentrifuge tubes. Wash each well once with 200 µL of pre-chilled PBS and combine with the corresponding cell suspension.
NOTE: Do not use enzymatic dissociation (e.g., trypsin) as T cells grow in suspension and can be recovered by simple pipetting. - After 72 h of culture, collect the cells from each well and analyze them by flow cytometry as described in Section 5.
5. Flow cytometric analysis of Th17 cell differentiation
- After 72 h of culture, gently resuspend cells in each well by repeated pipetting, then transfer cell suspensions into 1.5 mL microcentrifuge tubes.
- Enumerate the cells with a cell counter. Dilute the suspensions with 500 µL of DPBS per tube, centrifuge at 300 × g for 5 min at room temperature, and aspirate the supernatant.
- Prepare fixable viability dye as per the manufacturer's instructions. Then add 100 µL of the diluted dye to each pellet and incubate for 15 min at room temperature, protected from light.
TROUBLESHOOTING: If the live cell percentage is below 85%, re-evaluate the isolation procedure or prepare fresh cells from a new spleen. - Surface antibody staining
- To eliminate residual dye, add 1 mL of DPBS supplemented with 2% FBS to each tube, centrifuge at 300 × g for 5 min at room temperature, and carefully aspirate the supernatant.
- Resuspend the cells in 100 µL of DPBS containing 2% FBS and FITC anti-mouse CD4 antibody. Incubate for 30 min at 4 °C in the dark.
NOTE: This CD4 staining step is optional. In the representative experiment presented here, because the cultures were established from previously purified naïve CD4⁺ T cells (>90% purity), no additional CD4 staining or CD4-based gating was performed during analysis (see Section 5.11). This step is included for general applicability when unpurified cells are used.
- Add 1 mL of DPBS to each tube, centrifuge at 300 × g for 5 min at room temperature, and discard the liquid phase.
- Fix the cell pellets by resuspension in 200 µL of 4% paraformaldehyde (PFA) and incubation for 15 min at room temperature in the dark.
CAUTION: PFA is toxic and a suspected carcinogen. All manipulations involving PFA must be performed inside a fume hood while wearing appropriate personal protective equipment.
- Fix the cell pellets by resuspension in 200 µL of 4% paraformaldehyde (PFA) and incubation for 15 min at room temperature in the dark.
- Add 1 mL to each tube of DPBS, centrifuge samples at 300 × g for 5 min at room temperature, and aspirate the supernatant to ensure complete removal of fixative.
- Add 200 µL of fixation/permeabilization buffer to each tube. Maintain samples at 4–8 °C and incubate for 30 min.
- Blocking
- Wash permeabilized cells by adding 1 mL of 1× permeabilization buffer to each tube, centrifuge at 300 × g for 5 min at room temperature, and aspirate the supernatant.
- Resuspend the cells in 100 µL of 1× permeabilization Buffer containing Mouse IgG for blocking. Incubate samples at room temperature for 10 min.
- Add phycoerythrin (PE) anti-mouse IL-17A antibody to each tube according to the manufacturer's recommended dilution (1:100, i.e., 1 µL of antibody per 100 µL of cell suspension). Incubate mixtures at room temperature for 30 min protected from light.
- Rinse each tube with 1 mL of 1× permeabilization buffer. Centrifuge at 300 × g for 5 min at room temperature, and discard the supernatant to eliminate non‑specifically bound antibodies. Finally, resuspend stained cells in 200 µL of DPBS for subsequent flow cytometric acquisition.
- Acquire data on a NovoCyte Advanteon flow cytometer equipped with 405 nm, 488 nm, and 640 nm lasers. Fluorescence signals were detected using the following band‑pass filters: FITC‑A (525/45 nm, 488 nm laser), PE‑A (572/28 nm, 488 nm laser), BV421‑A (445/45 nm, 405 nm laser), APC‑A (667/30 nm, 640 nm laser). Perform fluorescence compensation using single‑stained compensation controls before sample acquisition. Analyze data using FlowJo v10.8 software.
NOTE: Gating strategy: Following polarization, the cells were harvested and analyzed by flow cytometry. Lymphocytes were first identified based on their forward- and side-scatter characteristics (FSC-A versus SSC-A), followed by singlet discrimination using FSC-A versus FSC-H. Viable cells were subsequently selected by excluding viability dye-positive events detected in the BV421 channel (L_D). Within the viable singlet lymphocyte population, IFN-γ⁺ cells were detected in the FITC channel, IL-4⁺ cells in the APC channel, and IL-17A⁺ cells in the PE channel to evaluate Th1, Th2, and Th17 polarization, respectively. Because the cultures were established from previously purified naïve CD4⁺ T cells, no additional CD4 staining or CD4-based gating was performed at this stage. Cytokine-positive cell frequencies were expressed as percentages of viable singlet lymphocytes. The sequential gating strategy is illustrated in Figure 2.
תוצאות
Naïve CD4⁺ T cells were first efficiently isolated and purified from mouse spleens using magnetic bead sorting technology, which served as the foundation for the entire study. Mouse spleens were harvested aseptically and processed into single-cell suspensions via mechanical dissociation followed by RBC lysis. Subsequently, total splenocytes were subjected to a two-step negative selection using a CD4⁺ T Cell Biotin Antibody Cocktail, Anti-Biotin MicroBeads, and CD44 MicroBeads. The results demonstrated that the overall purity of the isolated naïve CD4⁺ T cells reached at least 90% (Figure 3A–B). This level of purity fully meets the stringent requirements for cell purity in subsequent in vitro polarization experiments.
Based on the successful isolation, purified naïve CD4⁺ T cells were directionally induced under conditions of anti-CD3/anti-CD28 co-stimulation and a specific cytokine cocktail. In a representative experiment, compared to the solvent control group containing only medium, the proportion of IL-17A⁺ cells in the Th17 polarization group increased to 45.8% (Figure 4). This fully confirms that the in vitro polarization protocol adopted in this study effectively drives naïve CD4⁺ T cells to differentiate into the Th17 lineage.
In contrast, when the purity of isolated naïve CD4⁺ T cells falls below 90%, the subsequent polarization efficiency is markedly reduced, with the proportion of CD4⁺IL-17A⁺ cells typically falls below 15% even under optimal polarization conditions. This reduction likely results from contamination by memory T cells (CD4⁺CD44⁺), which exhibit altered activation thresholds and cytokine production profiles. Such low-purity preparations should be discarded, and the isolation procedure should be repeated. Similarly, if cell viability after isolation is below 85% as determined by fixable viability dye staining, the proportion of CD4⁺IL-17A⁺ cells may be artifactually reduced due to preferential loss of activated or differentiated cells. In such cases, the isolation protocol should be re-evaluated with attention to gentle handling and maintenance of appropriate buffer temperatures.
To investigate the regulatory effect of Lico-A on naïve CD4⁺ T cell differentiation, the polarization system was treated with Lico-A (500 nM). Under Th17-polarizing conditions, the proportion of IL-17A⁺ cells in the Lico-A treatment group decreased to 11.5% in the same representative experiment (Figure 4). These data indicate that Lico-A effectively inhibits the differentiation of naïve CD4⁺ T cells toward the Th17 lineage. This inhibition suggests a potentially specific interference effect on the relevant differentiation pathways. This protocol successfully establishes a robust and reproducible in vitro evaluation system to investigate the inhibitory effect of Lico-A on the differentiation of naïve CD4⁺ T cells into Th17 cells. The effective implementation of this method relies on precise control of several critical steps.
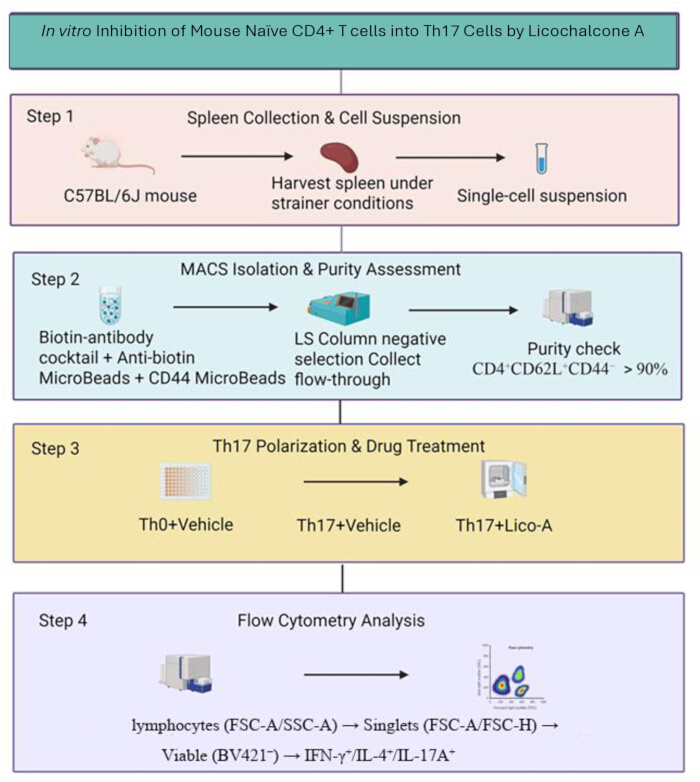
Figure 1: Schematic diagram of experimental procedures for in vitro inhibition of mouse naïve CD4⁺ T‑cell differentiation into Th17 cells by licochalcone A. Step 1: Spleens were harvested from C57BL/6J mice and processed to prepare single‑cell suspensions. Step 2: Naïve CD4⁺ T cells (CD4⁺CD62L⁺CD44⁻) were isolated via MACS negative selection; post‑isolation purity was validated by flow cytometry (>90%). Step 3: Isolated naïve CD4⁺ T cells were assigned to three experimental groups for Th17 polarization and drug treatment: Th0+Vehicle group, Th17+Vehicle group, and Th17+Lico‑A group. Step 4: Flow cytometry detection of cytokine‑producing T cells. Gating preview: lymphocytes (FSC‑A/SSC‑A) > singlets (FSC‑A/FSC‑H) > viable cells (BV421⁻), followed by detection of IFN‑γ⁺, IL‑4⁺, and IL‑17A⁺ cell populations. This schematic diagram was created by the authors using Microsoft PowerPoint 2021. Abbreviations: Lico-A = Licochalcone A; MACS = magnetic-activated cell sorting. Please click here to view a larger version of this figure.
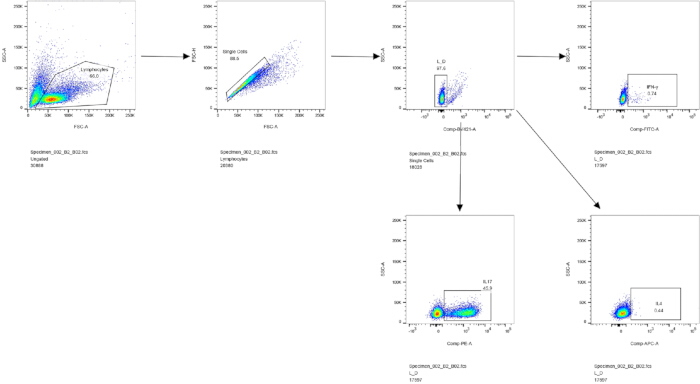
Figure 2: Gating strategy for flow cytometric analysis. Lymphocytes were first gated based on FSC-A versus SSC-A, then singlet discrimination was performed using FSC-A versus FSC-H. Viable cells were identified as the viability dye-negative (L_D) population. Within viable singlet lymphocytes, IFN-γ⁺, IL-4⁺, and IL-17A⁺ cells were detected using the FITC, APC, and PE channels, respectively. Data are from a representative experiment. Abbreviations: FSC-A = forward scatter area; FSC-H = forward scatter height; SSC-A = side scatter area; FITC = fluorescein isothiocyanate; APC = allophycocyanin; PE = phycoerythrin. Please click here to view a larger version of this figure.
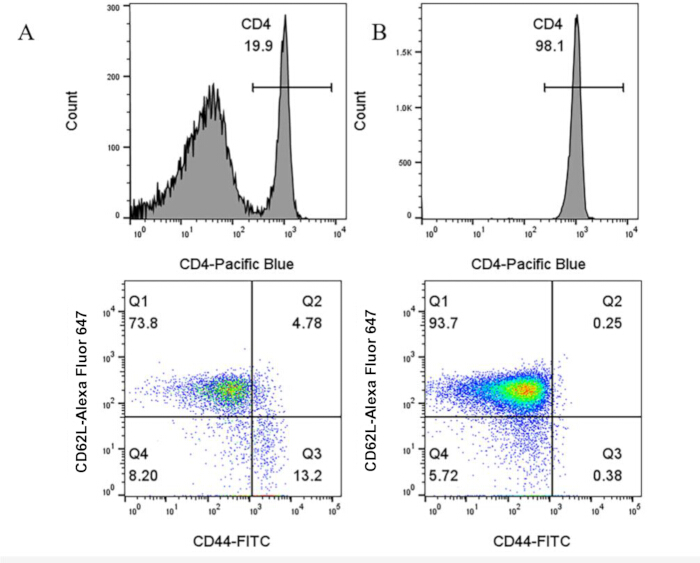
Figure 3: Purity of isolated naïve CD4⁺ T cells before and after sorting. (A) Before sorting, CD4⁺ T cells accounted for 19.9% of total lymphocytes, and naïve CD4⁺ T cells (Q1, CD44⁻CD62L⁺) constituted 73.8% of CD4⁺ T cells. (B) After sorting, CD4⁺ T-cell purity reached 98.1%, and naïve CD4⁺ T cells (Q1) accounted for 93.7% of CD4⁺ T cells. Dot plots show CD44-FITC on the x-axis and CD62L-Alexa Fluor 647 on the y-axis. Q1, naïve T cells (CD44⁻CD62L⁺); Q2, central-memory T cells (CD44⁺CD62L⁺); Q3, effector-memory T cells (CD44⁺CD62L⁻); Q4, double-negative cells (CD44⁻CD62L⁻). Abbreviation: FITC = fluorescein isothiocyanate. Please click here to view a larger version of this figure.
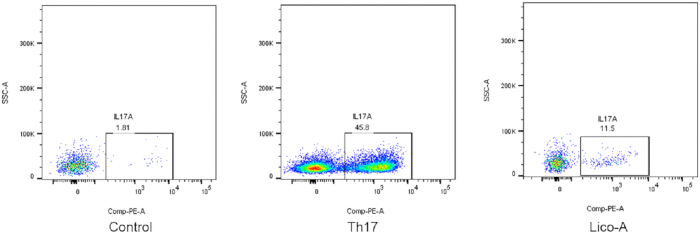
Figure 4: Effect of Lico‑A on the frequency of IL‑17A⁺ Th17 cells in vitro. Representative flow‑cytometry dot plots show the percentage of IL‑17A⁺ cells among viable CD4⁺ T cells. The first plot: Th0 control group (1.81% IL‑17A⁺ cells); the second plot: Th17+Vehicle control group (45.8% IL‑17A⁺ cells); the third plot: Lico‑A‑treated Th17 group (11.5% IL‑17A⁺ cells). Abbreviations: Lico-A = Licochalcone A. Please click here to view a larger version of this figure.
דיון
The successful application of this protocol depends on careful attention to several critical steps, each of which can significantly affect the quality and reproducibility of the results. Obtaining highly pure naïve CD4⁺ T cells is the cornerstone of the entire experiment. Magnetic bead-based negative selection is recommended for this purpose, as it avoids direct antibody labeling of target cells and thus preserves their naïve state and viability. The success of this step is highly dependent on the quality of the single-cell suspension and stringent bead incubation conditions. During preparation of the single-cell suspension, thorough but gentle grinding is required to prevent cell damage. Pre-chilled buffers and operations at 4 °C effectively reduce non-specific binding, ensuring that the final purity of CD4⁺CD62L⁺CD44⁻ cells exceeds 90%. If purity is inadequate, contaminating memory T cells may spontaneously produce cytokines under polarization conditions, significantly interfering with the accurate assessment of Th17 differentiation efficiency.
The stability of the Th17 polarization system is equally critical. The cytokine cocktail used in this protocol includes TGF-β, IL-6, IL-23, IL-1β, and low-dose IL-2. The latter is included primarily to support T cell survival and proliferation, rather than to promote Th17 differentiation, whereas IL-23 promotes Th17 maintenance and pathogenicity. The activity and batch-to-batch variability of these cytokines represent major experimental variables. It is therefore recommended to perform preliminary experiments with new cytokine batches to confirm their induction efficiency before large-scale use. Furthermore, establishing vehicle control groups is essential—a final DMSO concentration not exceeding 0.1% has been shown to have no observable effect on cell viability or Th17 differentiation, ensuring that any inhibitory effects can be attributed to the compound itself. The inclusion of both Th0 (non-polarized) and Th17 + vehicle control groups allows a clear distinction between compound-specific effects and background culture effects. Cell viability staining is incorporated as a routine quality control measure to exclude dead cells from analysis. And in the present study, preliminary cytotoxicity assays demonstrated that cell viability remained above 90% at a concentration of 500 nM Lico‑A, indicating that the reduction in IL‑17A⁺ cells was attributable to specific inhibition of Th17 differentiation rather than non‑specific cytotoxicity.
Several common technical issues may arise during the execution of this protocol. First, low purity of isolated naïve CD4⁺ T cells (<90%) is typically due to incomplete RBC lysis, excessive mechanical damage, or suboptimal bead-incubation conditions. This can be resolved by repeating the magnetic separation, optimizing incubation time, or using fresh lysis buffer. Second, low Th17 differentiation efficiency (<20%) is often associated with reduced cytokine activity due to improper storage or repeated freeze-thaw cycles. Cytokines should be aliquoted and stored at -80 °C, and fresh aliquots should be used for each experiment. Preliminary experiments with new cytokine batches are recommended to confirm activity before large-scale use. In addition, suboptimal anti-CD3/CD28 coating or DMSO concentrations exceeding 0.1% may impair T cell activation and should be carefully controlled. Third, high background staining in flow cytometry often results from insufficient washing or non-specific antibody binding. This can be addressed by increasing the number of washes to 3–4 times, including isotype or FMO controls, and titrating antibodies to determine optimal concentrations. Fourth, reduced cell viability after isolation or culture (<85%) may result from excessive mechanical stress, prolonged handling at room temperature, or suboptimal culture conditions. In such cases, attention should be paid to gentle pipetting, pre-chilling of all buffers, and strict adherence to recommended incubation temperatures. Cell viability should be routinely monitored before and after isolation using trypan blue exclusion or fixable viability dye staining.
Compared with previously published Th17 differentiation protocols, the method offers several distinct advantages for pharmacological evaluation: (1) the inclusion of parallel cell viability staining as an essential control to distinguish specific inhibition from cytotoxicity; (2) the inclusion of matched vehicle controls and Th0 controls to ensure that any observed reduction in IL-17A⁺ cells can be attributed specifically to the compound rather than solvent effects; and (3) the use of negative selection for naïve T cell isolation, which avoids direct antibody labeling of target cells and preserves their naïve state and viability. These modifications make the protocol particularly suitable for preliminary screening and mechanistic studies of immunomodulatory natural compounds.
Despite its utility, this protocol also has certain limitations. The in vitro culture system simplifies the complex in vivo microenvironment and cannot fully replicate cell-cell interactions, three-dimensional structures, or dynamic cytokine gradients in vivo, all of which may influence Th17 differentiation and function. In addition, only a single concentration of Lico-A (500 nM) was evaluated in this study. Although this concentration was selected based on preliminary dose-response experiments (0.3 µM, 0.5 µM, 1 µM, 3 µM, and 5 µM), a full dose-response experiment across a broader concentration range would be necessary to establish the IC₅₀ and confirm dose-dependent inhibition in future studies. It is important to note that the data presented in this study are derived from representative experiments, and no biological replicates, quantitative statistical analyses, or statistical tests were performed. As this manuscript is intended as a methods protocol establishing a standardized evaluation system, demonstration of the protocol's utility through representative results is appropriate. However, future studies employing this protocol for quantitative pharmacological characterization should include full biological replication and statistical analysis to further validate the findings. While this protocol provides a robust phenotypic screening platform, the underlying molecular mechanisms—including STAT3, RORγt, and IL-23R pathways—remain to be elucidated in future studies. Atopic dermatitis and psoriasis represent potential application areas for this assay, but disease-specific therapeutic activity requires validation in appropriate in vivo models.
In summary, this protocol provides a practical tool for studying Th17-related diseases and serves as a preclinical screening platform for rapid evaluation of candidate compounds14,15. However, the disease relevance of any observed effects must be confirmed in appropriate animal models before clinical translation.
גילויים
The authors have no conflicts of interest to declare.
תודות
This work was supported by the National Natural Science Foundation of China (No. 82205133); Chongqing Natural Science Foundation (No. CSTB2022NSCQ-MSX1619, CSTB2022NSCQ-MSX1376, CSTB2024NSCQ-MSX0671); Science and technology research project of Chongqing Municipal Education Commission (No. KJZD-K202315102, NO. KJQN202315138); Science and technology research project of Chongqing Municipal Education Commission (No. KJQN202415117).
חומרים
| שם | חברה | מספר קטלוג | הערות |
|---|---|---|---|
| Anti-Biotin MicroBeads | Nobleryder | YZ-130-090-485 | — |
| AOPI Live/Dead Cell Staining Solution | Changsha Puya Biotechnology Co., Ltd. | C0002 | — |
| APC anti-mouse CD44 Antibody | Biolegend | 103012 | AB_312959 |
| APC anti-mouse IFN-γ | Biolegend | 505810 | AB_315404 |
| APC Rat Anti-Mouse IL-4 | BD Biosciences | 554436 | |
| Cell stimulation cocktail (PMA/Ionomycin/Brefeldin A) | eBioscience | 00-4975-03 | — |
| DPBS (Dulbecco's Phosphate-Buffered Saline) | Biological Industries | 02-023-1A | — |
| FACS Buffer | Novoprotein | XCS02-01A | — |
| Fetal Bovine Serum | Sigma-Aldrich | ES009-M | — |
| FITC anti-mouse CD4 | Biolegend | 100406 | AB_312691 |
| FITCRat Anti-MouseIFN-γ | BD Biosciences | 554411 | |
| Fixable viability dye | Biolegend | 423102 | — |
| Goat Anti-Mouse IgG | Abclonal | AS003 | — |
| IL-1β Protein, Mouse, Recombinant | Sino Biological | 50101-MNAE | — |
| MACS Buffer | BIORIGIN | BN24771 | — |
| Mouse IL-23 (IL-23A & IL-12B Heterodimer) | Sino Biological | CT028-M08H | — |
| Naïve CD4+ T Cell Isolation Kit, mouse | Miltenyi Biotec | 130-104-453 | AB_2891873 |
| PE anti-mouse IL-17A | BD Biosciences | 559502 | |
| Permeabilization buffer | BD Biosciences | 561651 | — |
| PFA (Paraformaldehyde) | Servicebio | N | — |
| RBC Lysis Buffer | eBioscience | 555899 | — |
| Recombinant Mouse IL-2 | Peprotech | 212-12 | — |
| Recombinant Mouse IL-6 | Peprotech | 216-16 | — |
| Recombinant Mouse TGF-β1 Protein | R&D Systems | 7666-MB-05 | — |
| RPMI 1640 Medium | Gibco | C12440500BT | — |
מקורות
- Wang, J et al. Intricacies of TGF-β signaling in Treg and Th17 cell biology. Cell Mol Immunol, 2023. 20(9): p. 1002-1022.
- Sun, L et al., T cells in health and disease. Signal Transduct Target Ther, 2023. 8(1): p. 235.
- Sieminska, I., M. Pieniawska, and T.M. Grzywa, The Immunology of Psoriasis-Current Concepts in Pathogenesis. Clin Rev Allergy Immunol, 2024. 66(2): p. 164-191.
- Park, E. and M. Ciofani, Th17 cell pathogenicity in autoimmune disease. Exp Mol Med, 2025. 57(9): p. 1913-1927.
- Xie, R et al., Roles of immune cell metabolism in rheumatoid arthritis. Front Immunol, 2026. 17: p. 1763130.
- Wang, H et al., In Vitro .Differentiation of Naive CD4+ T Cells into Pathogenic Th17 Cells in Mouse. J Vis Exp, 2024(212).
- Kanno, T et al., Lipid metabolism in Th17 cell function. Pharmacol Ther, 2023. 245: p. 108411.
- Qi, P et al., Mechanisms of gut homeostasis regulating Th17/Treg cell balance in PMOP. Front Immunol, 2024. 15: p. 1497311.
- Savva, M et al., Recent Advancements in the Atopic Dermatitis Mechanism. Front Biosci (Landmark Ed), 2024. 29(2): p. 84.
- Meesters, L.D et al., Dissecting key contributions of T(H)2 and T(H)17 cytokines to atopic dermatitis pathophysiology. J Allergy Clin Immunol, 2025. 156(3): p. 690-704.
- David, E. and T. Czarnowicki, The pathogenetic role of Th17 immune response in atopic dermatitis. Curr Opin Allergy Clin Immunol, 2023. 23(5): p. 446-453.
- Ogonowska, P et al., Colonization With Staphylococcus aureus in Atopic Dermatitis Patients: Attempts to Reveal the Unknown. Front Microbiol, 2020. 11: p. 567090.
- Wang, X et al., Comprehensive Insights into Licochalcone A: its Distribution, Biosynthesis, Metabolism, and Pharmacological Effects. Curr Drug Metab, 2025. 26(8): p. 548-560.
- Liu, M., Y. Du, and D. Gao, Licochalcone A: a review of its pharmacology activities and molecular mechanisms. Front Pharmacol, 2024. 15: p. 1453426.
- Liu, D et al., Therapeutic potential of Licochalcone A in dermatological diseases: from basic to clinical research. Front Pharmacol, 2025. 16: p. 1632006.