여기에 제시된 프로토콜은 딱정벌레에서 생성된 시토크롬 c 산화효소 소단위 I(COI) 유전자 염기서열의 컴퓨터 기반 처리에 대해 사용자를 안내하는 것을 목표로 하며, 이를 통해 분자 연산 분류학 단위(MOTU)라고 하는 종 클러스터링 가설이 DNA에서 생성될 수 있습니다.
이 콘텐츠를 보려면 JoVE 구독이 필요합니다. 로그인하거나 오늘 무료 평가판을 시작하세요.
방법 논문
강기슭 딱정벌레와 수생 딱정벌레 사이에서 MOTU(Molecular Operational Taxonomic Units)를 생성하기 위한 혼합물 파이프라인
이 논문에서
요약
초록
생물다양성 감소는 상상할 수 없는 속도로 진행되고 있지만, 생물다양성 모니터링은 기준선 다양성의 불완전한 목록과 숙련된 분류학자의 인구 감소를 포함한 다양한 요인으로 인해 방해를 받고 있습니다. "암흑 분류군(dark taxa)" 또는 분류학에서 종종 연구되지 않은 초다양성 그룹의 종 목록에서 이러한 장애물을 해소하는 것은 극복할 수 없는 환경 압력에 직면한 열대 지방에서 특히 중요합니다. 형태학 기반 알파 분류법은 종 식별의 황금 표준으로 남아 있지만, DNA 기반 방법은 종 묘사 및 발견을 가속화하는 데 엄청난 잠재력을 보여주고 있습니다. 여기에서는 눈에 잘 띄지 않는 두 개의 딱정벌레 속, 즉 Limnichidae 계통의 Byrrhinus Motschulsky(1858년)와 필리핀의 Hydrophilidae 계통의 Anacaena Thomson(1859년)에 대해 구현된 6개의 분자 종 구분 접근 방식을 포함하는 분자 연산 분류 단위(MOTU)를 생성하기 위한 혼합물 파이프라인을 설명합니다. 이 프로토콜은 DNA 바코드 처리에 중점을 두고 있으며 이러한 유전자 데이터는 염기서열분석 또는 온라인 데이터베이스에서 다운로드하여 얻을 수 있다는 점을 감안할 때 여기에 설명된 프로토콜의 시작점은 DNA 염기서열입니다. COI 바코드를 감안할 때 파이프라인은 서열 정렬을 입력 데이터로 사용하는 TaxonDNA, K2P 및 ASAP의 세 가지 임계값 기반 분자 종 구분 접근 방식의 조합을 활용합니다. 또한 파이프라인은 입력 데이터로 트리 파일이 필요한 PTP-ML, PTP-BI 및 mPTP의 세 가지 통합 기반 접근 방식으로 진행됩니다. 일부 접근 방식은 웹 서버 사용을 수반하는 반면 다른 접근 방식은 로컬 소프트웨어를 사용합니다. 제시된 알고리즘 방법의 선택으로 MOTU는 합의 또는 다수결에 의해 식별될 수 있습니다. 놀랍게도, 이 파이프라인은 필리핀에서 거의 눈에 띄는 딱정벌레 종을 묘사했으며, 심지어 동일하거나 인접한 지역에서 기록된 종도 표시했습니다.
서론
다양한 분류군 1,2,3,4에 걸쳐 전 세계 종이 전례 없는 감소율로 인해 이전에 발견되지 않고 설명되지 않은 종을 포함하는 포괄적인 생물 다양성 목록을 작성하려는 추진력은 시간과의 경쟁이 되고 있습니다 2,5. 우선, 생물다양성 보전은 적절한 분류학적 지식에 비추어야만 의미가 있다 6,7. 그러므로, 종 수준에서 생물다양성을 규명하는 것은 밀접하게 관련되어 있지만 서로 다른 종들이 독특한 근본적인 틈새를 가질 수 있다는 점을 감안할 때 필요하다8.
딱정벌레 계통학에서 알파 분류학(alpha-taxonomy) 또는 전통적인 분류학(traditional taxonomy)은 전부는 아니더라도 대부분의 동물 그룹9과 유사한 종 식별의 황금 표준입니다. 이 접근 방식은 형태학적 특성에 의존하여 더 높은 분류법에서 유기체를 분류하고 종 수준10,11에서 식별을 제공합니다. 많은 경우에서, 과(family)12 또는 심지어 속(genus) 수준 식별13은 신체 형태 및 특화된 적응(specialized adaptations)과 같은 외적 형태학적 특징만을 사용하여 수행될 수 있다. 한편, 딱정벌레의 종 수준 식별은 일반적으로 aedeagus 또는 남성 생식기의 구조적 세부 사항의 비교를 통해 수행됩니다 14,15,16.
이러한 형태학 기반 알파 분류학이 널리 받아들여지고 있음에도 불구하고, 종 발견에 대한 이러한 접근 방식은 특히 무척추 동물19에서 수많은 '분류학적 장애물'6,17,18에 의해 방해를 받고 있습니다. 딱정벌레 계통학에서 알파 분류학을 사용한 종 식별 및/또는 발견은 제한된 수의 숙련된 분류학자20,21, 간략하고 거의 유익하지 않은 초기 설명22, 문헌 및 유형 표본23에 대한 접근과 관련된 물류 문제에 직면해 있습니다.
이것은 문제의 분류군이 비밀스럽거나 매우 눈에 띄지 않을 때 더욱 악화됩니다. 수수께끼 종(Cryptic species)은 같은 속(genus) 또는 심지어 다른 속(genera)의 종들의 집합을 말하며, 미묘한 종간 표현형의 차이를 감안할 때 비교 형태학으로 쉽게 설명할 수 없다24. '어두운 분류군'25,26,27으로 간주되는 일부 수수께끼 분류군은 또한 매우 다양하지만 연구가 많이 부족합니다. 불행히도, 이것은 강기슭 및 수생 딱정벌레에서 드문 일이 아닙니다 8,28. 수수께끼 같은 어두운 분류군 사이의 종 묘사를 해결하지 못하면 잠재적으로 다른 틈새와 생태학적 요구 사항을 가진 유기체에 대해 획일적인 보존 조치가 제공되기 때문에 생물 다양성을 위협합니다 8,29.
이러한 도전을 감안할 때, '통합적 분류학'23 또는 알파 분류학을 다른 증거와 결합하는 접근 방식은 지난 20년 동안 새로운 종을 세우는 수단으로 견인력을 얻었습니다 30,31,32. 딱정벌레 33,34,35,36,37,38,39 및 기타 곤충 목 40,41,42,43,44,45에 대한 통합 분류 학적 연구에 사용되는 증거 중 하나는 DNA 염기서열입니다. 특히, 미토콘드리아 시토크롬 c 산화효소 소단위 I(COI) 유전자는 적당히 보수적인 특성으로 인해 다양한 동물 세트를 바코드로 만드는 데 사용되고 있습니다 46,47,48. '바코드 단편' 또는 '폴머 단편'으로도 알려진 658bp 길이의 5'말단(COI-5')이 '진단' 서열49로 제안되었지만, 3'말단50,51,52를 위한 견고한 프라이머 세트로 인해 723bp 길이의 COI-3'도 사용되고 있습니다.
COI를 이용한 DNA 바코딩은 종 수준 동정을 위해 고안되었지만, GenBank54 및 BOLD55와 같은 선험적 서열 저장소(53)에 의해 제한되며, 분자 종 구분 접근법은 전제 조건 저장소56 없이 제공된 DNA 염기서열만을 사용하여 종 한계를 설정한다. 입력 파일을 기반으로 하는 분자 종 구분 접근 방식에는 두 가지 클래스가 있습니다. 첫째, 염기서열 정렬을 입력으로 사용하는 임계값 기반 접근 방식은 컷오프 값을 사용하여 종 48,57,58 사이의 발산을 결정합니다. 거리 기반 방법으로서 이러한 접근 방식은 곤충에 대해 관찰된 최대 종내 거리 3%에 의존하며, 이를 '바코드 갭'이라고 합니다51,59. 임계값 기반 접근 방식 중 일부는 TaxonDNA60에서 구현된 SpeciesIdentifier, Kimura 2-parameter(K2P)61을 통한 유전적 거리, ASAP(Assemble Species by Automatic Partitioning)62입니다.
둘째, 트리를 입력 파일로 사용하여 병합 기반 접근 방식은 계통 분기 속도 63,64,66의 변화를 결정하여 종 경계를 식별하고 독립적인 계통을 정렬합니다. 종종 계통발생학적 종 개념67에 의존하는 유착 기반 접근 방식에는 Poisson tree processes (PTP)68 및 그 변형, 다중 속도 PTP69가 포함됩니다. 어쨌든, 분자 종 구분 접근법에 의해 형성된 클러스터는 집합적으로 분자 조작 분류 단위(MOTU)라고 합니다.
여기에서는 세 가지 임계값 기반 접근 방식과 세 가지 유착 기반 접근 방식을 포함하는 MOTU를 생성하기 위한 혼합물 파이프라인 방법을 제시합니다(그림 1). 파이프라인은 두 개의 데이터 세트, 즉 (1) 통합 분류학을 사용하여 이전에 세워진 두 개의 발표된 종 35 딱 정벌레35 딱정벌레의 COI-3' 염기서열과 (2) 1859년 딱정벌레 Anacaena Thomson의 COI-5' 염기서열은 두 개의 발표된 종70 의 염기서열로 구성되어 있습니다 이전에는 알파 분류법과 설명되지 않은 종의 추가 염기서열을 사용하여 세워졌습니다.
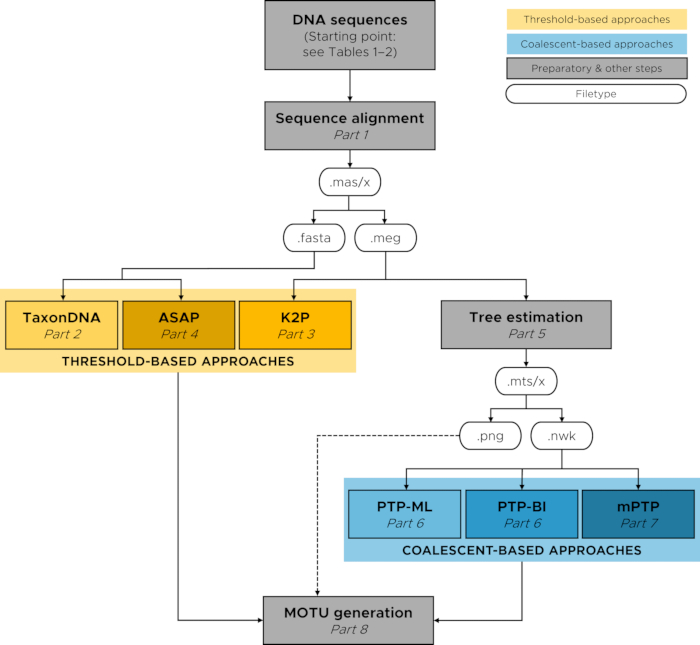
그림 1: MOTU를 생성하기 위한 혼합물 파이프라인의 순서도. 이 그림의 더 큰 버전을 보려면 여기를 클릭하십시오.
액세스가 제한되었습니다. 이 콘텐츠를 보려면 로그인하거나 체험판을 시작하세요.
프로토콜
이 혼합물 파이프라인의 시작 물질은 온라인 저장소(예: BOLD, GenBank)에서 다운로드하거나 Sanger 염기서열분석71에서 생성할 수 있는 DNA 염기서열분석입니다. 표 1 과 표 2 에는 이 논문에 대표적인 결과가 제시된 데이터 세트의 등록 번호가 나열되어 있습니다.
1. 임계값 기반 접근법을 위한 준비 단계: 염기서열 정렬
- MEGA X72의 로드 시퀀스.
참고: MEGA X는 https://www.megasoftware.net/ 에서 다운로드할 수 있습니다.- Align을 클릭하여 드롭다운 메뉴를 엽니다. Edit/Build Alignment를 클릭하고 Create a new alignment를 선택합니다. 확인을 클릭하여 이 선택을 확인합니다. 정렬을 위한 데이터 유형으로 DNA를 선택합니다.
- Edit(편집) 탭 위에 마우스를 올려놓고 Insert Sequence from File(파일에서 시퀀스 삽입)을 선택합니다. 시퀀스가 있는 디렉토리로 이동하여 MEGA에 로드할 항목을 선택합니다.
- Alignment를 클릭하여 순서를 정렬한 다음 ClustalW73으로 정렬합니다. 기본 설정을 계속 진행하고 확인을 클릭합니다.
- 양쪽 끝을 자르고 삽입 또는 삭제를 정리하여 시퀀스를 수동으로 편집합니다.
- 삽입을 삭제하려면 삽입된 베이스 및/또는 위치를 클릭하고 키보드에서 Delete 키를 누릅니다.
- 삭제를 수정하려면 "-"로 표시된 대로 삭제되어야 하는 위치를 클릭하십시오. "-"를 삭제하고 원하는 베이스를 입력합니다.
- 모든 시퀀스에 문자가 있는 가장 빠른 위치를 찾습니다. 결정된 위치의 왼쪽에 있는 위치의 행 머리글에 있는 빈 상자를 클릭하고 시작 끝이 선택될 때까지 모든 시퀀스의 초과 위치가 선택될 때까지 끕니다. Delete 키를 눌러 자릅니다.
- 1.3.3단계를 반복하여 모든 시퀀스에 문자가 있는 마지막 위치를 찾습니다. 결정된 위치의 오른쪽에 있는 위치의 헤더 행에 있는 빈 상자를 클릭하고 터미널 끝이 선택될 때까지 모든 시퀀스의 초과 위치가 될 때까지 드래그합니다. Delete 키를 누릅니다.
참고: 그림 2A 는 DNA 염기서열의 양호한 정렬을 보여줍니다. 마지막 데이터 세트는 동일한 길이의 시퀀스 매트릭스입니다. 따라서 서열 길이는 연구 결과에 영향을 미치는 요소가 아닙니다. 참조 시퀀스는 정렬 행렬의 최종 길이에 대한 기초 역할을 합니다.
- COI가 단백질 코딩 서열이라는 점을 감안하여 정지 코돈을 확인하기 위해 염기서열을 변환합니다.
- 모든 염기서열을 선택한 다음 Translated Protein Sequences 탭을 클릭합니다.
- 메시지가 표시되면 유전 코드를 무척추 동물 미토콘드리아로 확인합니다. 유전 코드가 다른 경우 아니오를 클릭하면 무척추 동물 미토콘드리아 유전 코드 상자를 선택할 수 있는 메뉴가 나타납니다.
- 정렬 본문에서 별표로 표시된 정지 코돈이 전체 열에 존재하는 경우 DNA 염기서열을 클릭하고 모든 염기서열의 첫 번째 위치를 삭제합니다.
- 정지 코돈이 여전히 어떤 순서로든 존재하는 경우 이전 단계를 반복합니다.
- 정지 코돈이 여전히 존재하는 경우 이전에 삭제한 위치를 복원합니다. 모든 시퀀스를 선택한 다음 데이터 탭 위에 마우스를 올려 놓고 Reverse를 클릭합니다.
- 1.4.1단계를 반복합니다. 정지 코돈이 여전히 존재하는 경우 1.4.3 및 1.4.4 단계를 반복합니다.
참고: 그림 2B 는 코돈의 양호한 정렬을 보여줍니다.
- DNA Sequences를 클릭하고 염기서열 정렬을 .mas/x에 저장합니다. 시퀀스를 .meg 파일 및 .fasta 파일과 같은 다른 관련 파일 형식으로 내보냅니다.
참고: 특정 분자 종 구분 접근법은 외집단 없이 더 잘 작동합니다. 따라서 가능한 고려 사항은 아웃그룹 없이 정렬 파일의 복사본을 생성하는 것입니다.
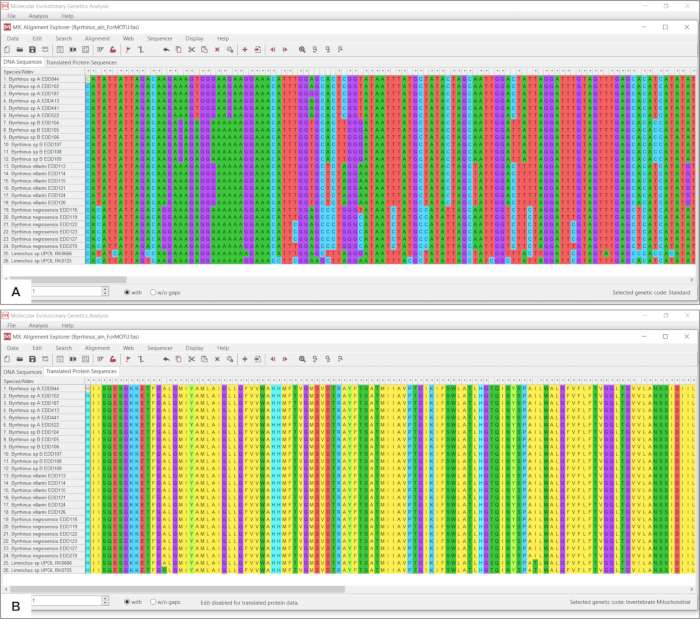
그림 2: MEGA X의 시퀀스 정렬. (A) 수동으로 세척된 최종 DNA 염기서열 정렬 및 (B) 삽입, 결실 및 갭이 없는 Byrrhinus 데이터 세트의 번역된 단백질 염기서열 정렬. 이 그림의 더 큰 버전을 보려면 여기를 클릭하십시오.
2. Species Identifier 1.8의 Taxon DNA 모듈에 의한 구분
참고: 종 식별자는 https://taxondna.sourceforge.net/ 에서 다운로드할 수 있습니다.
- TaxonDNA를 엽니다. Import(가져오기)를 클릭한 다음 FASTA를 클릭합니다. 정렬을 .fasta 형식으로 업로드합니다.
- Modules( 모듈)를 클릭하고 Cluster( 클러스터)를 클릭합니다. 임계값을 3%로 설정합니다. 그런 다음 Generate information about individual cluster(개별 클러스터에 대한 정보 생성 )를 확인합니다(그림 3).
- 지금 클러스터 만들기를 클릭합니다!. 스크린샷을 찍어 결과를 저장합니다.
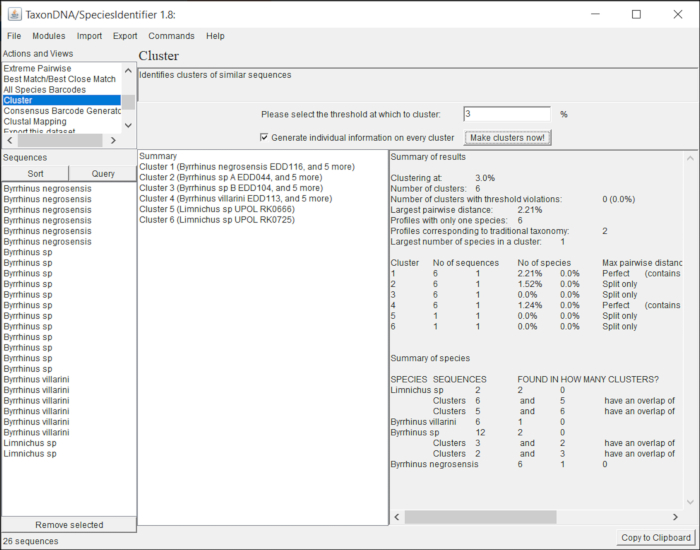
그림 3: Species Identifier 1.8 창의 TaxonDNA는 3%의 사용자 식별 한계 임계값을 보여줍니다. 이 그림의 더 큰 버전을 보려면 여기를 클릭하십시오.
3. MEGA X에서 Kimura 2-parameter (K2P)에 의한 구분
- MEGA에서 파일을 클릭하여 .meg 파일을 연 다음 파일/세션 열기를 클릭합니다. Distance를 클릭한 다음 Compute Pairwise Distances를 클릭합니다. .meg 파일에서 구분을 확인합니다.
- Model/Method(모델/방법) 옆의 노란색 상자 위에 마우스를 올린 다음 상자 오른쪽에 나타나는 화살표를 클릭합니다.
- 드롭다운 메뉴에서 Kimura 2-파라미터 모델을 선택합니다. 확인을 클릭하여 프로그램을 실행합니다. 데이터 출력 창을 엽니다(그림 4).
- File( 파일)을 클릭한 다음 Export/Print Distances(거리)를 클릭합니다.
- 출력 형식 옆의 드롭다운 메뉴를 열고 XL: Microsoft Excel 통합 문서를 선택합니다. [Decimal Places]에서 4를 선택합니다.
- 결과 스프레드시트를 Microsoft Excel에 저장합니다. 조건부 서식을 사용하여 거리가 0.03(또는 3%) 미만인 사람들을 강조 표시합니다.
참고: 이 문서에서 설명한 다른 방법과 달리 K2P는 사용자가 식별한 임계값에 종속되기 때문에 클러스터링을 즉시 제공하지 않습니다. 이 파이프라인은 임계값이 3%라는 가정하에 작동하며, 이는 유전적 거리가 3% 미만인 모든 염기서열 쌍이 동일한 분자 클러스터에 속한다는 것을 의미합니다.
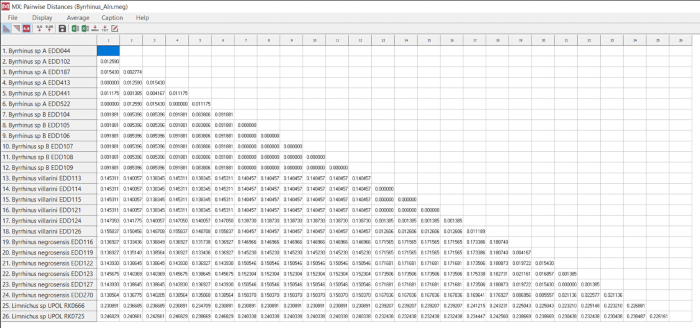
그림 4: Kimura-2-parameter의 결과를 보여주는 MEGA X의 결과 창. 이 그림의 더 큰 버전을 보려면 여기를 클릭하십시오.
4. 자동 분할에 의한 어셈블 종에 의한 구분 (ASAP)
- ASAP 웹 서버로 이동: https://bioinfo.mnhn.fr/abi/public/asap/asapweb.html
- Choose a file...이라고 표시된 주황색 상자를 클릭하고 .fasta 파일을 선택하여 정렬을 업로드합니다. 또는 .fasta 파일을 주황색 상자로 드래그합니다. 아래로 스크롤하여 이동을 클릭합니다.
- 클러스터링을 다운로드하려면 ASAP 점수가 가장 낮고 p-val 순위가 가장 높은 행의 목록을 클릭합니다(그림 5).
참고: 결과 출력은 분자 클러스터의 하위 집합을 표시하는 .txt 파일입니다.
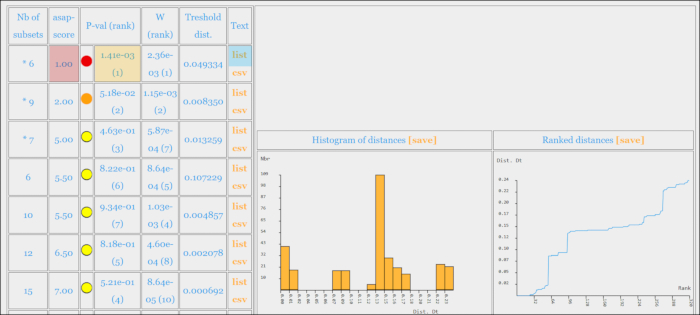
그림 5: 가능한 구분을 보여주는 ASAP의 결과 창. 첫 번째 결과(파란색 상자)는 가장 낮은 ASAP 점수(빨간색 상자)와 가장 높은 P-val 순위(노란색 상자)로 인해 허용됩니다. 이 그림의 더 큰 버전을 보려면 여기를 클릭하십시오.
5. coalescent-based approaches를 위한 준비 단계: Tree estimation
- Data(데이터)를 클릭한 다음 Open A File/Session(파일/세션 열기)을 클릭하여 .meg 파일을 엽니다. 최적 맞춤 대체 모형을 검정합니다.
- 모델을 클릭한 다음 최고의 DNA/단백질 모델(ML)을 찾으십시오. 분석할 .meg 파일을 확인합니다.
- Analysis Preferences 메뉴에서 Ok를 클릭합니다(그림 6A). 가장 낮은 BIC 및 AICc 값을 사용하는 최상의 모델을 기록해 둡니다(그림 6B).
참고: 이것은 일반적으로 결과 창의 모델 목록에서 첫 번째 모델입니다. 결과 창의 아래쪽 부분에 있는 축약된 모델 이름의 전체 이름을 참조하십시오.
- 트리를 생성합니다.
- Phylogeny를 클릭한 다음 Construct/Test Maximum Likelihood Tree를 클릭합니다.
- 최적 적합 뉴클레오티드 치환 모델을 사용합니다. 모델/방법 옆에 있는 노란색 상자를 클릭하여 이 작업을 수행합니다. 드롭다운 메뉴에서 모델을 선택합니다.
- 최적 맞춤 뉴클레오티드 치환 모델에 '+G' 또는 '+I' 또는 둘 다가 있는 경우 Rates among Sites 옆의 상자를 클릭하고 드롭다운 메뉴에서 매개변수(G, I, G + I)를 선택합니다(그림 6C).
- 계통 발생 테스트(Phylogeny Test)에서 계통 발생 테스트(Test of Phylogeny) 옆의 상자를 클릭하고 드롭다운 메뉴에서 부트스트랩 방법(Bootstrap method)을 선택합니다. "아니오" 옆의 상자를 클릭하십시오. 부트스트랩 복제"를 입력하고 1000을 입력합니다(그림 6C). 확인을 클릭하여 분석을 실행합니다.
- 결과 트리가 포함된 창이 열리면(그림 6D) 트리 세션을 .mts/x로 저장합니다. 출력을 .nwk 파일로 저장합니다. 나무를 그림 파일로 .png 저장하십시오.
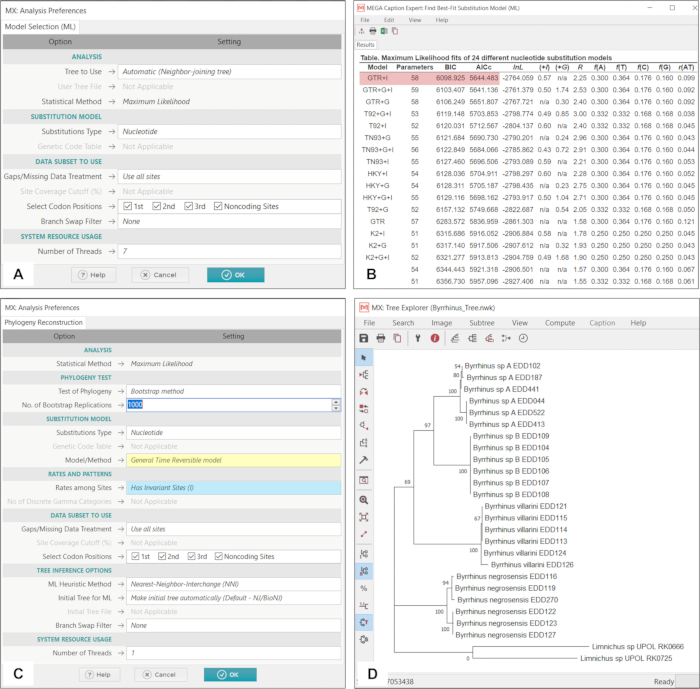
그림 6: coalescent 기반 접근 방식을 위한 준비 단계로서의 MEGA X의 트리 추정. (A) 최적 뉴클레오티드 치환 모델을 결정하기 위한 설정. (B) Byrrhinus 데이터 세트의 경우 BIC 및 AICc 값이 가장 낮기 때문에 가장 적합한 모델은 GTR + I입니다(빨간색 상자). (C) 최대우도 트리를 실행할 때 GTR(노란색 상자) + I(파란색 상자)를 매개변수로 설정했습니다. (D) 후속 분석에 사용할 결과 원시 ML 트리. 이 그림의 더 큰 버전을 보려면 여기를 클릭하십시오.
6. PTP(Poisson Tree Processes)에 의한 구분
참고: 아래 단계를 통해 PTP-ML 및 PTP-BI의 결과를 얻을 수 있습니다.
- PTP 웹 서버로 이동: https://species.h-its.org/ptp/
- 파일 선택을 클릭하여 newick 파일을 업로드합니다. My tree is(내 트리 위치)에서 Rooted(루팅됨)를 선택합니다(그림 7A).
- 분석을 위한 매개변수를 입력합니다. No. MCMC generations(번호 MCMC 세대)에서 100000을 입력합니다. Thinning(얇음)에서 100을 입력합니다. 번인(Burn-in)에서 0.1을 입력합니다. 시드(Seed)에서 123을 입력합니다.
- Outgroup taxa names (if any) 아래의 상자에 팁의 이름을 입력하여 outgroup을 입력합니다. 입력 형식 지정에 대한 지침은 입력 상자 오른쪽에 있습니다.
- 해당 필드에 이메일 주소를 입력하고 제출을 클릭합니다. PTP 종 구분 결과 창에서 여기를 클릭하여 결과 창을 엽니다.
- Maximum likelihood(최대 가능성) 솔루션에서 Download debound(구분 결과 다운로드)를 클릭하여 PTP-ML의 결과를 다운로드합니다(그림 7B).
- Bayesian 지원 솔루션에서 Download debound(구분 결과 다운로드)를 클릭하여 PTP-BI의 결과를 다운로드합니다.
참고: 결과는 파티션의 시퀀스 그룹을 나타냅니다. 이들은 번호가 매겨진 종과 지지 값으로 표시되며 1.000이 이상적입니다.
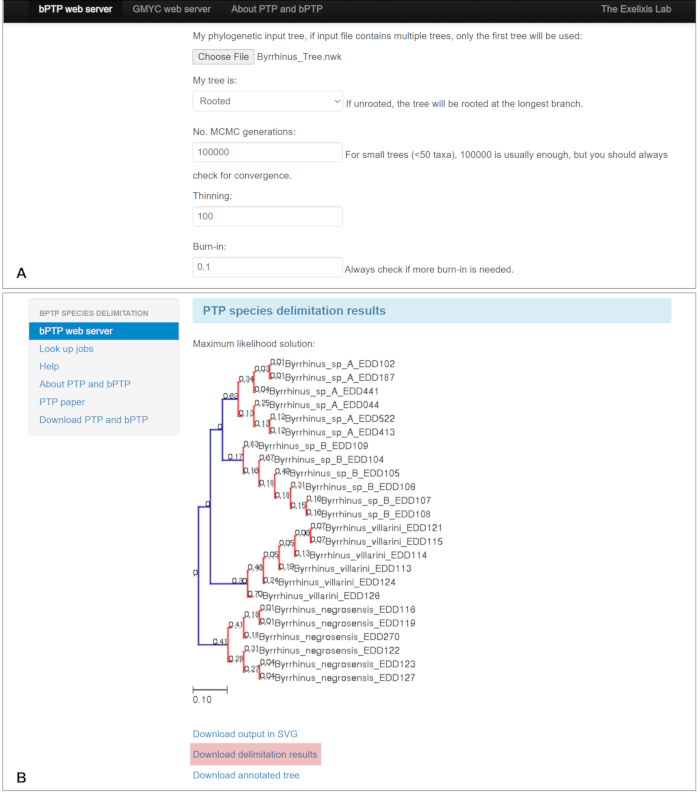
그림 7: 푸아송 트리 프로세스에 의한 분자 종 구분. (A) 입력 매개변수를 보여주는 창. (B) 구분 결과(빨간색 상자)가 포함된 링크가 있는 PTP 웹 서버의 결과 창. 이 그림의 더 큰 버전을 보려면 여기를 클릭하십시오.
7. mPTP(Multi-rate Poisson Tree Processes)에 의한 구분
- mPTP 웹 서버로 이동합니다 https://mptp.h-its.org/#/tree
- newick 파일을 회색 사각형으로 드래그하거나 사각형을 클릭하여 업로드합니다. 데이터가 동일한 페이지에 로드되면 Proceed to outgroup selection(아웃그룹 선택 진행)을 클릭합니다(그림 8A).
- Outgroup specification 페이지에서 outgroup 표본의 taxa labels 옆에 있는 상자를 클릭하여 outgroup을 선택합니다. 시퀀스 하단에 있는 Crop Outgroup 옵션을 클릭합니다. 모델 선택을 클릭합니다.
- MPTP를 클릭한 다음 시각화 옵션을 클릭합니다. Visualization options(시각화 옵션) 페이지에서 기본 설정을 적용합니다.
참고: 또는 SVG 너비 아래에 값(px)을 입력하여 전체 이미지 크기를 조정할 수 있습니다. SVG 글꼴 크기, 팁 사이의 공간, 왼쪽 여백, 오른쪽 여백, 위쪽 여백 및 아래쪽 여백에서 원하는 크기(px)를 입력하여 텍스트의 글꼴과 간격을 조정할 수 있습니다. - 연락처 세부 정보를 클릭합니다. 나중에 결과를 참조할 수 있도록 이메일 주소를 입력합니다(선택 사항).
- Overview( 개요)를 클릭합니다. taxa 입력의 수와 선택한 outgroups를 검토해야 합니다.
- Submit( 제출)을 클릭합니다. Downloadable Files(다운로드 가능한 파일 )(그림 8B)에서 파일을 마우스 오른쪽 단추로 클릭하고 Save as...(다른 이름으로 저장...) 를 선택하여 결과를 저장합니다.
참고: 출력 텍스트 파일은 결과 시작 부분에 구분된 종의 총 수를 나타냅니다. 그런 다음 각 클러스터 아래에 속하는 시퀀스를 표시합니다. 이러한 클러스터와 해당 시퀀스는 .svg 파일에서 생성된 트리와 유사하게 정렬됩니다. mPTP SVG 파일에 시퀀스의 클러스터링이 표시됩니다. 클러스터는 트리를 따라 빨간색 가지로 연결된 시퀀스 그룹으로 표시됩니다. 고립된 각 빨간색 분기 집합은 단일 MOTU를 나타냅니다.
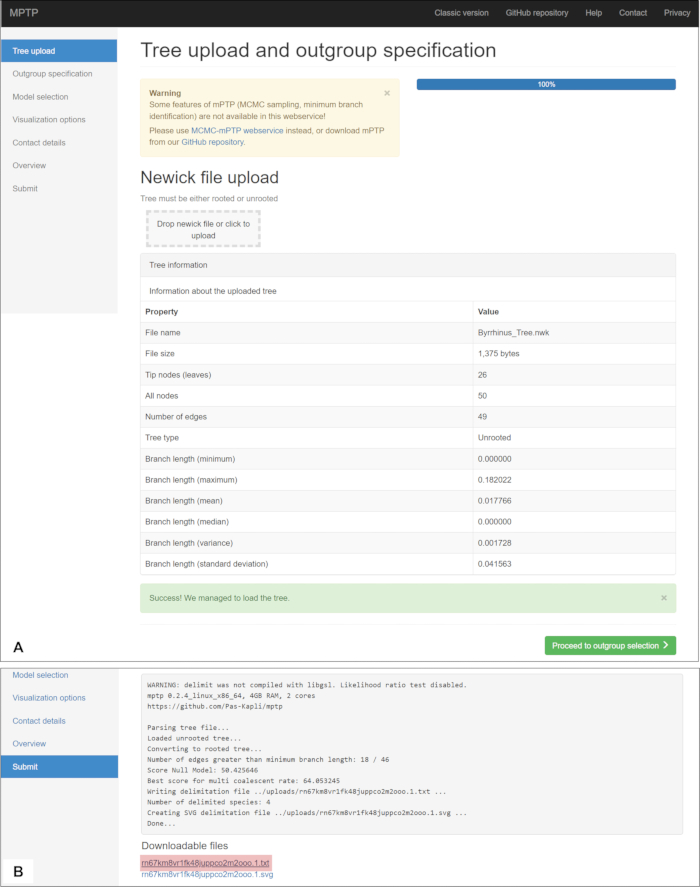
그림 8: 다중 속도 푸아송 트리 프로세스에 의한 분자 종 구분. (A) 업로드된 트리에 대한 mPTP 읽기 정보를 표시하는 창. (B) 구분 결과가 포함된 링크가 있는 mPTP 웹 서버의 결과 창(빨간색 상자). 이 그림의 더 큰 버전을 보려면 여기를 클릭하십시오.
8. MOTU 생성
- 사진 편집기 프로그램이나 PowerPoint를 사용하여 트리를 엽니다.
- 각 분자 종 구분 접근법의 결과를 나타내는 막대를 만듭니다(샘플은 그림 9 및 그림 10 참조). 모든 단일 막대가 분자 클러스터에 포함된 서열과 정렬되는지 확인합니다.
- 이 두 가지 방법 중 하나로 MOTU를 결정한다74
- 모든 접근 방식이 주어진 분자 클러스터에 대해 동일한 결과를 생성하는 경우 합의에 따라 분자 클러스터를 MOTU로 세웁니다.
- 대부분의 접근 방식이 주어진 분자 클러스터에 대해 동일한 결과를 생성하는 경우 다수결로 분자 클러스터를 MOTU로 세웁니다.
액세스가 제한되었습니다. 이 콘텐츠를 보려면 로그인하거나 체험판을 시작하세요.
결과
이 기사에서는 TaxonDNA, K2P, ASAP, PTP의 두 가지 변형 및 mPTP를 포함하는 분자 종 구분 혼합물 파이프라인을 수생 및 강기슭 딱정벌레에 구현했습니다. 6가지 접근 방식 각각의 결과를 '분자 클러스터'라고 하며, 요약을 '분자 조작 분류 단위' 또는 MOTU75라고 합니다.
혼합물 파이프라인은 두 개의 데이터 세트에서 테스트되었습니다. 첫 번째 데이터셋(표 1, 그림 9)은 필리핀에서 수집된 1858마리의 딱정벌레인 Byrrhinus Motschulsky의 COI-3' 염기서열 24개로 구성되어 있으며, 2개의 미확인 Limnichus Latreille, 1829종76 종이 외집단으로 구성되어 있습니다. Byrrhinus 염기서열에는 K2P 구...
액세스가 제한되었습니다. 이 콘텐츠를 보려면 로그인하거나 체험판을 시작하세요.
토론
DNA 염기서열, 특히 COI49는 생물 식별 시스템(46)을 위해 온라인 공개 저장소(54,55,79,80)의 참조 서열(reference sequences) 22,53,78과 비교될 수 있지만, 이러한 접근법은 이용 가능한 증착된 서열에 의해 제한된다. 반대로, 분자 종 구분(molecular species delimitation)을 사용하면 종 한계를 설정하고 서열 저장소(sequenc...
액세스가 제한되었습니다. 이 콘텐츠를 보려면 로그인하거나 체험판을 시작하세요.
공개 사항
우리는 공개 할 것이 없습니다.
감사의 글
우리는 생물다양성 표본 채취를 수행할 수 있도록 사전 사전 동의를 해준 수산 및 수산 자원국(BFAR)과 관련 지방 정부 기관에 감사드립니다. 분류학 작업에 대한 지침을 제공해 주신 Hendrik Freitag 박사에게 감사드립니다. 또한 도움이 되고 건설적인 의견을 제시해 주신 검토자와 편집자분께도 감사드립니다. 마지막으로, 이 연구에 자금을 지원해 주신 University Research Council Big Project Grant(URC 2022-09)와 Ateneo de Manila University의 Open Access Publication Grant, Ateneo Research Institute of Science and Engineering의 환경 리더십을 위한 SC Johnson Student Research and Development Fund, 그리고 이 연구에 자금을 지원해 주신 LinneSys : Systematics Research Fund of the Linnean Society of London과 Systematics Association에 깊은 감사를 표합니다.
액세스가 제한되었습니다. 이 콘텐츠를 보려면 로그인하거나 체험판을 시작하세요.
재료
| 이름 | 회사 | 카탈로그 번호 | 댓글 |
|---|---|---|---|
| 최대한 빨리 | 스파르트 탐험가 | https://bioinfo.mnhn.fr/abi/public/asap/asapweb.html | |
| 컴퓨터 | 모든 처리 장치 | ||
| 메가 X | MEGA 소프트웨어 | https://www.megasoftware.net/ | |
| mPTP 웹 서버 | https://mptp.h-its.org/#/tree | ||
| PTP 웹 서버 | 하이델베르크 이론 연구소(HITS) | https://species.h-its.org/ptp/ | |
| 종 식별자 | https://taxondna.sourceforge.net/ |
참고문헌
- Ceballos, G., Ehrlich, P. R. Mammal population losses and the extinction crisis. Science. 296 (5569), 904-907 (2002).
- Dirzo, R., et al. Defaunation in the Anthropocene. Science. 345 (6195), 401-406 (2014).
- Cardoso, P., et al. Scientists' warning to humanity on insect extinctions. Biol Conserv. 242, 108426(2020).
- Wagner, D. L., Grames, E. M., Forister, M. L., Berenbaum, M. R., Stopak, D. Insect decline in the Anthropocene: Death by a thousand cuts. Proc Natl Acad Sci U S A. 118 (2), 1-10 (2021).
- Steffen, W., Crutzen, P. J., McNeill, J. R. Welcome to the Anthropocene. Ambio. 36 (8), 614-621 (2007).
- de Carvalho, M. R., et al. Taxonomic impediment or impediment to taxonomy? A commentary on systematics and the cybertaxonomic-automation paradigm. Evol Biol. 34 (3-4), 140-143 (2007).
- Satler, J. D., Carstens, B. C., Hedin, M. Multilocus species delimitation in a complex of morphologically conserved trapdoor spiders (Mygalomorphae, Antrodiaetidae, Aliatypus). Syst Biol. 62 (6), 805-823 (2013).
- Arribas, P., Andújar, C., Sánchez-Fernández, D., Abellán, P., Millán, A. Integrative taxonomy and conservation of cryptic beetles in the Mediterranean region (Hydrophilidae). Zool Scr. 42 (2), 182-200 (2013).
- Baker, K., et al. Carpooling with ecologists, geographers and taxonomists: Perceptions from conducting environmental research in tropical regions. Biodivers Conserv. 28 (4), 975-981 (2019).
- Tan, D. S. H., Ang, Y., Lim, G. S., Bin Ismail, M. R., Meier, R. From "cryptic species" to integrative taxonomy: An iterative process involving DNA sequences, morphology, and behaviour leads to the resurrection of Sepsis pyrrhosoma (Sepsidae: Diptera). Zool Scr. 39 (1), 51-61 (2010).
- Tan, M. K., Storozhenko, S. Y., Hwang, W. S., Meier, R. Integrative taxonomy reveals two sympatric species of the genus Eucriotettix Hebard, 1930 (Orthoptera: Tetrigidae). Zootaxa. 4268 (3), 377-394 (2017).
- Yule, C. M. Freshwater invertebrates. Freshwater Invertebrates of the Malaysian Region. , 23-31 (2004).
- Komarek, A., Jäch, M. A., Ji, L. Hydrophilidae: I. Check list and key to Palearctic and Oriental genera of aquatic Hydrophilidae (Coleoptera). Water Beetles of China. 3, 383-395 (2003).
- Rudoy, A., Ribera, I. The macroevolution of size and complexity in insect male genitalia. PeerJ. 4, e1882(2016).
- Rudoy, A., Beutel, R. G., Ribera, I. Evolution of the male genitalia in the genus Limnebius Leach, 1815 (Coleoptera, Hydraenidae). Zool J Linn Soc. 178, 97-127 (2016).
- Shapiro, A. The lock-and-key hypothesis: Evolutionary and biosystematic interpretation of insect genitalia. Annu Rev Entomol. 34 (1), 231-245 (1989).
- Scotland, R., Hughes, C., Bailey, D., Wortley, A. The big machine and the much-maligned taxonomist. Syst Biodivers. 1 (2), 139-143 (2003).
- Vinarski, M. V. Roots of the taxonomic impediment: Is the "integrativeness" a remedy. Integr Zool. 15 (1), 2-15 (2020).
- Cardoso, P., Erwin, T. L., Borges, P. A. V., New, T. R. The seven impediments in invertebrate conservation and how to overcome them. Biol Conserv. 144 (11), 2647-2655 (2011).
- Engel, M. S., et al. The taxonomic impediment: A shortage of taxonomists, not the lack of technical approaches. Zool J Linn Soc. XX, 1-7 (2021).
- Tancoigne, E., Dubois, A. Cladistics taxonomy: No decline, but inertia. Cladistics. , 1-4 (2013).
- Riedel, A., Sagata, K., Suhardjono, Y. R., Tänzler, R., Balke, M. Integrative taxonomy on the fast track: Towards more sustainability in biodiversity research. Front Zool. 10 (15), 1-9 (2013).
- Dayrat, B. Towards integrative taxonomy. Biol J Linn Soc. 85 (3), 407-415 (2005).
- Bickford, D., et al. Cryptic species as a window on diversity and conservation. Trends Ecol Evol. 22 (3), 148-155 (2007).
- Page, R. D. M. DNA barcoding and taxonomy: Dark taxa and dark texts. Philos Trans R Soc Lond B Biol Sci. 371 (1702), 20150334(2016).
- Morinière, J., et al. A DNA barcode library for 5,200 German flies and midges (Insecta: Diptera) and its implications for metabarcoding-based biomonitoring. Mol Ecol Resour. 19 (4), 900-928 (2019).
- Hartop, E., Srivathsan, A., Ronquist, F., Meier, R. Towards large-scale integrative taxonomy (LIT): Resolving the data conundrum for dark taxa. Syst Biol. 71 (6), 1404-1422 (2022).
- Fossen, E. I., Ekrem, T., Nilsson, A. N., Bergsten, J. Species delimitation in northern European water scavenger beetles of the genus Hydrobius (Coleoptera, Hydrophilidae). ZooKeys. 564, 71-120 (2016).
- Bálint, M., et al. Cryptic biodiversity loss linked to global climate change. Nat Clim Change. 1 (6), 313-318 (2011).
- Padial, J. M., De La Riva, I. A response to recent proposals for integrative taxonomy. Biol J Linn Soc. 101 (3), 747-756 (2010).
- Andújar, C., Arribas, P., Ruiz, C., Serrano, J., Gómez-Zurita, J. Integration of conflict into integrative taxonomy: Fitting hybridization in species delimitation of Mesocarabus (Coleoptera: Carabidae). Mol Ecol. 23 (17), 4344-4361 (2014).
- Schlick-Steiner, B. C., et al. Integrative taxonomy: A multisource approach to exploring biodiversity. Annu Rev Entomol. 55 (1), 421-438 (2010).
- Stüben, P. E., Astrin, J. J. Integrative taxonomy, phylogeny, and new species of the weevil genus Onyxacalles Stüben (Coleoptera: Curculionidae: Cryptorhynchinae). Psyche (Lond). 2012, 1-22 (2012).
- Hawlitschek, O., et al. Pleistocene climate change promoted rapid diversification of aquatic invertebrates in Southeast Australia. BMC Evol Biol. 12 (142), 1-15 (2012).
- Delocado, E. D., Freitag, H. Two new species of Byrrhinus Motschulsky, 1858 (Coleoptera, Limnichidae, Limnichinae) from Negros, Philippines. ZooKeys. 1070, 51-72 (2021).
- De Vera, G. C. M., Sia, J. I. L., Freitag, H., Delocado, E. D. The first new species of Leptelmis Sharp, 1888 (Coleoptera, Elmidae) from the Philippines in the last 50 years. Tijdschr Entomol. 166 (2-3), 175-186 (2023).
- Seno, C. B. N., Delocado, E. D., Freitag, H. Three new species of Ancyronyx Erichson, 1847 (Coleoptera, Elmidae) from Mindanao, Philippines. Tijdschr Entomol. 72, 61-80 (2022).
- López-López, A., Hudson, P., Galián, J. Islands in the desert: Species delimitation and evolutionary history of Pseudotetracha tiger beetles (Coleoptera: Cicindelidae: Megacephalini) from Australian salt lakes. Mol Phylogenet Evol. 101, 279-285 (2016).
- Ibarra, J. W. B., Bantiding, F. J. A., Delocado, E. D. First Georissidae (Coleoptera) from the Philippines with description of two new species of Georissus Latreille, 1809. Tijdschr Entomol. , 45-58 (2025).
- Boonsoong, B., Sartori, M. Review and integrative taxonomy of the genus Prosopistoma Latreille, 1833 (Ephemeroptera, Prosopistomatidae) in Thailand, with description of a new species. ZooKeys. 825, 123-144 (2019).
- Wang, Y., Nansen, C., Zhang, Y. Integrative insect taxonomy based on morphology, mitochondrial DNA, and hyperspectral reflectance profiling. Zool J Linn Soc. 177 (2), 378-394 (2016).
- Schutze, M. K., et al. One and the same: Integrative taxonomic evidence that Bactrocera invadens (Diptera: Tephritidae) is the same species as the Oriental fruit fly Bactrocera dorsalis. Syst Entomol. 40 (2), 472-486 (2015).
- Schär, S., et al. Integrative biodiversity inventory of ants from a Sicilian archipelago reveals high diversity on young volcanic islands (Hymenoptera: Formicidae). Org Divers Evol. 20, 405-416 (2020).
- Ševčík, J., et al. Integrative taxonomy of Central European Planetella (Diptera: Cecidomyiidae) indicates high species diversity, intraspecific variation and low host specificity. Acta Entomol Musei Natl Pragae. 63 (2), 413-450 (2023).
- Mengual, X., Ståhls, G., Vujić, A., Marcos-García, M. Á Integrative taxonomy of Iberian Merodon species (Diptera, Syrphidae). Zootaxa. 1377, 1-26 (2006).
- Hebert, P. D. N., et al. Biological identifications through DNA barcodes. Proc R Soc B Biol Sci. 270 (1512), 313-321 (2003).
- Hebert, P. D. N., et al. Ten species in one: DNA barcoding reveals cryptic species in the neotropical skipper butterfly Astraptes fulgerator. Proc Natl Acad Sci U S A. 101 (41), 14812-14817 (2004).
- Hebert, P. D. N., Gregory, T. R. The promise of DNA barcoding for taxonomy. Syst Biol. 54 (5), 852-859 (2005).
- Hebert, P. D. N., Ratnasingham, S., DeWaard, J. R. Barcoding animal life: Cytochrome c oxidase subunit 1 divergences among closely related species. Proc R Soc Lond B. 270 (Suppl), S96-S99 (2003).
- Simon, C., et al. Evolution, weighting, and phylogenetic utility of mitochondrial gene sequences and a compilation of conserved polymerase chain reaction primers. Ann Entomol Soc Am. 87 (6), 651-701 (1994).
- Hendrich, L., et al. Mitochondrial Cox1 sequence data reliably uncover patterns of insect diversity but suffer from high lineage-idiosyncratic error rates. PLoS ONE. 5 (12), e14448(2010).
- Balke, M., et al. Suggestions for a molecular biodiversity assessment of Southeast Asian freshwater invertebrates: Lessons from the megadiverse beetles (Coleoptera). J Limnol. 72 (Suppl 2), 61-68 (2013).
- Virgilio, M., et al. Comparative performances of DNA barcoding across insect orders. BMC Bioinformatics. 11, 206(2010).
- Benson, D. A., et al. GenBank. Nucleic Acids Res. 41 (D1), 36-42 (2013).
- Ratnasingham, S., Hebert, P. D. N. BOLD: The barcode of life data system. Mol Ecol Notes. 7, 355-364 (2007).
- Pons, J., et al. Sequence-based species delimitation for the DNA taxonomy of undescribed insects. Syst Biol. 55 (4), 595-609 (2006).
- Puillandre, N., et al. automatic barcode gap discovery for primary species delimitation. Mol Ecol. 21 (8), 1864-1877 (2012).
- Fontaneto, D., Flot, J. F., Tang, C. Q. Guidelines for DNA taxonomy, with a focus on the meiofauna. Mar Biodivers. 45 (3), 433-451 (2015).
- Balke, M., et al. New Guinea highland origin of a widespread arthropod supertramp. Proc R Soc B Biol Sci. 276 (1666), 2359-2367 (2009).
- Meier, R., et al. DNA barcoding and taxonomy in Diptera: A tale of high intraspecific variability and low identification success. Syst Biol. 55 (5), 715-728 (2006).
- Kimura, M. A simple method for estimating evolutionary rates of base substitutions through comparative studies of nucleotide sequences. J Mol Evol. 16 (2), 111-120 (1980).
- Puillandre, N., Brouillet, S., Achaz, G. ASAP: Assemble species by automatic partitioning. Mol Ecol Resour. 21 (2), 609-620 (2021).
- Wiens, J. J., Penkrot, T. A. Delimiting species using DNA and morphological variation and discordant species limits in spiny lizards (Sceloporus). Syst Biol. 51 (1), 69-91 (2002).
- Fujisawa, T., Barraclough, T. G. Delimiting species using single-locus data and the generalized mixed Yule coalescent approach: A revised method and evaluation on simulated data sets. Syst Biol. 62 (5), 707-724 (2013).
- Yang, Z., Rannala, B. Unguided species delimitation using DNA sequence data from multiple loci. Mol Biol Evol. 31 (12), 3125-3135 (2014).
- Leaché, A. D., Fujita, M. K. Bayesian species delimitation in West African forest geckos (Hemidactylus fasciatus). Proc R Soc B Biol Sci. 277 (1697), 3071-3077 (2010).
- Luo, A., et al. Comparison of methods for molecular species delimitation across a range of speciation scenarios. Syst Biol. 67 (5), 830-846 (2018).
- Zhang, J., et al. A general species delimitation method with applications to phylogenetic placements. Bioinformatics. 29 (22), 2869-2876 (2013).
- Kapli, P., et al. Multi-rate Poisson tree processes for single-locus species delimitation under maximum likelihood and Markov chain Monte Carlo. Bioinformatics. 33 (11), 1630-1638 (2017).
- Sanchez, E. G. S., Delocado, E. D., Freitag, H. Two new species of Anacaena Thomson, 1859 (Coleoptera, Hydrophilidae) from the Philippines. ZooKeys. 1112, 11-25 (2022).
- Sanger, F., Coulson, A. R. A rapid method for determining sequences in DNA by primed synthesis with DNA polymerase. J Mol Biol. 94 (3), 441-448 (1975).
- Kumar, S., et al. MEGA X: Molecular evolutionary genetics analysis across computing platforms. Mol Biol Evol. 35 (6), 1547-1549 (2018).
- Thompson, J. D., Higgins, D. G., Gibson, T. J. CLUSTAL W: Improving the sensitivity of progressive multiple sequence alignment through sequence weighting, position-specific gap penalties and weight matrix choice. Nucleic Acids Res. 22, 4673-4680 (1994).
- Pentinsaari, M., Vos, R., Mutanen, M. Algorithmic single-locus species delimitation: Effects of sampling effort, variation and nonmonophyly in four methods and 1870 species of beetles. Mol Ecol Resour. 17 (3), 393-404 (2017).
- Galimberti, A., et al. Integrated operational taxonomic units (IOTUs) in echolocating bats: A bridge between molecular and traditional taxonomy. PLoS ONE. 7 (6), e40122(2012).
- Kundrata, R., Jäch, M. A., Bocak, L. Molecular phylogeny of the Byrrhoidea-Buprestoidea complex (Coleoptera, Elateriformia). Zool Scr. 46 (2), 150-164 (2017).
- Komarek, A., Freitag, H. Taxonomic revision of Agraphydrus Règimbart, 1903 V. Philippine species and their first DNA barcodes. Koleopt Rundsch. 90, 201-242 (2020).
- Tautz, D., et al. A plea for DNA taxonomy. Trends Ecol Evol. 18 (2), 70-74 (2003).
- Altschul, S. F., et al. Basic local alignment search tool. J Mol Biol. 215 (3), 403-410 (1990).
- Porter, T., Hajibabaei, M. Over 2.5 million COI sequences in GenBank and growing. bioRxiv. , 353904(2018).
- Gómez, R. A., Reddell, J., Will, K., Moore, W. Up high and down low: Molecular systematics and insight into the diversification of the ground beetle genus Rhadine LeConte. Mol Phylogenet Evol. 98, 161-175 (2016).
- Kodada, J., et al. Ancyronyx clisteri, a new spider riffle beetle species from Borneo, redescription of A. sarawacensis Jäch including a description of the larva and new distribution data for A. procerus Jäch using DNA barcodes (Coleoptera, Elmidae). ZooKeys. 912, 25-64 (2020).
- Hajibabaei, M., Janzen, D. H., Burns, J. M., Hallwachs, W., Hebert, P. D. N. DNA barcodes distinguish species of tropical Lepidoptera. Proc Natl Acad Sci U S A. 103 (4), 968-971 (2006).
- Yeo, D., Srivathsan, A., Meier, R. Longer is not always better: Optimizing barcode length for large-scale species discovery and identification. Syst Biol. 69 (5), 999-1015 (2020).
- Sabordo, M. R., Delocado, E., Freitag, H. Two new species of the genus Ancyronyx Erichson, 1847 from the island of Negros, Philippines (Insecta, Coleoptera, Elmidae). Tijdschr Entomol. 163 (1), 13-30 (2020).
- Astrin, J. J., et al. Exploring diversity in cryptorhynchine weevils (Coleoptera) using distance-, character- and tree-based species delineation. Mol Phylogenet Evol. 63 (1), 1-14 (2012).
- Pritchard, J. K., Stephens, M., Donnelly, P. Inference of population structure using multilocus genotype data. Genetics. 155, 945-959 (2000).
- Huelsenbeck, J. P., Andolfatto, P., Huelsenbeck, E. T. Structurama: Bayesian inference of population structure. Evol Bioinform. 7, 55-59 (2011).
- Hausdorf, B., Hennig, C. Species delimitation using dominant and codominant multilocus markers. Syst Biol. 59 (5), 491-503 (2010).
- Fujita, M. K., et al. Coalescent-based species delimitation in an integrative taxonomy. Trends Ecol Evol. 27 (9), 480-488 (2012).
- Monaghan, M. T., et al. Accelerated species inventory on Madagascar using coalescent-based models of species delineation. Syst Biol. 58 (3), 298-311 (2009).
- Yang, Z., Rannala, B. Bayesian species delimitation using multilocus sequence data. Proc Natl Acad Sci U S A. 107 (20), 9264-9269 (2010).
- Ence, D. D., Carstens, B. C. SpedeSTEM: A rapid and accurate method for species delimitation. Mol Ecol Resour. 11 (3), 473-480 (2011).
- de Queiroz, K. Species concepts and species delimitation. Syst Biol. 56 (6), 879-886 (2007).
- Blair, C., Bryson, R. W. Cryptic diversity and discordance in single-locus species delimitation methods within horned lizards (Phrynosomatidae: Phrynosoma). Mol Ecol Resour. 17 (6), 1168-1182 (2017).
- Dellicour, S., Flot, J. F. Delimiting species-poor data sets using single molecular markers: A study of barcode gaps, haplowebs and GMYC. Syst Biol. 64 (6), 900-908 (2015).
- Dellicour, S., Flot, J. F. The hitchhiker's guide to single-locus species delimitation. Mol Ecol Resour. 18 (6), 1234-1246 (2018).
- Liu, L., et al. Estimating phylogenetic trees from genome-scale data. Ann N Y Acad Sci. 1360 (1), 36-53 (2015).
- Lim, G. S., Balke, M., Meier, R. Determining species boundaries in a world full of rarity: Singletons, species delimitation methods. Syst Biol. 61 (1), 165-169 (2012).
- Zhou, Z., et al. molecular species delimitation based on COI-5P barcode sequences revealed high cryptic/undescribed diversity for Chinese katydids (Orthoptera: Tettigoniidae). BMC Evol Biol. 19 (1), (2019).
- Toussaint, E. F. A., et al. Comparative molecular species delimitation in the charismatic Nawab butterflies (Nymphalidae, Charaxinae, Polyura). Mol Phylogenet Evol. 91, 194-209 (2015).
- Carstens, B. C., Dewey, T. A. Species delimitation using a combined coalescent and information-theoretic approach: An example from North American Myotis bats. Syst Biol. 59 (4), 400-414 (2010).
- Esselstyn, J. A., et al. Single-locus species delimitation: A test of the mixed Yule-coalescent model, with an empirical application to Philippine round-leaf bats. Proc R Soc Lond B. 279 (1743), 3678-3686 (2012).
- Stech, M., et al. Molecular species delimitation in the Racomitrium canescens complex (Grimmiaceae) and implications for DNA barcoding of species complexes in mosses. PLoS One. 8 (1), e53134(2013).
- Kekkonen, M., Hebert, P. D. N. DNA barcode-based delineation of putative species: Efficient start for taxonomic workflows. Mol Ecol Resour. 14 (4), 706-715 (2014).
- Meier, R., et al. "Dark taxonomy": A new protocol for overcoming the taxonomic impediments for dark taxa and broadening the taxon base for biodiversity assessment. Cladistics. 41, 223-238 (2025).
- Ebach, M. C., Holdrege, C. DNA barcoding is no substitute for taxonomy. Nature. 434, 697(2005).
- Ebach, M. C., Holdrege, C. More taxonomy, not DNA barcoding. BioScience. 55 (10), 822-823 (2005).
- Mora, C., et al. How many species are there on Earth and in the ocean. PLoS Biol. 9 (8), e1001127(2011).
- Stork, N. E. How many species of insects and other terrestrial arthropods are there on Earth. Annu Rev Entomol. 63, 31-45 (2018).
- Scheffers, B. R., et al. What we know and don't know about Earth's missing biodiversity. Trends Ecol Evol. 27 (9), 501-510 (2012).
- Carbayo, F., Marques, A. C. The cost of describing the entire animal kingdom. Trends Ecol Evol. 26 (4), 153-154 (2011).
- Walsh, J. C., et al. Trends and biases in the listing and recovery planning for threatened species: An Australian case study. Oryx. 47 (1), 134-143 (2013).
- Carrizo, S. F., et al. Freshwater megafauna: Flagships for freshwater biodiversity under threat. BioScience. 67 (10), 919-927 (2017).
액세스가 제한되었습니다. 이 콘텐츠를 보려면 로그인하거나 체험판을 시작하세요.
재인쇄 및 허가
