This protocol describes the generation and phenotypic characterization of a C57BL/6N-Cracdem1(c.538-83 to c.3352+255 del) mouse model using CRISPR/Cas9 technology to study the role of CRACD in cardiac remodeling following myocardial infarction.
방법 논문
심근경색 후 리모델링 연구를 위한 CRISPR/Cas9 공학 기반 Cracd 결핍 마우스 모델의 생성 및 표현형 특성 분석
이 논문에서
요약
초록
Myocardial infarction (MI) remains a major cause of morbidity and mortality worldwide. This protocol describes a method for generating and characterizing a Cracd-deficient mouse line on the C57BL/6N background using CRISPR/Cas9 technology. Zygotes were co-injected with Cas9 mRNA, a gRNA construct, and a donor template designed to generate a 3153-bp genomic deletion. The edited allele was confirmed by PCR genotyping and Sanger sequencing. To assess the functional role of CRACD in post-MI remodeling, Cracd-deficient and wild-type (WT, C57BL/6N) mice underwent MI induced by permanent ligation of the left anterior descending coronary artery. On postoperative day 7, cardiac function and left ventricular wall motion were assessed using transthoracic echocardiography and speckle-tracking strain imaging, followed by histopathological evaluation with H&E and Masson's trichrome staining. Representative results showed that Cracd-deficient mice exhibited reduced ventricular dilation and preserved systolic function compared to WT controls. This protocol provides a reliable experimental platform for mechanistic studies of CRACD in cardiac pathophysiology.
서론
심근경색(MI)은 전 세계적으로 주요한 이환율 및 사망률의 원인으로 남아 있으며, 전 세계 심혈관 건강에 상당한 부담을 주고 있습니다1. MI 이후의 장기 예후는 주로 좌심실(LV) 리모델링 과정에 의해 결정되는데2, 여기에는 심실 확장, 벽 얇아짐 및 간질성 섬유화가 포함되며3,4, 이는 심부전(HF)으로 진행되는 핵심 요인이 됩니다. MI 후 심장 리모델링으로 인한 심부전의 전 세계적 발생률은 심혈관 질환의 부담을 더욱 가중시킵니다5. 이러한 잘 확립된 임상적 관찰에도 불구하고, 민감하고 재현 가능한 생체 내(in vivo) 모델을 사용하여 MI 후 리모델링에서 특정 유전자의 역할을 평가하는 체계적인 연구가 부족한 실정입니다. 현재 CRISPR/Cas9로 제작된 녹아웃 모델과 고급 스트레인 영상 기술을 결합하여 CRACD와 같은 세포골격 조절 인자를 평가하는 프로토콜은 없습니다. 따라서 정밀한 유전자 조작과 고해상도 심장 표현형 분석이 가능한 방법이 시급히 필요합니다.
KIAA1211로도 알려진 Capping protein inhibiting regulator of actin dynamics (CRACD)는 주로 세포질에 위치하며 세포골격 역학에서 중요한 역할을 하는 액틴 중합 조절 인자입니다6. 이는 액틴 캡핑 단백질(CAPZA1, CAPZA2, CAPZB)과 결합하여 액틴 필라멘트의 barbed end에 캡핑되는 것을 방지함으로써 액틴 중합을 긍정적으로 조절합니다7. 상피 조직에서 CRACD는 액틴 세포골격의 무결성을 유지함으로써 세포 형태와 신호 전달을 유지하는 데 결정적인 역할을 합니다8,9. 종양 세포의 경우, CRACD의 조절 이상은 세포 전이 및 증식의 강화와 관련이 있습니다6,10. 심장에서의 CRACD 역할은 아직 완전히 밝혀지지 않았습니다. 심장 전사체 및 실험적 개입 연구에 따르면 Cracd 유전자 발현은 병리적 스트레스에 반응하며, 심실 리모델링 동안 세포골격 역학과 관련된 유전자들을 조절할 수 있습니다9,11. 또한, CRACD의 억제 단백질인 CapZ는 심장 병리와 밀접하게 연관되어 있는데, CapZ의 인산화는 페닐에프린(phenylephrine)에 의해 유도된 비대에 따른 근원섬유의 성장을 조절합니다12. 본 연구진의 초기 연구 결과, CRACD의 적절한 하향 조절은 급성 허혈 이후 심근 손상을 보호하고 근필라멘트 수축력을 유지시키는 것으로 나타났습니다13. 이러한 발견은 CRACD가 심근경색(MI) 후 부적응성 심실 리모델링에서 역할을 할 가능성을 제기합니다. 그러나 Cracd 결핍이 심근경색 후 리모델링을 조절하는지 테스트하는 체계적인 in vivo 기능 상실 연구는 부족했으며, 이는 주로 허혈성 스트레스 하에서 Cracd 결핍 마우스를 생성하고 표현형을 분석하기 위한 검증된 단계별 프로토콜이 없었기 때문입니다.
구성적 녹아웃 마우스를 제작하기 위한 여러 가지 접근 방식이 존재합니다. 배아줄기(ES) 세포를 이용한 전통적인 상동 재조합 방식은 정밀하지만 비용이 많이 들고 시간이 오래 걸리며(12~18개월), 특정 마우스 계통으로 제한된다는 단점이 있습니다14. ENU (N‑ethyl‑N‑nitrosourea) 돌연변이 유발 방식은 무작위 점 돌연변이를 생성하므로 광범위한 역교배와 시퀀싱이 필요합니다15. 이와 대조적으로, CRISPR/Cas9은 본 연구에서 다음과 같은 뚜렷한 실무적 이점을 제공합니다: (i) 접합자에 직접 주입함으로써 제작 기간을 4~6개월로 단축할 수 있습니다; (ii) 큰 게놈 단편(3153 bp)을 결실시켜 완전한 기능 상실을 보장할 수 있습니다; (iii) 계통 전환 없이 C57BL/6N 배경에서 직접 작동합니다; (iv) 선택 마커를 사용하지 않아 의도치 않은 전사 간섭을 최소화합니다. 따라서 CRISPR/Cas9은 일상적인 심혈관 표현형 분석에 적합한 Cracd 결핍 라인을 제작하는 데 가장 효율적인 선택입니다. 이 기술은 정밀한 in vivo 기능 상실 연구를 수행하는 데 널리 사용되어 왔습니다16,17.
스펙클 추적 변형 영상법(Speckle-tracking strain imaging)은 심근 내 천연 음향 스펙클의 움직임을 프레임별로 추적하는 후처리 기술로, 변형률(strain, 길이의 분율 변화) 및 변형률 속도(strain rate, 변형 속도)와 같은 심근 변형 파라미터를 계산할 수 있게 합니다18. 전반적인 기능 지표(박출률, 분율 단축률, 좌심실 내경)를 제공하며 국소 벽 운동 이상에 상대적으로 둔감한 기존의 M-모드 또는 2차원 심초음파와 달리, 변형 영상법은 분절적 수축 기능을 정량화할 수 있습니다. 이는 특히 경색 후 초기 단계에서 중요한데, 이 시기에는 유의미한 국소 기능 장애에도 불구하고 비경색 분절의 보상적 과운동성으로 인해 전반적인 박출률이 유지될 수 있기 때문입니다. 스펙클 추적법은 표준 평가지표보다 몇 가지 장점을 제공합니다. 즉, 분절 변형률 및 변형률 속도, 변위, 속도를 산출하여 미세한 아임상적 변화를 감지할 수 있으며19, 비가역적 리모델링이 발생하기 전의 비동기화 및 초기 수축 결손을 식별할 수 있고, 허혈에 가장 취약한 층인 심내막하층을 직접 조사할 수 있습니다20. 본 연구에서 CRACD는 미세 수준에서 근섬유 수축력에 영향을 줄 수 있는 세포골격 조절자입니다. 기존의 심강 기반 측정법으로는 이러한 국소적 기계적 효과를 놓치기 쉽습니다. 따라서 본 프로토콜에 스펙클 추적 분석을 통합함으로써 Cracd 결핍의 초기 보호 효과를 감지하는 능력을 향상시킬 수 있습니다. 이에 따라, 본 프로토콜에 스펙클 추적법을 통합하는 것은 특히 초기 확장과 수축 기능 장애가 나타나는 MI 후 첫 일주일 동안 경색 후 리모델링을 평가하기 위한 민감하고 정량적인 도구를 제공합니다21,22.
본 프로토콜은 구성적 녹아웃(constitutive knockout)과 고해상도 이미징의 조합을 사용하여 특정 유전자 결손이 심근경색(MI) 후 급성(7일) 리모델링에 미치는 기능적 영향을 조사하는 연구자를 위해 설계되었습니다. 이는 표적 유전자의 전신 결손이 허용되며, 주요 평가 지표가 초기 수축 기능 및 구조적 변화인 가설 생성 연구에 적합합니다. 하지만 몇 가지 제한 사항을 고려해야 합니다. 첫째, Cracd 결핍 마우스는 전신 녹아웃 모델이므로, 전신적 기여가 작용했을 가능성이 있어 관찰된 심장 보호 효과를 오로지 심근세포 내 CRACD의 결손 덕분이라고만 단정할 수 없습니다. 심장 특이적 결손을 달성하기 위해서는 향후 조건부 녹아웃(conditional knockout) 전략을 이용한 연구가 필요할 것입니다. 둘째, 본 프로토콜은 단일 시점(7일째)에 집중하고 있으며, 만성 리모델링이나 심부전(HF) 진행 과정은 다루지 않습니다. 급성기 이후의 종단적 연구가 요구됩니다. 셋째, 스펙클 추적 분석(speckle‑tracking analysis)은 고품질 이미지(명확한 심내막 경계)와 전용 소프트웨어가 필요하며, 이는 모든 핵심 시설에서 제공되지 않을 수 있습니다. 이러한 제한 사항에도 불구하고, 본 프로토콜은 심근경색 후 심장 리모델링에 관여하는 유전자의 초기 기능적 특성을 규명하기 위한 견고하고 재현 가능한 플랫폼을 제공합니다.
본 연구는 CRISPR/Cas9 시스템을 이용하여 다음을 생성하고 검증하는 것을 목표로 하였다. Cracd-결핍 마우스 모델 (C57BL/6N-Cracd(d)em1 (c.538-83 ~ c.3352+255 결실)) ~의 영향을 조사하기 위해 Cracd 심근경색 후 심장 리모델링 및 심실벽 운동에 미치는 결핍의 영향. 야생형(WT, C57BL/6N) 및 Cracd-결핍 생쥐를 사용하였으며, 심근경색(MI) 1주일 후 종합적인 평가를 수행하였다. 평가 항목에는 일반적인 심초음파 파라미터, 스펙클 추적 변형 분석 및 조직병리학적 평가가 포함되었다. 우리는 초기 리모델링 사건을 포착하고 다음 사항을 결정하기 위해 심근경색 후 초기 단계(7일 차)에 특히 주목하였다. Cracd 결핍은 심근경색(MI)의 급성기 동안 심실 확장과 수축 기능에 영향을 미칩니다. 이러한 결과는 심근경색 후 유해한 심장 리모델링을 조절하는 데 있어 CRACD의 역할에 대한 가치 있는 통찰력을 제공할 것으로 기대됩니다.
프로토콜
All animal experiments were approved by the Institutional Animal Care and Use Committee of the Guangdong Institute of Biotechnology (Approval No. IACUC2025179). The study utilized 20 SPF Cracd-deficient and 20 age- and weight-matched WT mice. All mice were 10–12 weeks old and weighed 20–25 g. All male animals were housed in an AAALAC-accredited facility (License No. SYXK (Yue) 2016-0122) at the Guangdong Institute of Biotechnology (Guangdong Laboratory Animals Monitoring Institute). The housing environment was maintained at 22–25 °C with 50–70% relative humidity under a 12 h light/12 h dark cycle.
1. Generation of Cracd-deficient mice using CRISPR/Cas9
- Use CRISPR/Cas9 gene editing technology to generate Cracd-deficient mice on a C57BL/6N background. Delete the genomic sequence from c.538-83 to c.3352+255 (partial intron 5 to intron 6) of Cracd by homology-directed repair.
NOTE: The mouse Cracd gene (NCBI RefSeq: NM_001163793.1; Ensembl: ENSMUSG00000036377) is located on chromosome 5 and contains 9 exons, with the ATG start codon in exon 2 and the TAA stop codon in exon 9. - Design the sequence of gRNA targeting vector and donor oligonucleotide (with targeting sequence flanked by 120 bp homologous sequences combined on both sides).
- Log in to the NCBI website, select the Primer-BLAST function, and design PCR primers for genotyping.
- Paste the NCBI reference sequence number of Cracd (NM_001163793.1) into the PCR template field, specify the exon range for amplification, and click “Get Primers” to retrieve multiple pairs of candidate primers for PCR-based detection of the deletion and wild-type alleles.
- Design single-guide RNAs (gRNAs) to target sites flanking the intended deletion interval in the Cracd gene.
- Select four gRNA sequences (20 nt upstream of the PAM) using online CRISPR design tools.
- To minimize potential off-target effects, score the candidate gRNAs with CRISPRater and select the two optimal sequences (including the NGG PAM).
NOTE: Example selected sequences:
gRNA-A1: CGGCGCTCTTAACATCCAGAGGG (score: 0.71)
gRNA-A2: CCCTTCAGTCTGGGTAGTAGAGG (score: 0.71)
Accept gRNAs with a CRISPRater score ≥ 0.5. For in vitro validation, accept gRNAs with > 50% cleavage efficiency in a Cas9/gRNA target efficiency detection kit.
- Design a single-stranded donor oligonucleotide to promote efficient joining of the intended breakpoints. Example donor sequence: TTAACCATCAACGGGCCGCTGCAAGGGCTGCTGT
GTCTATA CTCAGGACCACCTGCCCTCTAGAGGCAGGAAGGT
AGAGTTCCAAGCTCTGCTGTGCTAGGTTAAATGCAACTTAACATC. - Co-inject Cas9 mRNA, gRNA and donor oligonucleotide into fertilized eggs to generate Cracd-deficient mice. Prepare Cas9 mRNA and gRNA by in vitro transcription.
- Preparation of gRNA.
- Transcribe gRNAs in vitro from DNA templates using the MEGAshortscript™ T7 transcription kit (see Table of Materials) following the manufacturer's protocol.
- Purify the transcribed gRNAs using an RNA purification kit (see Table of Materials) and elute them in RNase-free water.
- Assess gRNA cleavage activity using an in vitro Cas9/gRNA target efficiency detection kit (see Table of Materials).
- Perform all RNA preparation steps on ice using RNase‑free consumables (pipette tips, tubes, water). Keep RNA samples on ice at all times to prevent degradation.
- To perform the cleavage assay: mix the transcribed gRNA (25 ng/µL) with recombinant Cas9 protein (50 ng/µL) and a PCR-amplified DNA fragment containing the target sequence (50 ng).
- Incubate the reaction at 37 °C for 30 min.
- Run the products on a 2% agarose gel to visualize uncleaved and cleaved bands.
- Calculate cleavage efficiency as the ratio of cleaved band intensity to total (cleaved + uncleaved) band intensity.
- Accept gRNAs with > 50% cleavage efficiency.
- Preparation of Cas9 mRNA.
- Thaw the reagents from the T7 ARCA mRNA Kit (see Table of Materials).
- At room temperature, combine 10 µL of 2× ARCA/NTP mix, 1 µL of template DNA, 2 µL of T7 RNA polymerase mix, and nuclease-free water to 20 µL.
- Mix thoroughly, pulse-spin in a microfuge (5 s at 5000 × g), and incubate at 37 °C for 30 min.
- Remove the template DNA by adding 2 µL of DNase I (1 U/µL), mix well, and incubate at 37 °C for 15 min to obtain Cas9 mRNA. Optionally add 1 µL of RNase inhibitor (40 U/µL) (see Table of Materials) to the reaction to prevent RNA degradation.
- Perform all steps on ice with RNase‑free consumables. Keep the Cas9 mRNA on ice until use.
- Superovulate 4-week-old C57BL/6N female mice by intraperitoneal injection of 5 IU of pregnant mare serum gonadotropin (PMSG), followed 48 h later by 5 IU of human chorionic gonadotropin (hCG).
CAUTION: PMSG and hCG are hormones that may cause skin sensitization. Wear gloves and dispose of needles in a sharps container. - Approximately 14–18 h after hCG injection, euthanize the C57BL/6N female mice and one 8–12-week-old C57BL/6N male mouse by cervical dislocation. Collect oocytes from the oviducts of the females and sperm from the cauda epididymis of the male.
CAUTION: Euthanasia must be performed in accordance with institutional guidelines. Cervical dislocation should only be performed by trained personnel. - Capacitate the sperm in capacitation medium (see Table of Materials).
- Add a small volume of the sperm suspension to the oocytes for in vitro fertilization and co-culture for 3–4 h at 37 °C to obtain fertilized zygotes.
- Dilute the transcribed gRNA and Cas9 mRNA with RNase-free water to working concentrations (typically 25 ng/µL for gRNA and 50 ng/µL for Cas9 mRNA) and donor oligonucleotide at 10 ng/µL.
- Microinject 1–2 pL of the mixture into the cytoplasm of fertilized zygotes using a microinjection system (see Table of Materials).
- Identify healthy zygotes by the presence of two distinct pronuclei and an intact polar body under a stereomicroscope.
- Transplant 300 healthy fertilized zygotes into the oviducts of pseudopregnant female mice that have been mated with vasectomized males.
NOTE: This results in the generation of 2 positive founder mice (F0). - Use RNase‑free water and ice‑cold conditions during dilution to maintain RNA integrity.
- Identify F0 mice by PCR genotyping of tail biopsies (see section 1.6).
- Breed F0 founders with WT mice to generate F1 heterozygous offspring, to obtain germline transmission of the deletion.
- Intercross heterozygous F1 mice to produce F2 homozygous Cracd-deficient mice.
- Preparation of gRNA.
- Genotype by Polymerase Chain Reaction (PCR)
NOTE: The following protocol uses a commercial TIANamp Genomic DNA Kit (see Table of Materials). Buffer GL is the lysis buffer, Buffer GB is the binding buffer, and Buffer WA and Buffer WB are wash buffers.- Place approximately 2–5 mm of mouse tail tissue in a microcentrifuge tube containing 180 µL of Buffer GL, 20 µL of Proteinase K (20 mg/mL stock solution), and 10 µL of RNase A (10 mg/mL stock solution).
- Incubate the sample at 56 °C overnight to digest the tissue.
- Centrifuge the tube at 13800 × g for 2 min at room temperature to pellet tissue debris and transfer the supernatant to a new tube.
- Add 200 µL of Buffer GB and 200 µL of 100% ethanol to the supernatant, mix thoroughly, and apply the mixture to a spin column placed in a collection tube.
- Centrifuge at 13800 × g for 2 min at room temperature and discard the flow-through.
- Add 500 µL of Buffer WA to the column, centrifuge at 13800 × g for 1 min at room temperature and discard the flow-through.
- Carefully add 700 µL of Buffer WB (wash buffer containing ethanol, pre-mixed with 100% ethanol) to the spin column, centrifuge at 13800 × g for 1 min at room temperature and discard the flow-through.
- Apply Buffer WB to the inner wall of the column to wash residual salts.
- Repeat step 1.6.5 once, then transfer the column into a new collection tube and centrifuge at 13800 × g for 2 min at room temperature to dry the membrane and remove residual ethanol.
- Place the column into a new 1.5 mL microcentrifuge tube. Add 50–200 µL of sterilized water or elution buffer (preheated to 65 °C) to the center of the membrane, incubate for 5 min.
- Centrifuge the column at 13800 × g for 2 min at room temperature to elute the DNA.
- To increase DNA yield, either reapply the flow-through to the membrane or add an additional 50–200 µL of sterilized water, incubate for 5 min.
- Perform a final centrifugation at 13800 × g for 2 min.
NOTE: Expect DNA yield of 50–200 ng/µL from tail tissue; A260/A280 ratio of 1.8–2.0 indicates pure DNA.
- Place approximately 2–5 mm of mouse tail tissue in a microcentrifuge tube containing 180 µL of Buffer GL, 20 µL of Proteinase K (20 mg/mL stock solution), and 10 µL of RNase A (10 mg/mL stock solution).
- Genotyping by multiplex PCR using three primers in a single reaction.
- Design three primers to distinguish WT, heterozygous, and homozygous genotypes in one PCR reaction: Forward primer F1 (5’-CAGAAGTCATAGCAGCAAGGCAG-3’, binds upstream of the deletion), Forward primer F2 (5’-GAGGGAATTGAGAGGGAGCC-3’, binds within the deleted region, present only in the WT allele), and Reverse primer R1 (5’-GCCAATTTAGCTGCTTCAAATGTTC-3’, common reverse primer downstream of the deletion).
NOTE: The targeted allele generates a 421 bp amplicon (F1 + R1) only when the deletion is present; the WT allele generates a 357 bp amplicon (F2 + R1) only when the intact allele is present. - Set up the PCR reaction in a 25 µL total volume containing 50–100 ng genomic DNA, 0.2 µM of each primer (F1, F2, and R1), 200 µM dNTPs, 1.5 mM MgCl₂, and 1 U Taq DNA polymerase (see Table of Materials).
- Use the following thermocycling program: initial denaturation at 95 °C for 3 min; 35 cycles of denaturation at 95 °C for 15 s, annealing at 60°C for 15 s, and extension at 72 °C for 25 s; and a final extension at 72 °C for 5 min.
- Separate the PCR products by 1–2% agarose gel electrophoresis (120 V, 30 min) in 1× TAE buffer.
- Genotype interpretation based on band pattern: WT shows only a 357 bp band (F2+R1); Heterozygous shows both 421 bp (F1+R1) and 357 bp (F2+R1) bands; Homozygous shows only a 421 bp band (F1+R1).
- Design three primers to distinguish WT, heterozygous, and homozygous genotypes in one PCR reaction: Forward primer F1 (5’-CAGAAGTCATAGCAGCAAGGCAG-3’, binds upstream of the deletion), Forward primer F2 (5’-GAGGGAATTGAGAGGGAGCC-3’, binds within the deleted region, present only in the WT allele), and Reverse primer R1 (5’-GCCAATTTAGCTGCTTCAAATGTTC-3’, common reverse primer downstream of the deletion).
2. Myocardial infarction model establishment
- Anesthetize the mice via inhalation of 3% isoflurane (delivered in 100% oxygen at 1 L/min), place them in a supine position on a surgical platform, and confirm deep anesthesia by the absence of pedal withdrawal reflex.
CAUTION: Isoflurane is a volatile anesthetic. Use only in a well-ventilated area or under a fume hood to avoid inhalation. - Perform orotracheal intubation using a 20-gauge intravenous catheter sheath. Apply ophthalmic ointment to both eyes to prevent corneal drying during surgery.
- Connect the tube to a mechanical ventilator upon successful intubation to maintain ventilation and anesthesia with 2% isoflurane.
NOTE: Successful intubation is confirmed by visible chest movements synchronized with the ventilator.
- Connect the tube to a mechanical ventilator upon successful intubation to maintain ventilation and anesthesia with 2% isoflurane.
- Remove hair from the anterior chest with depilatory cream. Disinfect the surgical area by applying povidone-iodine and 70% alcohol in a circular motion for multiple times, starting from the center and moving outward.
- After fully exposing the skin, make a 1–1.5 cm incision in the left chest wall between the 2nd and 3rd intercostal spaces to open the thoracic cavity.
- Incise the pericardium to fully expose the heart.
CAUTION: Surgical procedures must be performed under sterile conditions. Use appropriate personal protective equipment (PPE), including gloves and a surgical mask.
- Using the inferior border of the left auricle as a landmark, pass a 7–0 atraumatic suture needle beneath the left anterior descending coronary artery (LAD) approximately 2–3 mm distal to its origin.
- Pass the needle to a depth of approximately 0.5–1 mm and tighten the ligature slowly to avoid myocardial tearing.
- Confirm successful occlusion by observing pallor (whitening) of the left ventricular anterior wall distal to the ligation site within 30 s.
- In sham-operated controls, open the chest and pass the suture beneath the coronary artery without tying the knot.
- After establishing the model, sequentially suture the ribs (4-0 absorbable suture, simple interrupted pattern) and skin (4-0 absorbable suture, continuous pattern) to close the thoracic cavity. Remove the endotracheal tube once the mouse resumes stable spontaneous breathing.
- Place mice on a heating pad (37 °C) until fully conscious.
- Administer postoperative analgesia (e.g., buprenorphine 0.05–0.1 mg/kg, subcutaneously, every 12 h for 48 h) according to institutional IACUC guidelines and closely monitor the postoperative health status for several days.
NOTE: Monitor for signs of distress (hunched posture, ruffled fur, reduced mobility, weight loss > 20%).
- Administer postoperative analgesia (e.g., buprenorphine 0.05–0.1 mg/kg, subcutaneously, every 12 h for 48 h) according to institutional IACUC guidelines and closely monitor the postoperative health status for several days.
- Mortality and exclusion criteria.
- Record the number of mice that die within the first 7 days after MI surgery.
NOTE: In a typical cohort, expect a mortality rate of approximately 10–20% by postoperative day 7, with no significant difference between WT and Cracd‑deficient mice. Common causes of death include extensive infarction leading to acute heart failure, surgical bleeding, or pneumothorax. Exclude any mouse with persistent arrhythmia (heart rate < 350 bpm) or signs of severe distress (e.g., hunched posture, ruffled fur, weight loss > 20%) from subsequent echocardiographic and histological analyses. For sham‑operated mice, mortality should be < 5%.
- Record the number of mice that die within the first 7 days after MI surgery.
3. Echocardiographic assessment
- Animal Preparation and Anesthesia
- Power on the high-resolution small animal ultrasound imaging system (see Table of Materials) and its integrated heated stage.
- Ensure that the appropriate high-frequency transducer is securely connected to the mounting apparatus following the manufacturer’s instructions. Set the temperature of the heated stage to 37 °C and allow it to stabilize.
- Place mice in an induction chamber and anesthetize them with 3% isoflurane in oxygen (1–2 L/min) until the pedal withdrawal reflex is absent. Transfer anesthetized mice to the heated platform in a supine position.
- Maintain anesthesia with 1–1.5% isoflurane delivered via a nose cone, adjusting to maintain heart rate between 450–550 beats per min.
- Apply ophthalmic ointment to both eyes to prevent corneal drying.
- Shave the thoracic region, evenly apply depilatory cream for no longer than 3 min, then remove the depilatory cream thoroughly with wet gauze.
- Rinse the skin gently with warm saline if necessary and dry the area. Attach surface ECG electrodes to the limbs using electrode gel at the contact sites and secure them with tape.
NOTE: Confirm stable ECG and heart rate within 450–550 bpm before proceeding to ultrasound imaging.
- Power on the high-resolution small animal ultrasound imaging system (see Table of Materials) and its integrated heated stage.
- Conventional Echocardiography Image Acquisition
- Position the mouse in a horizontal, supine posture on the heated stage, with a slight leftward tilt if needed to optimize cardiac imaging.
- Apply a generous amount of pre-warmed ultrasound coupling gel to the hairless left precordial region, avoiding air bubbles.
- Place the transducer gently on the chest wall at the left parasternal position. Adjust its orientation so that the index mark points toward the mouse’s right shoulder and fine-tune the angle and pressure to optimize image quality.
- Switch to B-mode (two-dimensional) imaging, adjust depth, focus zone, and frame rate to obtain a clear parasternal long-axis view of the left ventricle. Acceptable image quality requires clear visualization of the endocardial border with no dropouts.
- Once the heart rate stabilizes (450–550 bpm), acquire three separate parasternal long-axis B-mode cine loops, each containing at least 3–5 consecutive cardiac cycles.
- Save each loop by pressing “Cine Store”, and store representative still frames using “Frame Store”.
- From the long‑axis view, rotate the transducer 90° clockwise to obtain a short‑axis view at the mid‑papillary level.
- Acquire three separate short‑axis B‑mode cine loops (each with ≥ 3–5 cycles).
- Activate M‑mode, position the cursor perpendicular to the interventricular septum and posterior wall, and record three separate M‑mode tracings.
NOTE: Acceptable M‑mode tracings require clear endocardial borders throughout the cardiac cycle.
- Use the VevoLab 3.2.0 software (see Table of Materials) to measure the following parameters from M‑mode tracings according to the American Society of Echocardiography leading‑edge method: interventricular septum thickness at diastole and systole (IVSd, IVSs), left ventricular internal diameter at diastole and systole (LVIDd, LVIDs), and left ventricular posterior wall thickness at diastole and systole (LVPWd, LVPWs).
- Calculate left ventricular ejection fraction (EF) and fractional shortening (FS) using the Teichholz formula: EF (%) = [(LV Vold - LV Vols) / LV Vold] × 100, LV Vold = ((7 / (2.4 + LVIDd)) × LVIDd3), LV Vol;s = ((7 / (2.4 + LVIDs)) × LVIDs3), FS (%) = [(LVIDd – LVIDs) / LVIDd] × 100.
NOTE: For each mouse, measurements were averaged from three consecutive cardiac cycles per M‑mode recording, and the average was taken across three separate recordings, resulting in a total of 9 measurements per parameter per mouse.
- Calculate left ventricular ejection fraction (EF) and fractional shortening (FS) using the Teichholz formula: EF (%) = [(LV Vold - LV Vols) / LV Vold] × 100, LV Vold = ((7 / (2.4 + LVIDd)) × LVIDd3), LV Vol;s = ((7 / (2.4 + LVIDs)) × LVIDs3), FS (%) = [(LVIDd – LVIDs) / LVIDd] × 100.
- Position the mouse in a horizontal, supine posture on the heated stage, with a slight leftward tilt if needed to optimize cardiac imaging.
- Speckle-Tracking Strain Analysis
- Perform speckle-tracking analysis using the dedicated analysis software (VevoStrain module within VevoLab 3.2.0).
- Open a clear parasternal long-axis B-mode cine loop, select "Vevo Strain" to enter the strain analysis mode, retain only complete cardiac cycles, and choose "Long Axis".
- Manually trace the endocardial border at the end‑diastolic frame. After the endocardial border is drawn, the software automatically generates an epicardial border (adjust as needed). Then start the strain analysis and activate the "toggle contour/vector/orbit line/B mode" function to visualize the motion trajectory.
- Assess tracking quality via the colour‑coded mesh: it should appear green, closely follow the endocardial and epicardial borders without jerking, and move synchronously with myocardial contraction/relaxation. If not, manually refine the borders and re‑analyze.
- Activate "Time‑to‑peak analysis" to divide the left ventricle into six segments (basal anterior, mid anterior, apical anterior, apical posterior, mid posterior, basal posterior), with each colour representing an individual segment. Once satisfactory tracking is achieved, export data for wall motion parameters: velocity (cm/s), displacement (cm), strain (%), strain rate (1/s) for both longitudinal and radial.
NOTE: If tracking quality remains poor after three acquisition attempts (e.g., erratic strain curves, or inability to visualise clear motion trajectories), exclude the mouse from strain analysis.
- Perform speckle-tracking analysis using the dedicated analysis software (VevoStrain module within VevoLab 3.2.0).
4. Histopathological analysis
- After echocardiography, administer a lethal dose of isoflurane to deeply anesthetized mice and apply a secondary physical method (e.g., cervical dislocation) according to institutional guidelines.
- Open the thoracic cavity, rapidly harvest the hearts and rinse the hearts gently in cold phosphate-buffered saline (PBS).
CAUTION: Euthanasia must be performed according to institutionally approved protocols.
- Open the thoracic cavity, rapidly harvest the hearts and rinse the hearts gently in cold phosphate-buffered saline (PBS).
- Trim the hearts, remove the great vessels and cut transversely from apex to base into 2–3 slices (approximately 2–3 mm thick).
- Immerse the tissue slices in 4% paraformaldehyde in PBS and fix them at 4 °C for 12–24 h.
NOTE: Use a volume ratio of fixative to tissue of at least 10:1.
CAUTION: Paraformaldehyde is toxic and a suspected carcinogen. Handle in a fume hood and wear appropriate PPE (gloves, lab coat, safety goggles). Dispose of paraformaldehyde waste as hazardous chemical waste according to institutional guidelines.
- Immerse the tissue slices in 4% paraformaldehyde in PBS and fix them at 4 °C for 12–24 h.
- Dehydrate tissue through a graded ethanol series (50%, 70%, 80%, 95%, 100% ethanol, each for 1 h), clear them in xylene (2 changes, 30 min each), embed them in paraffin, and section them at 4–5 µm thickness using a microtome.
NOTE: Sections should be free of folds and tears.
CAUTION: Xylene is flammable and toxic. Use only in a fume hood and avoid skin contact. Collect xylene waste in a designated container and dispose of as hazardous chemical waste. - Deparaffinize the sections in xylene (2 changes, 5–10 min each), rehydrate them through descending ethanol series (100%, 95%, 80%, 70%, each for 3 min) to water.
- Stain them using standard Hematoxylin and Eosin (H&E) (see Table of Materials) and Masson’s trichrome protocols (see Table of Materials).
CAUTION: Xylene is toxic. Use only in a fume hood and avoid skin contact. Dispose of xylene waste as hazardous material.
- Stain them using standard Hematoxylin and Eosin (H&E) (see Table of Materials) and Masson’s trichrome protocols (see Table of Materials).
- Examine the stained sections under a light microscope (see Table of Materials).
- For quantitative analysis, capture digital images at 4×, 20×, and 40× magnification using a digital camera attached to the microscope. Measure infarct size and fibrotic area using ImageJ.
NOTE: Infarct size (%) = (infarct area / total LV area) × 100; collagen content (%) = (blue-stained area / total myocardial area) × 100.
- For quantitative analysis, capture digital images at 4×, 20×, and 40× magnification using a digital camera attached to the microscope. Measure infarct size and fibrotic area using ImageJ.
결과
Generation of Cracd-deficient mice
A heritable mouse model carrying a targeted deficiency in the Cracd gene was generated using CRISPR/Cas9-mediated genome editing (Figure 1A, Figure 1B). To distinguish WT, heterozygous, and homozygous genotypes, a multiplex PCR was performed using three primers (F1, F2, R1) in a single reaction. Mice homozygous for the deletion (Cracd‑deficient) displayed only the 421 bp band, WT mice showed only the 357 bp band (Figure 1C). Sanger sequencing of genomic DNA from Cracd-deficient mice confirmed the predicted deletion in the target gene compared to WT controls (Figure 1D). Western blot analysis further demonstrated a marked reduction in CRACD protein levels in cardiac tissues from Cracd-deficient mice compared with WT controls (Figure 1E). Together, these data confirm the successful establishment of the Cracd-deficient mouse line.
Echocardiography
Echocardiographic assessment on postoperative day 7 revealed pronounced pathological cardiac remodeling in WT mice after MI (WT-MI) compared with sham-operated controls (Figure 2A). The WT-MI group showed thinning of the interventricular septum (Figure 2B, C), significant left ventricular (LV) dilation as reflected by increased LVIDd (Figure 2D) and LVIDs (Figure 2E), and thinning of the posterior wall (Figure 2F, G). These structural alterations were associated with a pronounced decline in global systolic function, as demonstrated by significantly reduced EF (Figure 2H) and FS (Figure 2I). In contrast, Cracd-deficient mice displayed a cardioprotective phenotype following MI. LV dilation was significantly attenuated, with notably smaller LVIDd and LVIDs compared with the WT-MI group. Furthermore, these mice exhibited improved systolic thickening of the posterior wall and maintained significantly higher EF and FS values. These findings indicate that Cracd deficiency effectively attenuates post-infarction LV dilation and preserves global systolic function.
Speckle-tracking strain analysis
Left ventricular myocardial motion and deformation were further evaluated by speckle‑tracking echocardiography using only parasternal long‑axis views (Figure 3A). To ensure data reliability, we defined pragmatic criteria for acceptable output based on the capabilities of the VevoStrain software. Acceptable strain analysis required: (i) a clear parasternal long‑axis view with endocardial borders visible throughout the cardiac cycle; (ii) a stable heart rate between 450–550 bpm during acquisition; (iii) after automatic tracking, the colour‑coded mesh (activated via “toggle contour/vector/orbit line/B mode”) had to closely follow the endocardial and epicardial borders without jerking or losing contact; and (iv) strain curves had to be smooth, show consistent waveforms across segments, and lack sudden spikes or arrhythmic interruptions. Suboptimal output—most commonly erratic strain curves or inability to visualise clear motion trajectories—led to manual adjustment of endocardial or epicardial contours and re‑analysis. If quality remained poor after three attempts, the mouse was excluded. Using these criteria, we obtained reliable strain data in WT‑MI mice and Cracd‑deficient MI mice.
Compared with the sham group, WT-MI mice exhibited significantly reduced radial velocity (Figure 3B) and longitudinal velocity (Figure 3C), as well as radial displacement (Figure 3D) and longitudinal displacement (Figure 3E), indicating impaired global myocardial motion. The absolute values of radial strain (Figure 3F), radial strain rate (Figure 3G), longitudinal strain (Figure 3H), and longitudinal strain rate (Figure 3I) were also markedly decreased, reflecting severely compromised regional myocardial deformation and function. In contrast, Cracd-deficient mice showed significant improvement in these parameters. Compared with the WT-MI group, they displayed better recovery of radial and longitudinal displacements. Furthermore, radial velocity, radial strain, and radial strain rate were maintained at higher levels, while longitudinal strain and longitudinal strain rate were significantly improved. These results suggest that Cracd deficiency not only preserves global systolic function but also enhances regional LV myocardial deformation after MI.
The speckle‑tracking imaging analysis also included visualization of segmental strain distribution and cardiac motion trajectories. Parasternal long‑axis B‑mode images with segmented six regions (BA, MA, AA, AP, MP, BP) and color gradient mapping are displayed in Figure 4A. Cardiac motion trajectories, time‑to‑peak curves for radial and longitudinal strain, parametric distribution maps of strain synchrony, and three‑dimensional reconstructions are presented in Figure 4B. These data further support the functional improvements observed in Cracd‑deficient mice.
Histological examination
To assess the protective effect of Cracd deficiency against MI, histopathological examination was performed on heart sections from WT and Cracd-deficient mice at 7 days post-MI using H&E and Masson's trichrome staining. Whole‑heart longitudinal sections are shown in Figure 5A, with quantitative analysis of infarct size and collagen content presented in Figure 5B and Figure 5C, respectively. High‑magnification views of the infarct zone, border zone, and remote zone are displayed in Figure 5D. In WT-MI hearts, H&E staining showed pronounced left ventricular wall thinning and a well-demarcated infarct zone. Within the infarct region, extensive inflammatory cell infiltration, myocardial necrosis, and marked fibrosis with scar formation were observed. In the border zone, inflammatory infiltration, myocardial necrosis, fibrosis and cardiomyocyte hypertrophy were evident, while the remote zone displayed prominent hypertrophic changes. Corresponding Masson's trichrome staining further demonstrated extensive interstitial fibrosis within both the infarct and border zones of WT hearts following MI. In contrast, Cracd-deficient mice exhibited substantially attenuated pathological alterations, including reduced wall thinning, diminished inflammatory infiltration and myocardial necrosis, less pronounced cardiomyocyte hypertrophy, and markedly decreased interstitial fibrosis compared with WT-MI hearts. These histological findings indicate that Cracd deficiency mitigates post-infarction myocardial damage and adverse remodeling.
Successful protocol execution should yield: (i) a well‑demarcated infarct zone with extensive collagen deposition in WT-MI hearts; (ii) clear cellular morphology without staining artifacts; and (iii) significantly attenuated pathology in Cracd‑deficient MI hearts. Although infarct size may vary with ligation precision, the genotype‑dependent difference is a reliable indicator of successful performance.
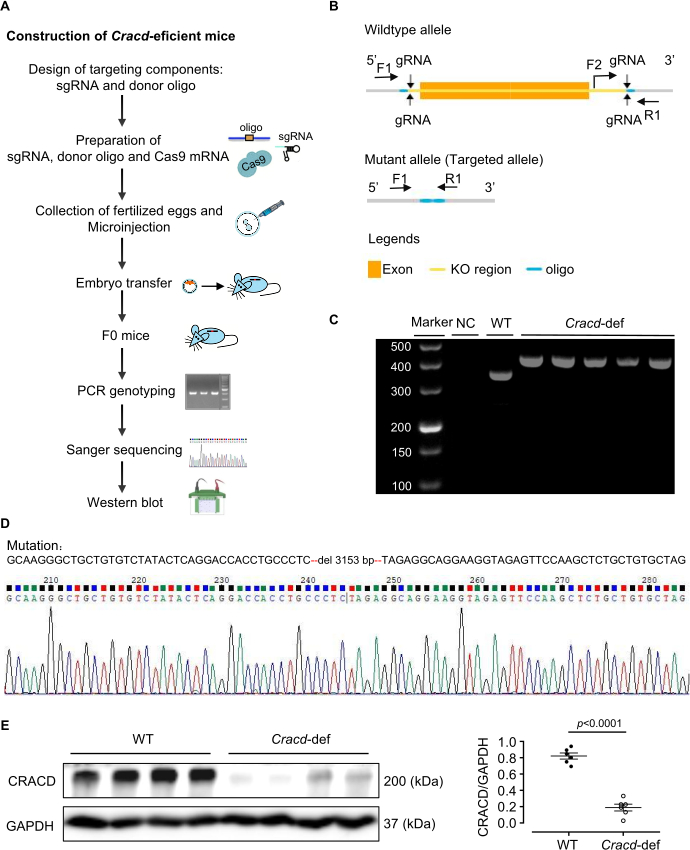
Figure 1: Generation of Cracd-deficient mice. (A) Construction of Cracd-deficient mice. (B) Schematic of the Cracd gene modification strategy. (C) PCR genotyping of tail genomic DNA. WT mice show a single 357 bp band, while homozygous (Cracd‑deficient) mice show a single 421 bp band. (D) Sanger sequencing of genomic DNA confirmed the predicted deletion in the Cracd locus of deficient mice compared to WT controls. (E) Western blot analysis showed significantly reduced CRACD protein levels in the hearts of Cracd-deficient mice compared to WT controls. n = 6 mice per group. Data are presented as mean ± SEM. Statistical significance was calculated with a two-tailed unpaired Student's t-test. Please click here to view a larger version of this figure.
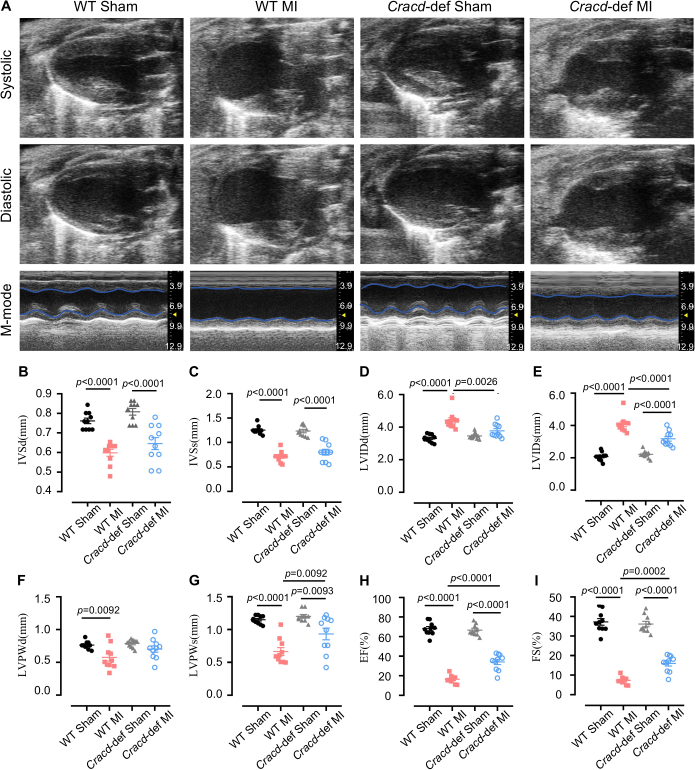
Figure 2: Echocardiographic assessment of cardiac function. (A) Representative B-mode and M-mode echocardiographic images of mouse hearts at diastole and systole. Quantitative analysis of (B) interventricular septum thickness at diastole (IVSd) and (C) systole (IVSs), (D) left ventricular internal diameter at diastole (LVIDd) and (E) systole (LVIDs), (F) left ventricular posterior wall thickness at diastole (LVPWd) and (G) systole (LVPWs), (H) ejection fraction (EF), and (I) fractional shortening (FS). n = 10 mice per group. Data are presented as mean ± SEM. Statistical significance was determined by one-way ANOVA followed by Tukey's multiple comparisons test. Please click here to view a larger version of this figure.
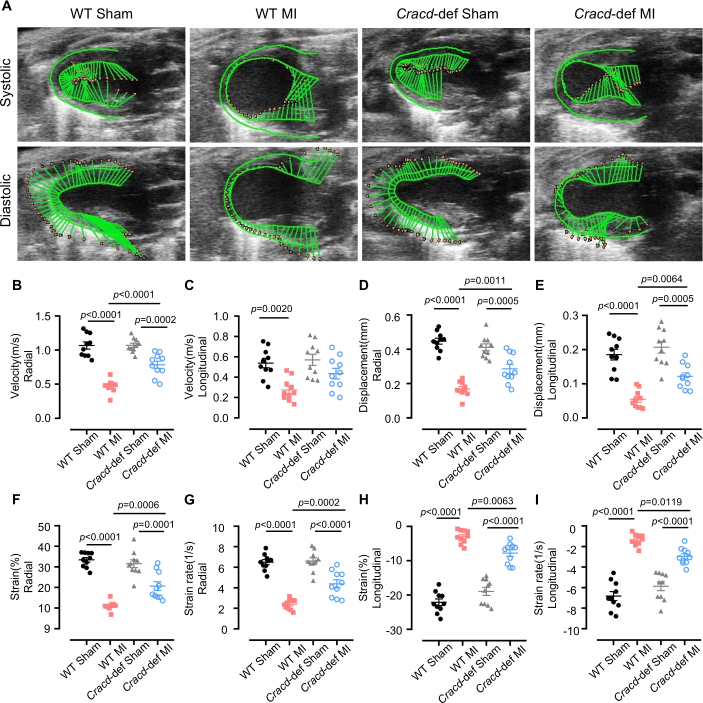
Figure 3: Speckle-tracking strain analysis. (A) Representative images of left ventricular wall motion and deformation at diastole and systole. Quantitative analyses of the following parameters: (B) radial velocity, (C) longitudinal velocity, (D) radial displacement, (E) longitudinal displacement, (F) radial strain, (G) radial strain rate, (H) longitudinal strain, and (I) longitudinal strain rate. n = 10 mice per group. Data are presented as mean ± SEM. Statistical significance was determined by one-way ANOVA followed by Tukey's multiple comparisons test. Please click here to view a larger version of this figure.
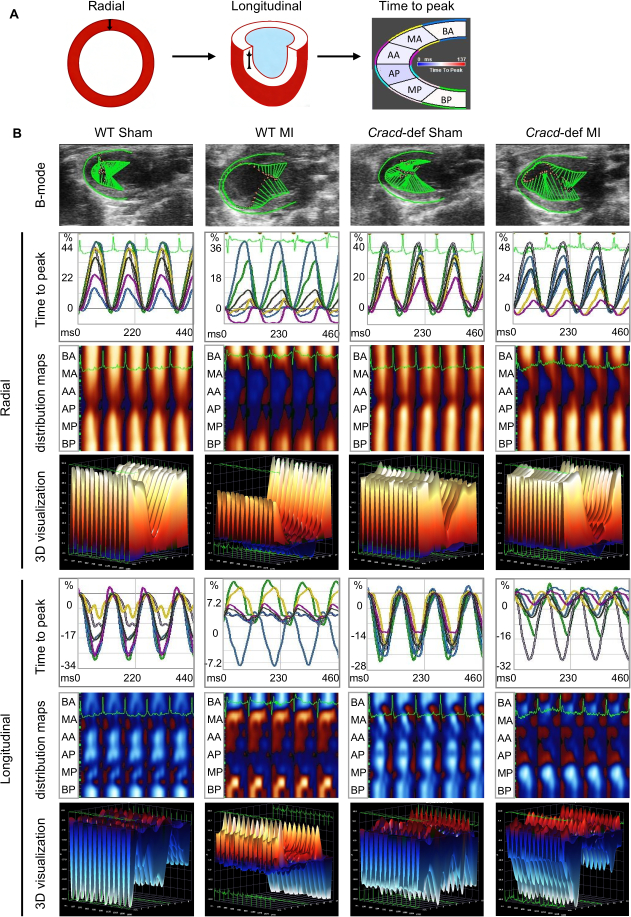
Figure 4: Speckle-tracking imaging in WT-Sham, WT-MI, Cracd-deficient Sham, and Cracd-deficient MI groups at 7 days post-MI. (A) Parasternal long‑axis B‑mode images. Left ventricular wall was segmented into six regions: BA (basal anterior), MA (mid anterior), AA (apical anterior), AP (apical posterior), MP (mid posterior), and BP (basal posterior). Color gradient from blue to red represents increasing strain magnitude. (B) Cardiac motion trajectories; time-to-peak curves for radial and longitudinal strain values along with corresponding peak times. Parametric distribution maps of strain synchrony (blue/red indicate direction: radial – away from/toward center; longitudinal – away from/toward apex). White dots = highest velocity regions, black dots = lowest velocity. Three-dimensional reconstructions (X: time, Y: spatial position, Z: strain magnitude). Please click here to view a larger version of this figure.
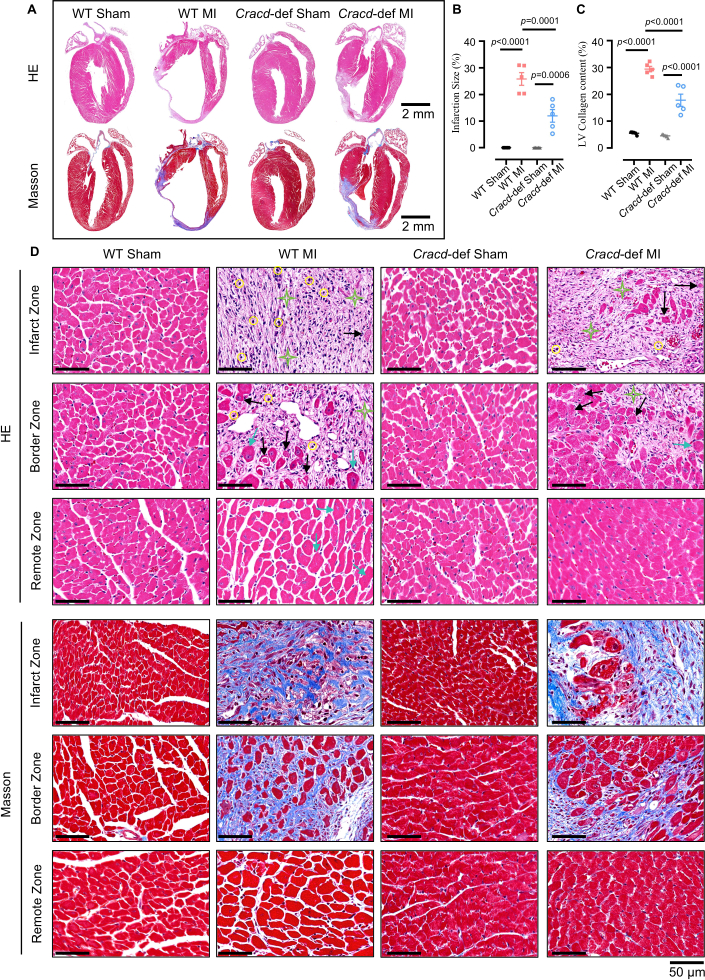
Figure 5: Histopathological analysis of cardiac remodeling after MI. (A) Whole-heart longitudinal sections with H&E and Masson's trichrome staining. Scale bars: 2 mm. (B) Quantitative analysis of infarct size and (C) collagen content. (D) High‑magnification views of infarct zone (IZ), border zone (BZ), and remote zone (RZ). H&E: yellow circles = inflammatory infiltration; black arrows = myocardial necrosis; green stars = fibrosis; blue arrows = hypertrophy. Masson’s trichrome: blue indicates collagen deposition. Scale bar: 50 μm. n = 5 mice per group. Data are presented as mean ± SEM. Statistical significance was determined by one-way ANOVA followed by Tukey's multiple comparisons test. Please click here to view a larger version of this figure.
토론
본 연구에서 우리는 CRISPR/Cas9 기술로 공학적으로 설계된 Cracd 결핍 마우스를 제작하였으며, 일반 심초음파, 스펙클 추적 변형 영상(speckle‑tracking strain imaging) 및 조직학적 분석을 통해 심근경색(MI) 후 표현형을 분석하는 워크플로우를 수립하였습니다. 해당 프로토콜을 통해 CRACD 단백질의 소실이 확인된 녹아웃(knockout) 마우스를 제작하였습니다. Cracd 결핍 마우스는 심근경색 후 야생형(WT) 대조군에 비해 심실 확장이 적고, 박출률(EF)이 더 높으며, 섬유화가 감소한 것으로 나타나 심장 리모델링 연구를 위한 해당 모델의 유용성을 확인하였습니다.
이 모델의 성공은 몇 가지 중요한 단계에 달려 있습니다. gRNA 설계 및 인 비트로(in vitro) 검증은 접합자 편집 효율에 직접적인 영향을 미칩니다.23CRISPick 또는 Benchling을 사용하여 CRISPRater 점수가 0.5 이상인 gRNA를 선택한 다음, in vitro Cas9/gRNA 분석을 통해 절단 효율을 테스트합니다. 다음의 성과를 거둔 gRNA만 > 50% 절단편을 미세주입합니다. 적절한 좌전하행동맥(LAD) 결찰 또한 매우 중요합니다. 우심실을 천공(너무 깊음)하거나 혈관을 폐쇄하지 못하는(너무 얕음) 상황을 방지하기 위해, 7-0 봉합사는 LAD 기시점에서 2~3mm 떨어진 지점에서 0.5~1mm 깊이로 통과해야 합니다. 전벽이 즉각적으로 하얗게 변하면 폐쇄가 확인된 것입니다. 심초음파 검사 중 심박수 조절 또한 필수적입니다.24이소플루레인(통상 1~2%)을 조절하여 450~550 bpm을 유지하면 일반 측정 및 변형률(strain) 측정의 재현성을 향상시킬 수 있습니다. 마지막으로, 스펙클 추적(speckle‑tracking) 분석의 경우 색상으로 표시된 메쉬(mesh)의 시각적 평가가 필수적입니다.25메시는 급격한 변화 없이 심근 경계를 따라야 하며, 그렇지 않을 경우 수동 보정이 필요합니다. 세 번의 시도 후에도 품질이 여전히 낮은 경우, 해당 마우스는 분석에서 제외합니다.
프로토콜을 세심하게 따르더라도 특정 기술적 어려움이 발생할 수 있습니다. 체계적인 문제 해결(troubleshooting)을 통해 대부분의 문제를 해결할 수 있습니다. 낮은 생식세포 전달률(10% 미만)은 보통 공여체 올리고뉴클레오타이드의 통합 부전이나 약한 gRNA 활성도를 나타냅니다26. 따라서 공여체 oligo 농도를 20 ng/µL로 높이고, 상동 팔(homology arms)의 길이를 120–200 bp로 연장하며, gRNA 절단 효율(> 50%)을 재확인하면 전달률을 개선할 수 있습니다. 높은 MI 후 사망률(30% 초과)은 주로 기흉, 출혈 및 광범위한 경색으로 인해 발생합니다27. 그러므로 마우스가 깰 때까지 지속적으로 산소를 공급하고 가열 패드를 사용하여 체온을 유지하면 사망률을 눈에 띄게 낮출 수 있습니다. 결찰 후 전벽이 창백해지지 않는다면, LAD를 잘못 식별했거나 봉합 깊이가 너무 얕을 가능성이 높습니다. 이 경우 LAD(밝은 붉은색의 대각선 혈관)의 위치를 다시 확인하고, 때로는 해부 현미경을 사용하여 바늘을 0.5–1 mm 깊이로 다시 통과시키면 이 문제가 해결됩니다. 스펙클 추적(speckle-tracking) 품질이 낮은 경우, 낮은 프레임 레이트, 흐릿한 경계 또는 움직임 아티팩트가 일반적인 원인입니다28. 따라서 프레임 레이트를 높이고, 게인(gain)을 미세 조정하며, 심내막 추적선을 수동으로 교정하고, 부정맥이 있는 사이클을 제외하는 것이 도움이 됩니다.
이러한 운영상의 고려 사항 외에도, 본 방법에는 분명한 한계가 있습니다. Cracd 녹아웃은 전신적으로 이루어지므로 모든 조직에서 CRACD가 결핍됩니다. 결과적으로, 전신적 기여가 영향을 미쳤을 수 있으므로 관찰된 보호 효과를 심근세포만의 작용으로만 돌릴 수는 없습니다. 세포 유형별 역할을 구분하기 위해서는 조건부 녹아웃이 필요할 것입니다. 또 다른 한계는 7일 차라는 단일 시점 측정으로 인해 만성 리모델링에 관한 정보를 알 수 없다는 점입니다. 따라서 장기 연구를 위해서는 더 후기 시점(4주 또는 8주)을 추가해야 합니다. 재현성 또한 이미지 품질에 의존한다는 점이 걸림돌입니다. 모든 초음파 시스템이 깨끗한 심내막 경계를 제공하는 것은 아니며, 작업자의 숙련도가 중요합니다. 따라서 전문 교육을 받은 사람이 모든 수술과 측정을 수행하는 것을 권장합니다.
이러한 한계점을 고려할 때, 본 연구의 접근 방식을 심근경색(MI) 후 리모델링 과정에서 유전자 기능을 연구하기 위한 대안적 전략들과 비교하는 것이 유용합니다. AAV 매개 유전자 조작과 안티센스 올리고뉴클레오타이드(ASOs)가 일반적인 두 가지 대안입니다29,30. AAV9은 교배 과정 없이 심장 특이적인 일시적 과발현 또는 넉다운을 유도할 수 있으나, 패키징 용량 제한(~4.7 kb), 가변적인 형질전환 효율, 그리고 오프 타겟 효과(off-target effects)가 단점으로 꼽힙니다31. 이와 대조적으로, 본 연구의 CRISPR/Cas9 넉아웃 모델은 영구적이고 완전한 기능 상실을 제공하므로 장기 연구에 유리합니다. ASOs는 가역적이고 용량 의존적인 넉다운을 빠르게 유도하여 급성 중재 연구에 적합하지만, 반복적인 투여가 필요하며 조직 특이성이 부족하다는 단점이 있습니다32. 따라서 본 논문에서 기술한 구성적 넉아웃(constitutive knockout) 방식이 초기 발견 및 만성 표현형 분석에 가장 적합합니다.
마지막으로, 본 프로토콜은 CRACD 이외의 범위로 충분히 확장 가능합니다. CRISPR/Cas9를 이용한 유전자 결손 마우스 제작과 심초음파 검사, strain imaging 및 조직학적 분석을 결합한 동일한 워크플로우를 통해 MI 후 리모델링 과정의 모든 후보 유전자를 평가할 수 있습니다. 이러한 표현형 분석 프레임워크는 횡대동맥 결찰(압력 과부하) 또는 허혈-재관류 손상과 같은 다른 심혈관 질환 모델에도 적합합니다. 또한, 본 프로토콜을 통해 얻은 조직 샘플은 분자적 메커니즘을 밝히기 위한 멀티오믹스 분석(전사체학, 단백질체학, 대사체학)에 활용될 수 있습니다. Cracd 결핍 모델은 약물 테스트 도구로 활용될 수 있으며, CRACD 경로를 통해 작용할 것으로 추정되는 화합물들을 평가할 수 있습니다. 따라서 본 프로토콜은 심혈관 연구의 광범위한 기전 및 중개 연구에 적용 가능한 플랫폼을 제공합니다.
공개 사항
저자들은 상충하는 이해관계가 없음을 밝힙니다.
감사의 글
본 연구는 Guangdong Basic and Applied Basic Research Foundation (2023A1515011278), Guangdong Provincial Biotechnology Research Institute 자체 펀딩 프로젝트 (GDBRI-ZL202602), 그리고 심혈관 질환 모델 및 병인에 관한 중국-캐나다 학술 교류 및 협력 (MS202500058)의 지원을 받아 수행되었습니다.
재료
| 이름 | 회사 | 카탈로그 번호 | 댓글 |
|---|---|---|---|
| CRISPR/Cas9 | |||
| Trizma 염산염 용액 | Sigma-Aldrich, USA | T2663 | DNA 추출 완충액 제조에 사용됨 |
| 단백질분해효소 K | Sigma-Aldrich, USA | 539480 | 마우스 꼬리 소화에 사용됨 |
| 그린 Taq 믹스 | Vazyme, 중국 | P131 | PCR 증폭에 사용됨 |
| 아가로스 | BioFroxx, 독일 | 1110GR500 | 1% DNA 겔 전기영동에 사용됨–2% 농도 |
| DNA 마커 | Thermo Scientific, USA | SM0242 | PCR 생성물의 크기 측정을 위한 DNA 사다리로 사용됨 |
| TIANamp Genomic DNA Kit | Tiangen Biotech, 중국 | DP304 | 마우스 꼬리 조직에서 게놈 DNA를 추출하는 데 사용됨 |
| MEGAshortscript™ T7 전사 키트 | Thermo Scientific, USA | AM1354 | gRNA의 인비트로(in vitro) 전사에 사용됨 |
| RNA 정제 키트 | Zymo Research, USA | R1016 | 전사된 gRNA 정제에 사용됨 |
| BeyoCRISPR™ sgRNA 스크리닝 키트 | Beyotime, 중국 | D8412S | gRNA 절단 활성의 인비트로(in vitro) 평가에 사용됨 |
| RNase 억제제 | NEB, USA | M0314 | 인비트로(in vitro) 전사 과정 중 RNA 분해를 방지하는 데 사용됨 |
| TaKaRa Taq | Takara Bio, 일본 | R001A | 마우스 꼬리 DNA의 PCR 유전자형 분석에 사용됨 |
| FERTIUP® 마우스 정자 사전 배양 배지: PM | Cosmo Bio, 일본 | KYD-002-EX | 체외 수정을 위한 정자 수정능 획득 유도에 사용됨 |
| T7 ARCA mRNA 키트 | NEB, USA | E2060 | Cas9 mRNA의 인비트로(in vitro) 전사에 사용됨 |
| 임신마 혈청 성선자극호르몬 | MCE, USA | 9002-70-4 | 과배란 유도에 사용되며, 복강 내 주사로 투여함 |
| 인간 융모성 성선 자극 호르몬 | ProSpec, 이스라엘 | HOR-250 | 배란 유도를 위해 사용하며, 복강 내 주사로 투여함 |
| RNase-free water | Aladdin, 중국 | R665526 | RNA 용해 및 PCR 설정에 사용됨 |
| 프라이머 | Sangon Biotech, 중국 | / | 유전자형 분석에 사용됨 |
| 수술 | |||
| 이소플루레인 | RWD Life Science, 중국 | R510-22-10 | 수술 중 마취 유도 및 유지에 사용됨 |
| 제모 크림 | 브(Veet), 프랑스 | 1000207 | 수술 및 초음파 검사 전 털 제거를 위해 흉부 부위에 적용함 |
| 7-0 봉합사 | 중국 링차오 | LQ7022380206 | 좌전하행(LAD) 관상동맥의 영구 결찰에 사용됨 |
| 4-0 봉합사 | 중국 링차오 | 제공된 텍스트가 없어 번역을 수행할 수 없습니다. 번역할 소스 텍스트를 입력해 주시기 바랍니다. | 수술 후 피부 절개 부위를 봉합하는 데 사용됨 |
| 마취 호흡기 | Harvard Apparatus, USA | 테이블탑 | 이소플루란 전달 및 호흡 보조에 사용됨 |
| 소동물 인공호흡기 | 중국 타이멍 | HX-101E | 개흉술 중 양압 환기를 제공하는 데 사용됨 |
| 정온 가열 패드 | TigerGene, USA | TG-TP-GS | 수술 및 회복 중 마우스의 체온을 유지하는 데 사용됨 |
| 늑골 견인기 | Shenzhen Huayon Biotech, 중국 | LN-18-4101 | 늑골을 분리하고 LAD 결찰을 위해 심장을 노출시키는 데 사용됨 |
| 가위 | Shenzhen Huayon Biotech, 중국 | 18-0551 | 피부 절개 및 조직 절단에 사용됨 |
| 실체 현미경 | Nikon, 일본 | SMZ 745 | LAD 동맥 결찰 수술 중 확대된 시야를 제공하는 데 사용됨 |
| 미세수술용 지침기 | Shenzhen Huayon Biotech, 중국 | 18-2211 | 현미경 하에서 작은 7-0 봉합사를 끼운 바늘을 조작하는 데 사용함 |
| 화학 물질 및 시약 | |||
| 초음파 커플링제 | Tianjin Jinya Technology Development, 중국 | TM-100 | 심초음파 검사를 위해 흉부에 도포하여 프로브가 적절하게 접촉되도록 합니다. |
| 파라포름알데히드 | Sigma-Aldrich, USA | V900894 | 채취 후 심장 조직 고정에 사용됨 |
| 자일렌 | 맥클린, 중국 | 1330-20-7 | 염색 전 파라핀 제거 및 조직 투명화에 사용됨 |
| 헤마톡실린 | Sigma-Aldrich, USA | H3136 | HE 염색에 사용되는 핵 염색제, |
| 에오신 | Sigma-Aldrich, USA | E4009 | HE 염색에 사용되는 세포질 염색제, |
| 폰소 S | Sigma-Aldrich, USA | P3504 | 세포질 염색을 위한 Masson 염색에 사용됨 |
| 인몰리브덴산 | Sigma-Aldrich, USA | 221856 | Masson 염색에서 매염제 및 분별제로 사용됨 |
| 아닐린 블루 용액 | Sigma-Aldrich, USA | 415049 | 콜라겐 섬유 염색(청색)을 위한 Masson 염색에 사용됨 |
| CRACD 항체 | 압세아, 중국 | KC-35356 | Western Blot을 이용한 CRACD 단백질 검출용 1차 항체, 희석 배수 1:2000 |
| GAPDH 항체 | CST, 미국 | 2118S | Western Blot용 로딩 컨트롤 항체, 희석 배수 1:5000 |
| 에탄올 | 맥클린, 중국 | 64-17-5 | 탈수 및 시약 조제용(70%, 80%, 95%, 100% 등급)으로 사용됨 |
| 실험 장비 | |||
| Sorvall™ 범례™ Micro 17 원심분리기 | Thermo Scientific, USA | 75002541 | 일상적인 시료 준비에 사용됨 |
| PCR 열 순환기 | Bio-Rad Laboratories, USA | 1861096 | DNA 증폭에 사용됨 |
| 미세주입 시스템 | Eppendorf, 독일 | 5193000020 | 배아(zygotes) 내로 CRISPR/Cas9 시약을 미세주입(microinjection)하는 데 사용됨 |
| Vevo 2100 영상 시스템 | VisualSonics, 캐나다 | Vevo2100 | 심근경색(MI) 후 심장 기능 및 구조의 비침습적 평가를 위한 고주파 영상 시스템 |
| 광학 현미경 | Leica, 독일 | DM2500 | HE 및 Masson 염색된 심장 절편 관찰에 사용됨 |
| 분석 소프트웨어 | |||
| ImageJ | 미국 국립보건원 | / | 면적 측정, 신호 정량화 및 조직학적 이미지(HE 및 Masson 염색) 처리를 포함한 이미지 분석에 사용됨 |
| VevoLab 3.2.0 / VevoStrain | VisualSonics, 캐나다 | / | 심장 기능 분석용 VevoLab 소프트웨어; 심근 스트레인 분석을 통해 심근경색(MI) 후 심장 성능을 평가하는 데 사용되는 VevoStrain 모듈 |
| GraphPad Prism 8 | GraphPad Software, USA | / | 통계 분석 및 그래프 작성에 사용됨 |
참고문헌
- Fauconnier, J., Meli, A. C., Thireau, J., Roberge, S., Shan, J., et al. Ryanodine receptor leak mediated by caspase-8 activation leads to left ventricular injury after myocardial ischemia-reperfusion. Proc Natl Acad Sci U S A. 108 (32), 13258-13263 (2011).
- Cohn, J. N., Ferrari, R., Sharpe, N. Cardiac remodeling-concepts and clinical implications: a consensus paper from an international forum on cardiac remodeling. J Am Coll Cardiol. , (2000).
- Liu, D., Tian, X., Liu, Y., Song, H., Cheng, X., et al. CREG ameliorates the phenotypic switching of cardiac fibroblasts after myocardial infarction via modulation of CDC42. Cell Death Dis. 12 (4), (2021).
- Contessotto, P., Pandit, A. Therapies to prevent post-infarction remodelling: from repair to regeneration. Biomaterials. 275, (2021).
- Zhu, R., Sun, H., Yu, K., Zhong, Y., Shi, H., et al. Interleukin-37 and dendritic cells treated with interleukin-37 plus troponin I ameliorate cardiac remodeling after myocardial infarction. J Am Heart Assoc. 5 (12), (2016).
- Chang, Y., Zhang, J., Huo, X., Qu, X., Xia, C., et al. Substrate rigidity dictates colorectal tumorigenic cell stemness and metastasis via CRAD-dependent mechanotransduction. Cell Rep. 38 (7), (2022).
- Seo, Y., Jang, J., Ko, K. P., Zou, G., Huang, Y., et al. Actin dysregulation induces immune evasion via oxidative stress-activated PD-L1 in gastric cancer. bioRxiv. , (2024).
- Kim, B., Zhang, S., Huang, Y., Ko, K. P., Jung, Y. S., et al. CRACD loss induces neuroendocrine cell plasticity of lung adenocarcinoma. Cell Rep. 43 (6), (2024).
- Jung, Y. S., Wang, W., Jun, S., Zhang, J., Srivastava, M., et al. Deregulation of CRAD-controlled cytoskeleton initiates mucinous colorectal cancer via β-catenin. Nat Cell Biol. 20 (11), 1303-1314 (2018).
- Liu, Z., Cao, H., Shi, Y., Yang, R. KIAA1211 plays an oncogenic role in human non-small cell lung cancer. J Cancer. 10 (26), 6747-6753 (2019).
- Snider, P. L., Snider, E., Simmons, O., Lilly, B., Conway, S. J. Analysis of uncharacterized mKiaa1211 expression during mouse development and cardiovascular morphogenesis. J Cardiovasc Dev Dis. 6 (2), (2019).
- Lin, Y. H., Warren, C. M., Li, J., McKinsey, T. A., Russell, B. Myofibril growth during cardiac hypertrophy is regulated through dual phosphorylation and acetylation of the actin capping protein CapZ. Cell Signal. 28 (8), 1015-1024 (2016).
- Yang, F. H., Pyle, W. G. Reduced cardiac CapZ protein protects hearts against acute ischemia-reperfusion injury and enhances preconditioning. J Mol Cell Cardiol. 52 (3), 761-772 (2012).
- Tong, C., Huang, G., Ashton, C., Wu, H., Yan, H., et al. Rapid and cost-effective gene targeting in rat embryonic stem cells by TALENs. J Genet Genomics. 39 (6), 275-280 (2012).
- Cordes, S. P. N-ethyl-N-nitrosourea mutagenesis: boarding the mouse mutant express. Microbiol Mol Biol Rev. 69 (3), 426-439 (2005).
- Cong, L., Ran, F. A., Cox, D., Lin, S., Barretto, R., et al. Multiplex genome engineering using CRISPR/Cas systems. Science. 339 (6121), 819-823 (2013).
- Kanke, K. L., Rayner, R. E., Bozik, J., Abel, E., Venugopalan, A., et al. Single-stranded DNA with internal base modifications mediates highly efficient knock-in in primary cells using CRISPR-Cas9. Nucleic Acids Res. 52 (22), 13561-13576 (2024).
- Mihos, C. G., Liu, J. E., Anderson, K. M., Pernetz, M. A., O'Driscoll, J. M., et al. Speckle-tracking strain echocardiography for the assessment of left ventricular structure and function: a scientific statement from the American Heart Association. Circulation. 152 (10), (2025).
- Garg, P. K., Biggs, M. L., Kizer, J. R., Shah, S. J., Psaty, B., et al. Glucose dysregulation and subclinical cardiac dysfunction in older adults: the Cardiovascular Health Study. Cardiovasc Diabetol. 21 (1), (2022).
- Asanuma, T., Fukuta, Y., Masuda, K., Hioki, A., Iwasaki, M., et al. Assessment of myocardial ischemic memory using speckle tracking echocardiography. JACC Cardiovasc Imaging. 5 (1), 1-11 (2012).
- Chong, S. Y., Zharkova, O., Yatim, S. M. J. M., Wang, X., Lim, X. C., et al. Tissue factor cytoplasmic domain exacerbates post-infarct left ventricular remodeling via orchestrating cardiac inflammation and angiogenesis. Theranostics. 11 (19), 9243-9261 (2021).
- Hung, C. L., Verma, A., Uno, H., Shin, S. H., Bourgoun, M., et al. Longitudinal and circumferential strain rate, left ventricular remodeling, and prognosis after myocardial infarction. J Am Coll Cardiol. 56 (22), 1812-1822 (2010).
- Labuhn, M., Adams, F. F., Ng, M., Knoess, S., Schambach, A., et al. Refined sgRNA efficacy prediction improves large- and small-scale CRISPR-Cas9 applications. Nucleic Acids Res. 46 (3), 1375-1385 (2018).
- Wu, J., Bu, L., Gong, H., Jiang, G., Li, L., et al. Effects of heart rate and anesthetic timing on high-resolution echocardiographic assessment under isoflurane anesthesia in mice. J Ultrasound Med. 29 (12), (2010).
- Voigt, J. U., Pedrizzetti, G., Lysyansky, P., Marwick, T. H., Houle, H., et al. Definitions for a common standard for 2D speckle tracking echocardiography: consensus document of the EACVI/ASE/Industry Task Force to standardize deformation imaging. J Am Soc Echocardiogr. 28 (2), 183-193 (2015).
- Port, F., Chen, H. M., Lee, T., Bullock, S. L. Optimized CRISPR/Cas tools for efficient germline and somatic genome engineering in Drosophila. Proc Natl Acad Sci U S A. 111 (29), (2014).
- Gao, E., Lei, Y. H., Shang, X., Huang, Z. M., Zuo, L., et al. A novel and efficient model of coronary artery ligation and myocardial infarction in the mouse. Circ Res. 107 (12), 1445-1453 (2010).
- Rösner, A., Barbosa, D., Aarsæther, E., Kjønås, D., Schirmer, H., et al. The influence of frame rate on two-dimensional speckle-tracking strain measurements: a study on silico-simulated models and images recorded in patients. Eur Heart J Cardiovasc Imaging. 16 (10), 1137-1147 (2015).
- Argiro, A., Bui, Q., Hong, K. N., Ammirati, E., Olivotto, I., et al. Applications of gene therapy in cardiomyopathies. JACC Heart Fail. 12 (2), 248-260 (2024).
- Micheletti, R., Plaisance, I., Abraham, B. J., Sarre, A., Ting, C. C., et al. The long noncoding RNA Wisper controls cardiac fibrosis and remodeling. Sci Transl Med. 9 (395), (2017).
- Wu, Z., Yang, H., Colosi, P. Effect of genome size on AAV vector packaging. Mol Ther. 18 (1), 80-86 (2010).
- Juliano, R. L. The delivery of therapeutic oligonucleotides. Nucleic Acids Res. 44 (14), 6518-6548 (2016).
재인쇄 및 허가
