본 프로토콜은 복합 형질전환 제브라피시를 생성하는 방법, 제브라피시 유생 및 성체 내 종양 관련 면역 세포를 이미징하는 방법, 그리고 종양 미세환경 내 면역 세포 빈도를 정량화하는 방법을 설명합니다.
방법 논문
신경모세포종 제브라피쉬 모델을 이용한 종양 미세환경 내 면역 세포의 이미징 및 정량 분석
* These authors contributed equally
이 논문에서
요약
초록
종양 미세환경(TME)으로의 면역 세포 모집은 면역 조절 및 종양 진행의 중요한 구성 요소입니다. 생체 내(in vivo)에서 면역 세포와 종양 세포 간의 공간적 및 시간적 관계를 연구하면 TME 내의 상호작용에 대한 통찰력을 얻을 수 있습니다. 그러나 기존의 이미징 및 조직학적 접근 방식으로는 온전한 생물체 내에서 이러한 상호작용을 시각화하고 정량화하는 것이 여전히 어렵습니다. 제브라피시는 유전적 다루기 쉬움, 빠른 발달, 초기 발달 단계에서의 광학적 투명성 덕분에 암 연구에 가치 있는 모델이 되며, 형광 표지된 세포를 in vivo로 시각화할 수 있게 해줍니다. 본 프로토콜에서는 신경모세포종 제브라피시 모델에서 서로 다른 형광 마커로 표지된 면역 세포와 종양 세포를 생성, 식별, 이미징 및 정량화하는 방법을 제시합니다. 이 프로토콜에는 복합 형질전환 제브라피시의 교배 및 스크리닝, 치어의 생체 이미징, 성체 종양 보유 어류의 준비 및 이미징, 그리고 종양 영역 주변 및 내부의 면역 세포 정량화가 포함됩니다. 형질전환 리포터 라인을 사용하여, CD4+ 면역 세포와 MYCN 유도 신경모세포종 세포를 서로 다른 발달 단계에서 시각화하고 분석할 수 있습니다. 이 워크플로우를 통해 치어와 성체 어류 모두에서 종양에 대한 면역 세포의 위치를 평가할 수 있으며, 질병 단계별 면역 세포의 풍부도를 비교하는 데 사용할 수 있습니다. 본 프로토콜은 제브라피시를 이용해 TME 내 면역 세포를 in vivo로 이미징하고 정량화하는 재현 가능한 방법을 제공하며, 다른 암 모델에서의 면역-종양 상호작용 연구를 촉진할 수 있을 것입니다.
서론
종양 미세환경(TME)은 종양, 면역, 섬유아세포 및 혈관 세포로 구성된 생태계입니다1. TME는 암의 진행, 치료 반응 및 항종양 면역에서 필수적인 역할을 합니다. TME 내에서 면역 세포는 항종양 반응에 참여하거나 면역 억제를 유도함으로써 종양의 운명을 결정하는 핵심 조절자로 작용합니다2. TME 내 면역 세포의 모집, 분포 및 기능을 이해하는 것은 종양이 면역 감시를 회피하는 메커니즘을 규명하는 데 매우 중요합니다. 그러나 종점 조직학, 유세포 분석 및 단일 세포 시퀀싱과 같은 TME 연구의 전통적인 접근 방식은 정적인 스냅샷만을 제공하며, 종종 조직 구조의 파괴를 요구하여 공간 정보와 세포 간 상호작용의 손실을 초래합니다3,4,5,6,7. 또한, 이러한 방법들은 특히 종양 발생 초기 단계에서 TME 내의 면역 세포를 시각화하고 정량화하는 능력에 한계가 있습니다.
제브라피시(Danio rerio)는 비용이 저렴하고 발달 속도가 빠르며, 상대적으로 투명하고 유전적 보존성이 높아 암 연구에 매우 유용한 모델입니다8,9. 이러한 장점 덕분에 대규모 샘플 확보가 가능하고 짧은 시간 내에 효율적인 현미경 스크리닝을 수행할 수 있는 재현 가능하고 확장 가능한 실험 시스템을 제공합니다10. 특히 제브라피시는 선천성 및 적응성 면역 체계의 핵심 구성 요소를 포함하여 인간과 상당한 면역학적 보존성을 공유하므로, 연구 결과가 인간 질환과 밀접한 관련이 있습니다11. 이러한 특성은 신경모세포종과 같은 소아암을 연구하는 데 특히 유용합니다8. 이에 따라 수많은 제브라피시 면역 리포터 라인과 암 모델이 개발되었습니다11. 따라서 제브라피시는 종양 세포와 면역 세포 간의 상호작용을 연구하는 귀중한 in vivo 모델로 활용되며, 특히 초기 단계에서 면역 조절이 종양 발달에 어떤 영향을 미치는지에 대한 통찰을 제공합니다.
제브라피시의 종양미세환경(TME)을 조사한 이전 연구들은 주로 종양 내 면역 세포의 국소화를 평가하기 위해 종양 이종이식 모델과 종단 이미지 촬영을 결합한 방식에 크게 의존해 왔습니다12,13,14,15,16,17. 이러한 방법들은 유용한 통찰을 제공하지만, 2차원 이미지 촬영에 의존한다는 한계가 있어 TME의 3차원적 구조와 발달 과정 중 종양 및 면역 세포 간의 공간적 관계를 충분히 포착할 수 없습니다14. 또한, 종양 이종이식 모델은 인간 종양 세포를 인위적으로 이식하는 과정을 포함하므로 자연적인 종양 발생 과정을 완전히 재현하지 못할 수 있습니다18. 이러한 모델들은 대개 단기적이며, 종양의 진행이나 발달 과정 중 종양과 면역 세포 사이의 공간적 관계 변화를 완전히 포착할 수 없습니다14,19. 더욱이, 이 접근 방식은 TME 내 면역 세포 행동의 공간적 조직화, 발달 맥락 및 생리학적 관련성에 대한 제한적인 표현만을 제공합니다. 최근 본 연구진과 다른 연구자들은 종양 세포와 면역 세포를 서로 다른 형광 마커로 표지한 복합 형질전환 제브라피시를 적용하여 종양 관련 면역 세포를 시각화했습니다20,21. 이러한 복합 형질전환 어류는 동물 및 종양의 발달 전 과정에 걸쳐 TME를 연구할 수 있게 하여, in vivo 상에서의 면역-종양 상호작용 조사를 용이하게 합니다.
본 연구에서는 제브라피쉬 신경모세포종 모델의 종양미세환경(TME) 내 면역 세포를 연구하기 위해 공초점 현미경을 활용하는 방법을 제시합니다. 이 방법에서는 면역 세포를 표지하는 제브라피쉬 리포터 라인과, 도파민-β-하이드록실라제 프로모터(dβh) 하에서 인간 MYCN 온코진을 과발현시켜 인간 질환과 유사한 신경모세포종을 유발하도록 유전적으로 조작된 제브라피쉬 라인을 사용하였습니다20. 이 복합 형질전환 제브라피쉬 모델에서 종양 세포와 면역 세포는 각각 EGFP와 mCherry로 다르게 표지됩니다. dβh 프로모터는 교감신경부신 lineage 세포에서 활성화되며, 여러 제브라피쉬 신경모세포종 모델에서 사용되어 왔습니다22,23,24,25. 또한, CD4+ 세포를 시각화하기 위해 mCherry 형광을 발현시키는 Cd4 프로모터를 활용하였습니다15. Z-스택 획득을 통한 공초점 이미징을 적용하여 종양 발달의 서로 다른 단계에서 TME를 3차원으로 시각화함으로써, 온전한 조직 내에서 종양 세포와 면역 세포 간의 공간적 관계를 평가할 수 있었습니다. 이 방법은 종양 발달의 다양한 단계 동안 종양 세포에 대한 면역 세포의 조직 구성을 분석할 수 있게 합니다.
프로토콜
All animal procedures were approved by the Institutional Animal Care and Use Committee (IACUC) at Boston University Chobanian & Avedisian School of Medicine under protocol PROTO202100001. The overall workflow for generation of compound transgenic zebrafish, larval imaging, adult tissue preparation, and image analysis is summarized in Figure 1.
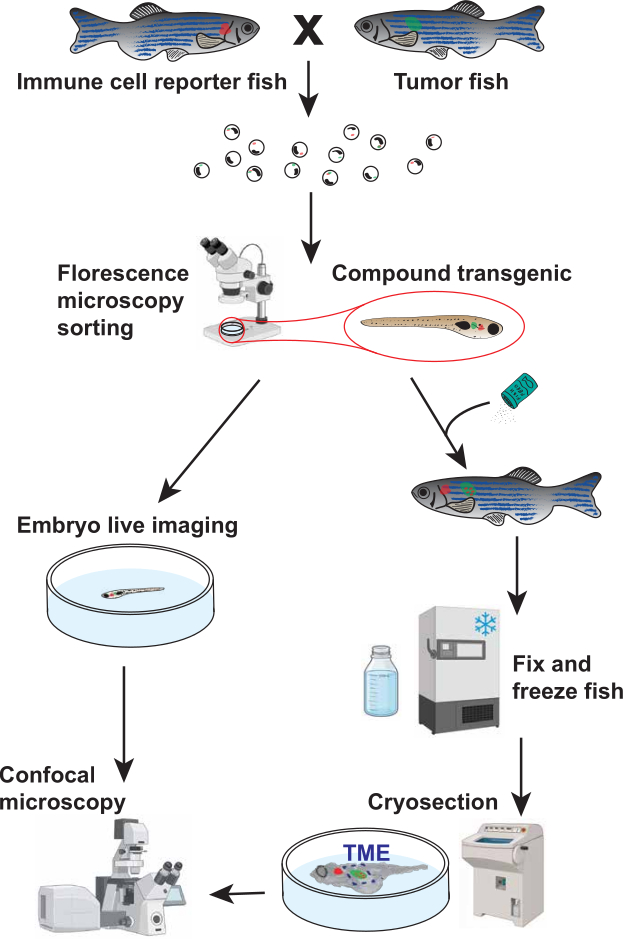
Figure 1. Workflow for visualization and quantification of immune cells within the zebrafish tumor microenvironment (TME). Schematic overview of the experimental workflow. Immune-reporter zebrafish were crossed with tumor-prone zebrafish to generate compound transgenic offspring expressing fluorescent markers in both immune cells (red) and tumor cells (green). Embryos were screened by fluorescence microscopy to identify compound transgenic fish. Selected fish were either subjected to live confocal imaging during larval development (<21 days post-fertilization [dpf]) or processed by fixation, cryosectioning, and confocal imaging for fish older than 21 dpf. This workflow enables visualization and quantification of immune cells associated with the TME across multiple developmental stages. Part of the illustration was created using BioRender. Please click here to view a larger version of this figure.
1. Generation of Compound Transgenic Zebrafish Lines Through Breeding
- Select adult immune-reporter fish and tumor fish that are at least 3 months old for natural breeding.
NOTE: For the representative results, Tg(cd4-1:mCherry) heterozygous fish were crossed with Tg(dβh:MYCN; dβh:EGFP) heterozygous fish to differentially label immune cells and tumor cells15,23. - On the evening before breeding, fill a two-chamber mating tank two-thirds full with fish water.
- Place a grated top insert into the mating chamber. Use dividers to separate one male from one or two females.
- Leave the dividers in place overnight. Add artificial plants or other enrichment items to simulate natural breeding conditions.
NOTE: A 1:2 male-to-female ratio increases the likelihood of successful spawning when breeding tumor male fish with immune-reporter fish. Do not breed two males with one female, as competition between males may occur. - On the following morning, remove the dividers after the facility lights turn on.
- Tilt the grated top chamber slightly using the divider as a wedge to create a shallow water area. Allow the fish to spawn for at least 1 h.
- Collect eggs from the bottom of the mating chamber by pouring the water through a fine-mesh net.
- Transfer the eggs to a sterile Petri dish containing fish water at a density no greater than 1 egg per 50 mm2 (approximately 200 eggs per 100 mm dish).
- Remove dead and unfertilized eggs.
NOTE: Healthy fertilized eggs are translucent and round. Remove cloudy, white, unfertilized, or deformed eggs. - Double-check the fish to avoid mixing sexes or cross-contaminating transgenic tanks.
- Return the males and females to their respective tanks.
- Place the embryos in a 28.5°C incubator overnight. Do not exceed the embryo density specified in Step 1.8.
- Bleach the embryos on the following morning to remove contaminants.
- Prepare a working bleach solution consisting of 100 µL bleach in 200 mL system water. Prepare a neutralization solution consisting of 0.5 g sodium thiosulfate in 150–200 mL system water.
- Sort and transfer viable embryos into a mesh-net well insert. Submerge the insert in the bleach solution for 5 min.
- Transfer the insert directly into the sodium thiosulfate solution. Incubate for 2 min to neutralize residual bleach.
- Rinse the embryos in a final bath of fresh system water. Use a squirt bottle to gently transfer the embryos into clean petri dishes containing fresh system water.
- Return the embryos to the incubator after bleaching.
- Transfer larvae at 5–7 days post-fertilization (dpf) or later to a larger tank containing 5 ppt rotifer water for rearing.
- Prepare 5 ppt rotifer water by mixing 1 part stock rotifer water (15 ppt) with 2 parts zebrafish system water.
- Verify that the final salinity is 5 ppt using a conductivity meter before transferring the larvae.
NOTE: Sorting EGFP+ MYCN larvae at 3–5 dpf facilitates identification of tumor-prone fish before rearing. Sorting MYCN embryos at this stage avoids false-negative identification because EGFP expression in neural crest cells may decrease later in development due to MYCN-induced apoptosis.
2. Screening Zebrafish for Fluorescent Markers
- Prepare a 0.4% (w/v) tricaine stock solution using system water.
- Transfer the fish to a clean petri dish containing only enough system water to cover the bottom.
- Add the tricaine stock solution to achieve a final concentration of approximately 0.005% (50 mg/L) for fish younger than 14 dpf or 0.012% (120 mg/L) for fish older than 14 dpf. Confirm adequate anesthesia by observing little to no voluntary movement.
- Remove excess water from the dish once the fish are anesthetized and no longer capable of swimming while maintaining visible opercular or cardiac movement.
- Screen the fish for fluorescence. Identify green or red fluorescence in the expected region (e.g., the interrenal gland region in MYCN fish).
- Separate the fish into groups using a stiff-bristled sorting tool.
NOTE: Sort tumor-prone fish as early as possible because MYCN-induced apoptosis during later developmental stages may result in false-negative identification. Sort immune-reporter fish immediately before imaging at the larval stage or between 2 and 4 months of age for adult studies. This approach minimizes handling-associated stress and maximizes survival. - Transfer positive and negative fish to separate tanks containing system water for continued rearing.
NOTE: Step 3 describes handling and imaging of larvae younger than 21 dpf. Steps 4–6 describe fixation, tissue preparation, imaging, and image analysis of older fish.
3. Larval Live-Mounting and Imaging
- Place sorted larvae in a 100 mm petri dish containing tricaine fish water (see Step 2.3 for age-appropriate concentrations).
- Transfer the sedated larvae to a glass-bottom imaging dish.
- Use only enough solution to cover the larva and maintain sedation.
- Prepare 1%–1.5% low-melting agarose in fish water. Heat the agarose solution until fully dissolved.
- Allow the agarose to cool for 1–2 min. Maintain the agarose at 30°C using a heat block to prevent solidification prior to mounting.
- Position each larva laterally in the imaging dish.
- Apply approximately 30–200 µL of agarose over the larva to immobilize it. Use larger volumes for larger larvae and smaller volumes for smaller larvae.
- Once the agarose has solidified, add approximately 100 µL of 0.005% tricaine solution over the agarose.
- Image the larvae using a confocal microscope.
- Use a standard laser-scanning confocal microscope with a resonant scanner. Use a 40× objective with a numerical aperture greater than 1.10.
- Set the pinhole to 1.0 Airy unit (AU) for all imaging channels.
- Use a 488 nm laser for EGFP excitation and a 594 nm laser for mCherry excitation. Keep laser output below 25 mW to minimize photobleaching and phototoxicity. Adjust detector gain and laser power using a range indicator lookup table (LUT) to avoid pixel saturation and black clipping. Do not exceed a detector gain of 800 V because higher voltages introduce excessive noise.
- Use a voxel size of 0.42 × 0.42 × 6.0 µm (x, y, z) at a resolution of 1024 × 1024 pixels and a Z-step interval of 6.0 µm. Acquire optical sections continuously through the full volume of interest, typically spanning 90–120 µm in total imaging depth. Use highly sensitive photodetectors operating in 16-bit acquisition mode.
- Acquire images using unidirectional line scanning at a resonant scan frequency of 33.3 kHz (approximately 1.58 µs pixel dwell time). Use 2× or 4× averaging to reduce motion artifacts while limiting laser exposure.
NOTE: Optimize tricaine exposure to maintain larval survival during imaging. After imaging, add fish water until the imaging dish is approximately half full.
- Add fresh fish water to the imaging dish immediately after imaging.
- Gently remove the larva from the agarose using a stiff-bristled stick and transfer the larva to a dish containing clean fish water for recovery.
- Return the fish to its original tank once normal swimming behavior resumes.
NOTE: For fish older than 21 dpf, the skin overlying the tumor must be removed by cryosectioning to enable high-resolution confocal imaging.
4. Fish Fixation and Cryosectioning
- Euthanize fish in accordance with approved institutional animal care guidelines.
- Make a ventral incision extending from the anal pore to the pectoral girdle to expose the abdominal cavity and facilitate fixative penetration into internal tissues.
- Transfer the fish using forceps into a 1.5 mL tube containing 4% paraformaldehyde (PFA) in phosphate-buffered saline (PBS) or a volume of fixative at least 10-fold greater than the tissue volume.
NOTE: Avoid handling the region containing the tumor to preserve tissue integrity. - Place the samples on a nutating rocker set to gentle continuous agitation (30 rpm) and incubate overnight for at least 12 h at 4°C.
CAUTION: PFA is hazardous, toxic, and potentially carcinogenic. Wear appropriate personal protective equipment, including gloves and eye protection. Perform all procedures involving PFA in a fume hood and avoid inhalation of vapors. - Remove the PFA and wash the samples at least four times with 1.5 mL of 1× PBS. Gently invert the tube two to three times during each wash.
- Transfer the fish to 30% sucrose prepared in PBS.
- Incubate the fish in a cold room overnight until the specimen sinks to the bottom of an upright tube (approximately 12 h), indicating adequate sucrose penetration.
- Remove excess sucrose solution by gently blotting the fish on a laboratory tissue.
- Transfer the fish to storage tubes.
- Store the samples at −80°C until imaging.
NOTE: Process samples within 3 months to minimize fluorescent protein degradation and signal loss. - Transport the fixed fish to the cryostat room on dry ice.
- Place the fish flat in a plastic mold with one sagittal side facing downward.
- Add Optimal Cutting Temperature (OCT) compound until the fish is fully covered.
- Freeze the mold at −20°C or in the cryostat until the OCT turns white.
NOTE: Position the fish as flat as possible before freezing to facilitate consistent sectioning. - Cryosection the zebrafish in the sagittal plane to remove the skin for subsequent whole-mount imaging.
- Cool the cryostat chuck.
- Apply room-temperature OCT to the chuck.
- Press the OCT fish block firmly into the OCT layer.
- Freeze the chuck and block until the newly applied OCT turns white.
- Mount the chuck in the cryostat.
- Cryosection the block at a thickness of 14 µm until the blade reaches the specimen.
NOTE: Specimen shifting may occur during freezing, causing the fish to sit higher in the block than expected. Entry into the specimen is indicated by the appearance of translucent tissue replacing the opaque OCT background. - Reduce the section thickness to 7 µm.
- Continue sectioning for one additional cut.
NOTE: This procedure removes the skin while preserving a uniform sagittal profile across the specimen. - Confirm the endpoint by identifying skin in the collected sections.
NOTE: Skin appearance in sections provides a more reliable indicator than eye morphology. Perform this procedure only when the skin obscures imaging of the tumor microenvironment.
- Warm the chuck gently with your hands.
- Remove the OCT block from the chuck using forceps. Avoid disturbing the cut surface of the specimen.
- Trim excess OCT surrounding the fish while the OCT remains frozen.
- Remove the fish from the OCT block using forceps once the OCT softens to a viscous consistency.
5. Mounting and Imaging of Fish with Skin Removed
- Place the fish in a glass-bottom dish with the sectioned sagittal side facing the glass surface.
NOTE: Maintain the orientation of the fish during handling. Identifying the sectioned side may become difficult after the fish is removed from the OCT block. - Prepare 1%–1.5% low-melting agarose.
- Apply approximately 30–50 µL of agarose to the dorsal and ventral sides of the fish to secure the sample.
NOTE: Avoid placing agarose beneath the fish because it can reduce image quality. Use only the minimum amount of agarose required for stabilization. - Keep the sample on ice during transport. Image the sample within 2 h of mounting.
- Transport the sample to the confocal microscopy facility.
- Image the sample using confocal microscopy.
- Use a standard laser-scanning confocal microscope with a resonant scanner. A two-photon microscope may be used when autofluorescence limits image quality. Use a corrected 20× objective lens with a numerical aperture of at least 0.80.
- Set the pinhole to 1.0 Airy unit (AU) for all imaging channels.
- Use a 488 nm laser for EGFP excitation and a 594 nm laser for mCherry excitation. Keep laser output below 25 mW. Adjust detector gain and laser power using a range indicator lookup table (LUT) to avoid pixel saturation and black clipping. Do not exceed a detector gain of 800 V because higher voltages introduce excessive noise.
- Configure image acquisition parameters as follows.
- Use a voxel size of 0.42 × 0.42 × 6.0 µm (x, y, z) at a resolution of 1024 × 1024 pixels and a Z-step interval of 6.0 µm.
- Acquire spectral image stacks through the full volume of interest, typically spanning a total Z-stack acquisition range of 90–120 µm (15–20 optical sections).
- Initiate image acquisition in the fluid space immediately above the tissue surface and continue through the full target imaging depth to ensure complete coverage of the specimen.
- Acquire images using highly sensitive photodetectors operating in 16-bit acquisition mode.
- Acquire images using unidirectional line scanning at a resonant scan frequency of 33.3 kHz (approximately 1.58 µs pixel dwell time) with 8× line averaging.
6. Image Analysis and Quantification
- Image visualization using Fiji (version 1.54p).
- Open the confocal z-stack images.
- Merge colors to see channel overlay by selecting Image > Color > Merge Channels.
- Generate a projection of the full z-range containing the imaging region by selecting Image > Stacks > Z Project. Enter the slice range of interest, as well as Max Intensity projection type. This will display the 2D projection of the image.
NOTE: For larval fish, it is feasible to capture the whole TME by confocal microscopy. Therefore, we recommend the volumetric normalization and quantification method for the TME analysis. For older fish, it is impossible to capture the whole TME by confocal microscopy; therefore, we recommend applying the area-based normalization and quantification method. Based on our analysis and quantification of the larval fish, both methods can provide reliable biological results.
- Volumetric normalization and quantification of the TME in the larval fish.
- Quantifying tumor volume using MATLAB R2022b (download the package from the Matlab website) and Bio-Formats package (download from the openmicroscopy website).
- The user runs a script that performs the following tasks:
- Prompt the user to select a .CZI file from their computer.
- Read the image and extract the data from the channel containing the tumor region.
- Identify the region for each slice that is the tumor region through a threshold of fluorescence (can be through user input or machine learning), keeping the same threshold for all analyzed images for consistency.
- Outline the tumor region and display the image with the tumor region outlined in a collage of all slices for user verification.
- Calculate the area of the tumor region per slice in pixels and convert to mm2 using the scale of the image and imaging settings.
- Multiply the area of the tumor region by the depth (stored in the file’s metadata) to get the volume of each slice.
- Sum the calculated values of each slice to obtain the total volume of the imaged tumor and its surrounding region in voxels or mm3.
- Scale both volume measurements by multiplying by 104 for tumor volume and 106 for the surrounding region. This will create a more reasonable cell number:volume ratio during normalization.
- Quantifying cell number.
- Open the confocal z-stack images.
- Merge colors to see channel overlay by selecting Image > Color > Merge Channels.
- Generate a 3D view of the full z-range containing the imaging region by selecting Image > Stacks > 3D Project. Select Brightest Point as the projection method and other settings to the desired values.
- Due to the small number of cells, manually count and tabulate the cells, separating cells located within the tumor boundary from those located outside the tumor boundary.
NOTE: Cells on the boundary of the tumor region are counted as being outside.
- Normalization.
- For infiltrating cells inside the tumor region, divide the number of cells by the scaled tumor volume. For the cells outside the tumor region, divide the number of cells outside the tumor volume by the scaled volume of the full image minus the tumor volume.
- Generate a table that includes the following headings: “fish identification”, “tumor volume”, “# of cells inside tumor region”, “# of cells outside tumor region”, “normalized cells inside”, “normalized cells outside”.
- Area-based normalization and quantification of the TME.
- Define the tumor region of interest (ROI) using the Rectangle or Freehand selection tool to outline the tumor.
- Add the ROI to the ROI Manager by pressing T or by selecting Analyze > Tools > ROI Manager > Add.
- Measure the ROI area using Analyze > Measure.
- Confirm that Area is selected under Set Measurements before recording measurements.
- Save the ROI in the ROI Manager.
- Apply the same ROI to all images using ROI Manager > More > Multi-Measure.
- Do not resize the ROI between images.
- Manually count cells within the ROI. If cells are more, count cells using the Cell Counter plugin by selecting Plugins > Analyze > Cell Counter.
- Mark each counted cell by left-clicking when its centroid falls within the ROI.
- Scroll through the z-stack to verify cell identity.
- Avoid counting the same cell more than once across multiple image planes.
- Count infiltrating cells separately if they contact or lie within the tumor boundary.
- Record infiltrating cells as a distinct category even when the cell centroid falls outside the ROI.
- Convert the ROI area from pixels to mm2.
- Obtain the pixel width, pixel height, and Z-step interval from Image > Properties.
- Calculation of normalized cell counts.
- Divide the raw cell count for each fish by the corresponding ROI area value.
- Record the resulting value as the normalized cell count.
- For absolute density measurements, calculate the physical area using the image calibration values obtained from Image > Properties.
- Divide the raw cell count by the calculated area (mm2).
- Record the result as cell density expressed as cells/mm2.
결과
전체적인 실험 워크플로우는 그림 1에 나타나 있습니다. 성체 Tg(cd4-1:mCherry) 제브라피시를 Tg(dβh:MYCN;dβh:EGFP) 제브라피시와 교배하여, CD4+ 세포와 dβh 발현 세포가 각각 mCherry와 EGFP 형광으로 다르게 표지된 복합 형질전환 자손을 생성하였습니다. 배아에서 적절한 형광 마커가 나타나는지 스크리닝한 후, 치어 발달 단계 동안의 살아있는 상태의 공초점 이미징 또는 성체 물고기의 고정 및 동결 절편 후 공초점 이미징을 통해 분석하였습니다(그림 1).
유충 발달 과정 중 전암 단계의 신경모세포종 병변과 CD4+ 세포의 연관성을 평가하기 위해, 수정 후 7일 및 14일(dpf)에 복합 형질전환 어류를 이미징하였습니다. 이 시점들은 제브라피시 림프구 발달 단계26,27를 기반으로 선정되었습니다. 대표적인 공초점 이미지는 그림 2A에 제시되어 있습니다. 7 dpf에서 CD4+ 세포는 대조군과 MYCN 발현 어류 모두에서 dβh 발현 영역 내부 또는 주변에서 드물게 관찰되었습니다(그림 2A; 보충 영상 1 및 2). 14 dpf에서 MYCN 발현 어류는 대조군 어류의 신경릉 유래 교감신경-부신 전구세포 영역과 비교하여, 신경릉 유래 전암성 종양과 연관된 CD4+ 세포 수가 증가한 것을 보였습니다(그림 2A; 보충 영상 3 및 4).
종양 크기의 차이와 공초점 현미경으로 치어의 전체 종양을 캡처하는 능력을 고려하여, 부피 기반 및 면적 기반 정규화 방법을 모두 비교하였습니다. 중요한 점은, 치어에서 부피 기반 및 면적 기반 정규화 방법이 유사한 결과를 나타냈다는 것이며, 이는 공초점 현미경으로 전체 종양 부피를 캡처할 수 없는 성체 종양의 경우 면적 기반 정규화를 사용할 수 있음을 뒷받침합니다. 정량 분석 결과, 두 시점 모두에서 그룹 간 주변 CD4+ 세포 수에 유의미한 차이가 없었습니다(그림 2B, 하단; 대조군과 MYCN 그룹에 대해 7 dpf에서 n = 4 및 6, 14 dpf에서 n = 4 및 5). 반면, MYCN을 발현하는 물고기는 대조군 물고기에 비해 14 dpf의 분석 영역 내에서 CD4+ 세포의 침윤이 유의미하게 더 많이 나타났습니다(그림 2B, 상단; P < 0.05; 대조군과 MYCN 그룹에 대해 n = 4 및 5). 데이터는 종양 부피 대비 정규화된 세포 수(cells/mm3)로 제시되었으며, 평균 ± SEM으로 표기되었습니다.
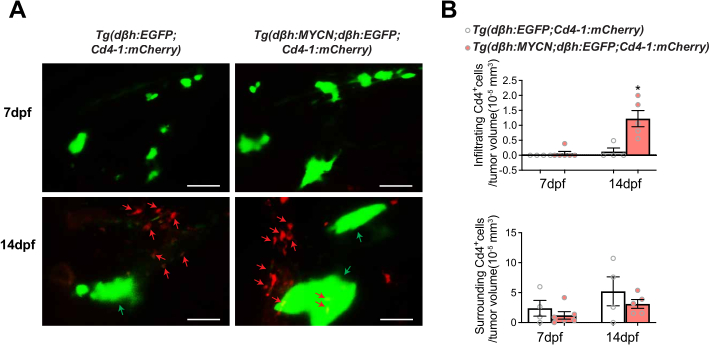
그림 2수정 후 14일째에 MYCN을 발현하는 신경모세포종 병변과 CD4+ 세포의 연관성 증가. (A) 의 대표 공초점 이미지 Tg(dβh:EGFP;Cd4-1:mCherry) 대조군 어류 및 Tg(dβh:MYCN;dβh:EGFP;Cd4-1:mCherry) 수정 후 7일 및 14일(dpf)의 물고기. EGFP 양성 세포(녹색)는 다음을 표시함 dβh-발현 신경능선 유래/신경모세포종 세포 및 CD4+ 세포는 mCherry(적색)로 표지되었습니다. 화살표는 대표적인 CD4를 나타냅니다.+ 신경능선/종양 부위와 관련된 세포. 스케일 바 = 50 µm. (B) CD4 정량 분석+ 7 dpf 및 14 dpf의 대조군 및 MYCN 발현 어류에서 신경능선/종양 영역을 둘러싸고 있거나(하단) 침투하고 있는(상단) 세포들. 세포 수는 종양 부피(cells/mm³)로 표준화되었다.3). 데이터는 평균으로 표시되었습니다. ± SEM. 통계적 비교는 비쌍체 꼬리 양측 검정을 사용하여 수행되었습니다. 제공된 텍스트가 없습니다. 번역할 내용을 입력해 주세요.-검사. P < 0.05. 대조군과 MYCN 군에 대해 7 dpf에서는 n = 4 및 6, 14 dpf에서는 n = 4 및 5. 세 번의 독립적인 실험에서 얻은 대표 데이터. 이 그림의 더 큰 버전을 보시려면 여기를 클릭하십시오.
기존 종양과 CD4+ 세포의 연관성을 조사하기 위해, 분류된 복합 형질전환 어류를 성체까지 성장시킨 후 고정, 동결 절편 제작 및 공초점 이미징을 통해 분석하였습니다(그림 1). 4개월 된 어류의 국소성 및 전이성 신경모세포종의 대표 이미지는 그림 3A에 나와 있습니다. EGFP 양성 종양 세포가 말초 교감 신경절 외부에서 검출될 때 전이성 종양으로 분류하였습니다. 공초점 현미경으로는 종양 전체 부피를 캡처할 수 없으므로, 면적 기반 정량화 방법을 적용하였습니다. 분석 결과, 국소성 종양에 비해 전이성 종양 주변이나 내부로 침윤한 CD4+ 세포 수가 유의미하게 증가한 것으로 나타났습니다(그림 3B; P < 0.05; 그룹당 n = 4). 데이터는 종양 면적당 정규화된 세포 수(cells/mm2)로 표시되었으며, 평균 ± SEM으로 나타냈습니다.
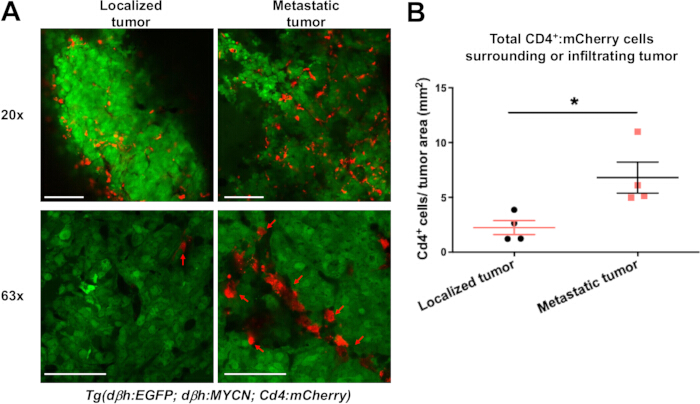
그림 3. 전이성 신경모세포종은 종양 미세환경 내에서 CD4+ 세포 침윤이 증가함을 보여준다. (A) 4개월령의 형제 Tg(dβh:MYCN;dβh:EGFP;Cd4-1:mCherry) 제브라피시에서 발생한 국소성 및 전이성 신경모세포종의 대표적인 공초점 이미지. 종양 세포는 EGFP(녹색)로, CD4+ 세포는 mCherry(적색)로 표지되었다. 화살표는 종양 조직과 연관된 대표적인 CD4+ 세포를 나타낸다. 20× 및 63× 대물렌즈를 사용하여 획득한 이미지를 독립적인 시야로 보여준다. 스케일 바 = 100 µm (20×) 및 50 µm (63×). (B) 국소성 및 전이성 종양 주변 또는 내부에 침윤된 전체 CD4+ 세포의 정량화. 세포 수는 프로토콜에 설명된 대로 종양 크기에 따라 정규화되었다. 데이터는 평균 ± SEM으로 표시되었다. 통계적 비교는 비쌍체 꼬리 t-검정을 사용하여 수행되었다. P < 0.05. 그룹당 n = 4. 세 번의 독립적인 실험에서 얻은 대표 데이터. 이 그림의 더 큰 버전을 보시려면 여기를 클릭하십시오.
이러한 결과는 본 프로토콜을 사용하여 제브라피시의 종양 발달 단계별 신경모세포종 병변과 관련된 CD4+ 세포를 시각화하고 정량화할 수 있음을 보여줍니다.
보충 영상 1. 수정 후 7일 된 대조군 제브라피시의 대표적인 공초점 z-스택 이미지. 수정 후 7일(dpf) 된 Tg(dβh:EGFP;Cd4-1:mCherry) 대조군 제브라피시의 3차원 공초점 이미징. EGFP 양성 신경능 유래 세포는 녹색으로, CD4+ 세포는 적색으로 표시됨. 이 발달 단계에서는 dβh 발현 영역 내부 또는 주변에서 CD4+ 세포가 거의 관찰되지 않음. 이 파일을 다운로드하려면 여기를 클릭하십시오.
보충 영상 2. 수정 후 7일 된 MYCN 발현 제브라피쉬의 대표적인 공초점 z-스택 영상. 수정 후 7일(dpf) 된 Tg(dβh:MYCN;dβh:EGFP;Cd4-1:mCherry) 제브라피쉬의 3차원 공초점 이미지입니다. EGFP 양성 MYCN 발현 전암성 신경모세포종 세포는 녹색으로, CD4+ 세포는 적색으로 표시되었습니다. 대조군 물고기와 마찬가지로, 이 초기 발달 단계에서는 종양 영역 내부 또는 주변에서 소수의 CD4+ 세포만이 관찰됩니다. 이 파일을 다운로드하려면 여기를 클릭하십시오.
보충 영상 3. 수정 후 14일째 대조군 제브라피시의 대표적인 공초점 z-스택 영상. 수정 후 14일(dpf) 된 Tg(dβh:EGFP;Cd4-1:mCherry) 대조군 제브라피시의 3차원 공초점 이미지입니다. EGFP 양성 신경능선 유래 세포는 녹색으로, CD4+ 세포는 적색으로 표시되었습니다. CD4+ 세포는 드물게 분포하며 dβh 발현 부위와 제한적인 연관성을 보입니다. 이 파일을 다운로드하려면 여기를 클릭하십시오.
보충 영상 4. 수정 후 14일 된 MYCN 발현 제브라피쉬의 대표적인 공초점 z-스택 영상. 수정 후 14일(dpf) 된 Tg(dβh:MYCN;dβh:EGFP;Cd4-1:mCherry) 제브라피쉬의 3차원 공초점 이미지. EGFP 양성 MYCN 발현 전암성 신경모세포종 세포는 녹색으로, CD4+ 세포는 적색으로 표시됨. 연령이 일치하는 대조군 물고기와 비교했을 때, 확대된 종양 부위와 연관하여 CD4+ 세포의 축적 및 침윤이 증가한 것이 관찰되며, 이는 그림 2B에 제시된 정량 분석 결과와 일치함. 이 파일을 다운로드하려면 여기를 클릭하십시오.
토론
여기에 설명된 프로토콜은 TME 내의 면역 세포를 시각화하고 정량화하기 위해 제브라피시를 in vivo 모델로 활용합니다. 이 접근법을 성공적으로 구현하기 위해서는 몇 가지 요인이 매우 중요합니다. 첫째, 적절한 복합 형질전환 제브라피시 라인의 선택과 검증이 필수적입니다. 치어에서 예상되는 형광 발현 패턴을 스크리닝해야 하며, 필요한 경우 유전형 분석을 통해 확인해야 합니다. 실험군과 대조군을 정확하게 지정하기 위해 실험 전에 면역 리포터 및 온코진(oncogene) 발현을 검증해야 합니다. 둘째, 공초점 이미징 중에 관심 영역을 정확하게 식별하는 것이 중요합니다. 명시야 이미징을 사용하여 해부학적 지표를 식별하고 표적 조직의 위치 파악을 용이하게 할 수 있습니다. 예를 들어, 전신 부위의 종양을 이미징할 때 눈을 지표로 사용하여 위치를 잡을 수 있습니다. 셋째, 이미징 영역이 충분히 노출되도록 물고기를 적절하게 배치하는 것이 필수적입니다. 정렬이 제대로 되지 않으면 이미지 품질이 저하되거나 관심 조직이 가려질 수 있습니다. 마지막으로, 라이브 이미징 중 움직임으로 인한 아티팩트를 최소화하기 위해 적절한 마운팅과 고정이 필요합니다. 치어의 생존력을 유지하면서 이미지 품질을 보존할 수 있도록 Tricaine 농도와 이미징 시간을 최적화해야 합니다.
실시간 이미징 중에 레이저 강도와 노출 시간을 줄이면 광독성을 최소화할 수 있습니다. 성체 시료의 경우, 반복적인 해동이 조직의 무결성을 변화시킬 수 있으므로 취급 및 이미징 준비 과정 동안 조직을 얼음 위에 유지해야 합니다. 특히 동결 절편 제작 후 OCT 블록에서 분리한 뒤에는 시료를 주의 깊게 취급하는 것이 중요합니다.
이미징 결과의 해석에는 리포터 특이성에 대한 고려가 필요합니다. 여러 면역 리포터 라인은 다수의 면역 세포군을 표지합니다. 예를 들어, CD4 발현은 일반적인 T 세포 외에 대식세포를 포함한 세포군에서도 보고된 바 있습니다28. 또한, mpeg 발현은 대식세포 외에도 B 세포에서 검출됩니다29. Lysc는 호중구와 대식세포를 모두 표지할 수 있습니다30. 따라서 형광 리포터 발현만으로는 세포의 정체성을 확정적으로 지정하기에 충분하지 않을 수 있습니다. RNAscope, 유세포 분석, 정량적 역전사 중합효소 연쇄 반응 또는 단일 세포 RNA 시퀀싱과 같은 추가적인 검증 방법이 이미징 기반의 관찰을 보완하여 표지된 세포군에 대한 추가적인 분자적 특성 분석을 제공할 수 있습니다.
이 방법에는 몇 가지 한계점이 있습니다. 이 접근 방식은 형광 리포터 발현에 의존하므로 면역 세포의 정체성이나 기능적 상태를 독립적으로 확인할 수 없습니다. 또한, 성체 어류를 대상으로 하는 현재 워크플로우의 이미지 분석은 제한된 층의 투영된 공초점 데이터셋을 기반으로 하므로, TME 내의 복잡한 3차원 세포 관계를 완전히 포착하지 못할 수 있습니다. 마지막으로, 이 방법은 복합 전이성 제브라피쉬 라인의 생성 및 유지가 필요하며, 이는 일부 실험실의 접근성을 제한할 수 있습니다.
이러한 한계에도 불구하고, 본 프로토콜은 제브라피시의 신경모세포종 병변과 관련된 면역 세포를 시각화하는 실용적인 접근법을 제공합니다. 기존의 종점 조직학적 분석과 비교하여, 이 방법은 조직 구조를 보존하며 온전한 조직 내에서 형광 표지된 세포의 이미징을 가능하게 합니다20,21. 이 워크플로우는 여러 발달 단계에 걸쳐 적용될 수 있으며, 추가적인 형광 리포터 라인에 맞춰 조정될 수 있습니다. 신경모세포종 외에도, 여러 연구에서 CD4+ 세포, 대식세포 및 CD8+ 세포를 포함한 흑색종과 면역 세포 간의 상호작용을 분석하기 위해 TME를 이미징하였습니다15,21,31,32. 종합하면, 이러한 특징들은 본 프로토콜을 제브라피시 TME 내의 면역 세포 국소화를 연구하는 데 유용한 플랫폼으로 만들어 줍니다.
공개 사항
저자들은 이해상충이 없음을 밝힙니다.
감사의 글
본 연구는 National Institutes of Health (NIH; 1UL1TR001430, CA215059, NS140967), American Cancer Society (RSG-17-204-01-TBG), National Science Foundation (1911253) 및 Alex’s Lemonade Stand Foundation의 H.F.에 대한 지원과 Warren Alpert Distinguished Scholars Fellowship의 X.Q.에 대한 지원을 통해 수행되었습니다. Y.W.는 Boston University Undergraduate Research Opportunities Program (UROP) 및 St. Baldrick’s Summer Fellowship Program의 지원을 받았으며, M.V.는 St. Baldrick’s Summer Fellowship Program의 지원을 받았습니다. 본 논문의 내용은 전적으로 저자들의 책임이며, 반드시 NIH의 공식 견해를 대표하는 것은 아닙니다.
재료
| 이름 | 회사 | 카탈로그 번호 | 댓글 |
|---|---|---|---|
| 200 µL Gel Loading Tip | MilliporeSigma | 1022-0600 | 치어 조작용 |
| 인조 식물 | The Hidden Reef | 62874200000000000 | 선택적 번식 환경 풍부화용 |
| 표백제 | Fisher Scientific | 50371500 | 배아 오염 제거용 |
| Cell Counter 플러그인 | National Institutes of Health (NIH) | N/A | 세포 정량화를 위한 Fiji 플러그인 |
| 컴퓨터 및 모니터 | HP | 2TB68A8#ABA | 이미지 획득 및 분석용 |
| 공초점 현미경 | Zeiss | LSM 710 | 치어 및 성어 이미징용 |
| 플라스틱 Cryomold | Epredia | 22-050-160 | OCT 매립용 |
| 크라이오스탯(Cryostat) | Thermo Fisher Scientific | 95-664-0EC70 | 동결 절편 제작용 |
| 드라이아이스 | Fisher Scientific | N/A | 시료 운반용 |
| Fiji 소프트웨어 | National Institutes of Health (NIH) | Version 1.54p | 이미지 분석 소프트웨어 |
| 미세 망 뜰채 | Carolina Biological | 651345 | 배아 수집용 |
| 어류 인큐베이터 | VWR | 35960-056 | 28.5°C로 유지 |
| 포셉(Forceps) | Fisher Scientific | 10-316B | 시료 취급용 |
| 유리 바닥 접시 | IBIDI | 81218-200 | 이미징용 |
| 저융점 아가로스 | Prolab Supply | 9012-36-6 | 치어 및 성어 고정용 |
| 교배 수조 (메인 탱크, 구분막, 격자 섹션) | Carolina Biological | 161937 | 제브라피시 번식용 |
| 뉴테이팅 로커(Nutating Rocker) | Midsci | R2D-30 | 하룻밤 동안의 인큐베이션 중 고정용 |
| OCT 화합물 | Tissue-Tek | 4583 | 동결 절편 제작을 위한 매립 매질 |
| 파라포름알데히드 (PFA) | Sigma Aldrich | 158127-500G | 고정액 |
| 플라스틱 페트리 접시 | MilliporeSigma | BR452000 | 배아 및 치어 취급용 |
| 인산 완충 식염수 (PBS) | Gibco | 14080-055 | 세척 및 고정 절차용 |
| 플라스틱 전송 피펫 | Fisher Scientific | 50-998-100 | 배아 및 치어 이동용 |
| 면도날 | Fisher Scientific | 12-640 | 시료 준비 중 사용 |
| 전도도 측정기 | YSI | EC300ACC-04 | 로티퍼 배양액의 염도 확인용 |
| 로티퍼 | The Hidden Reef | 116151603 | 치어 사육용 |
| 티오황산나트륨 | Thermo Fisher Scientific | AAA1762936 | 표백제 중화용 |
| 설탕(Sucrose) | Fisher Scientific | S25590A | 동결 보호제 |
| Tricaine Methanesulfonate | Western Chemical | NC0872873 | 마취제; Fisher Scientific에서 판매 |
| 핀셋 | Fisher Scientific | 12-000-122 | 시료 취급용 |
| 정립 형광 현미경 | Leica | M165 | 형광 스크리닝용 |
참고문헌
- Anderson NM, Simon MC. The tumor microenvironment. Curr Biol. 2020;30(16):R921-R925.
- Kumagai S, Momoi Y, Nishikawa H. Immunogenomic cancer evolution: A framework to understand cancer immunosuppression. Sci Immunol. 2025;10(105):eabo5570.
- Keren L, et al. A structured tumor-immune microenvironment in triple negative breast cancer revealed by multiplexed ion beam imaging. Cell. 2018;174(6):1373-1387.e19.
- Gerner MY, et al. Histo-cytometry: A method for highly multiplex quantitative tissue imaging analysis applied to dendritic cell subset microanatomy in lymph nodes. Immunity. 2012;37(2):364-376.
- Pittet MJ, Weissleder R. Intravital imaging. Cell. 2011;147(5):983-991.
- Wienke J, et al. The immune landscape of neuroblastoma: Challenges and opportunities for novel therapeutic strategies in pediatric oncology. Eur J Cancer. 2021;144:123-150.
- Spitzer MH, Nolan GP. Mass cytometry: Single cells, many features. Cell. 2016;165(4):780-791.
- Roy D, et al. Zebrafish—A suitable model for rapid translation of effective therapies for pediatric cancers. Cancers (Basel). 2024;16(7):1361.
- White RM, et al. Transparent adult zebrafish as a tool for in vivo transplantation analysis. Cell Stem Cell. 2008;2(2):183-189.
- MacRae CA, Peterson RT. Zebrafish as tools for drug discovery. Nat Rev Drug Discov. 2015;14(10):721-731.
- Miao KZ, et al. Tipping the scales with zebrafish to understand adaptive tumor immunity. Front Cell Dev Biol. 2021;9:660969.
- Povoa V, et al. Innate immune evasion revealed in a colorectal zebrafish xenograft model. Nat Commun. 2021;12(1):1156.
- Wang J, et al. Novel mechanism of macrophage-mediated metastasis revealed in a zebrafish model of tumor development. Cancer Res. 2015;75(2):306-315.
- Loveless R, Shay C, Teng Y. Unveiling tumor microenvironment interactions using zebrafish models. Front Mol Biosci. 2020;7:611847.
- Dee CT, et al. CD4-transgenic zebrafish reveal tissue-resident Th2- and regulatory T cell-like populations and diverse mononuclear phagocytes. J Immunol. 2016;197(9):3520-3530.
- Murali Shankar N, et al. Preclinical assessment of CAR-NK cell-mediated killing efficacy and pharmacokinetics in a rapid zebrafish xenograft model of metastatic breast cancer. Front Immunol. 2023;14:1254821.
- Tan KE, et al. LMO1 expression in neuroblastoma cells reprograms tumor-associated macrophages to promote metastasis. iScience. 2026;29(3):115144.
- Fior R, et al. Single-cell functional and chemosensitive profiling of combinatorial colorectal therapy in zebrafish xenografts. Proc Natl Acad Sci U S A. 2017;114(39):E8234-E8243.
- Fazio M, et al. Zebrafish patient avatars in cancer biology and precision cancer therapy. Nat Rev Cancer. 2020;20(5):263-273.
- Qin X, et al. CKLF instigates a “cold” microenvironment to promote MYCN-mediated tumor aggressiveness. Sci Adv. 2024;10(11):eadh9547.
- Ludin A, et al. CRATER tumor niches facilitate CD8+ T cell engagement and correspond with immunotherapy success. Cell. 2025;188(24):6720-6736.e26.
- Zhu S, et al. LMO1 synergizes with MYCN to promote neuroblastoma initiation and metastasis. Cancer Cell. 2017;32(3):310-323.e5.
- Tao T, et al. The pre-rRNA processing factor DEF is rate limiting for the pathogenesis of MYCN-driven neuroblastoma. Oncogene. 2017;36(27):3852-3867.
- Zimmerman MW, et al. MYC drives a subset of high-risk pediatric neuroblastomas and is activated through mechanisms including enhancer hijacking and focal enhancer amplification. Cancer Discov. 2018;8(3):320-335.
- Dankert EN, Look AT, Zhu S. Unraveling neuroblastoma pathogenesis with the zebrafish. Cell Cycle. 2018;17(4):395-396.
- Langenau DM, et al. In vivo tracking of T cell development, ablation, and engraftment in transgenic zebrafish. Proc Natl Acad Sci U S A. 2004;101(19):7369-7374.
- Lam SH, et al. Development and maturation of the immune system in zebrafish, Danio rerio: A gene expression profiling, in situ hybridization and immunological study. Dev Comp Immunol. 2004;28(1):9-28.
- Zhen A, et al. CD4 ligation on human blood monocytes triggers macrophage differentiation and enhances HIV infection. J Virol. 2014;88(17):9934-9946.
- Ferrero G, et al. The macrophage-expressed gene (mpeg)1 identifies a subpopulation of B cells in the adult zebrafish. J Leukoc Biol. 2020;107(3):431-443.
- Hall C, et al. The zebrafish lysozyme C promoter drives myeloid-specific expression in transgenic fish. BMC Dev Biol. 2007;7:42.
- Lorenzini F, et al. Melanoma innervation, noradrenaline and cancer progression in zebrafish xenograft model. Cell Death Discov. 2025;11(1):260.
- Ramakrishnan G, et al. Real-time imaging reveals a role for macrophage protrusive motility in melanoma invasion. J Cell Biol. 2025;224(2):e202403096.
재인쇄 및 허가
이 논문이 게재되었습니다
동영상 곧 제공