Dit protocol beschrijft methoden voor het genereren van samengestelde transgene zebravisjes, het imagen van immuuncellen geassocieerd met tumoren in larvale en volwassen zebravisjes, en het kwantificeren van de frequentie van immuuncellen binnen de tumor-micro-omgeving.
Methodenartikel
Beeldvorming en kwantificering van immuuncellen in de tumoromgeving met behulp van een zebravismodel voor neuroblastoom
* These authors contributed equally
In dit artikel
Samenvatting
Samenvatting
De rekrutering van immuuncellen naar de tumoromgeving (TME) is een belangrijk onderdeel van de immuunregulatie en tumorprogressie. Het bestuderen van de ruimtelijke en temporele relaties tussen immuuncellen en tumorcellen in vivo kan inzicht bieden in interacties binnen de TME. Het visualiseren en kwantificeren van deze interacties in intacte organismen blijft echter uitdagend met conventionele beeldvormings- en histologische benaderingen. Zebravissen vormen een waardevol model voor kankeronderzoek vanwege hun genetische hanteerbaarheid, snelle ontwikkeling en optische transparantie tijdens vroege ontwikkelingsstadia, waardoor visualisatie van fluorescentiegelabelde cellen mogelijk is. in vivoHier presenteren wij een protocol voor het genereren, identificeren, beelden en kwantificeren van immuun- en tumorcellen die differentieel zijn gelabeld met fluorescente markers in een zebravismodel van neuroblastoom. Het protocol omvat het fokken en screenen van samengestelde transgene zebravisjes, live-imaging van larven, de preparatie en beeldvorming van volwassen tumordragende vissen, en de kwantificering van immuuncellen rondom en binnen tumorregio's. Met behulp van transgene reporterlijnen, CD4+ immuuncellen en MYCN-gestuurde neuroblastoomcellen kunnen worden gevisualiseerd en geanalyseerd in verschillende ontwikkelingsstadia. De workflow maakt het mogelijk om de lokalisatie van immuuncellen ten opzichte van tumoren in zowel larvale als volwassen vissen te beoordelen en kan worden gebruikt om de abundantie van immuuncellen in verschillende ziektestadia te vergelijken. Dit protocol biedt een reproduceerbare aanpak voor het imagen en kwantificeren van immuuncellen binnen de TME in vivo met gebruik van zebravis en kan studies naar immuun-tumorinteracties in andere kankermodellen faciliteren.
Inleiding
De tumoromgeving (TME) is een ecosysteem bestaande uit tumor-, immuun-, fibroblast- en vasculaire cellen1. De TME speelt een essentiële rol bij de progressie van kanker, de therapeutische respons en de antitumorale immuniteit. Binnen de TME zijn immuuncellen belangrijke regulatoren van het lot van de tumor, waarbij ze ofwel deelnemen aan antitumorale responsen ofwel immunosuppressie induceren2. Het begrijpen van de rekrutering, distributie en functie van immuuncellen binnen de TME is cruciaal voor het verduidelijken van de mechanismen waarmee tumoren aan immuunbewaking ontsnappen. Conventionele benaderingen voor het bestuderen van de TME, zoals eindpunt-histologie, flowcytometrie en single-cell sequencing, bieden echter slechts statische momentopnames en vereisen vaak de verstoring van de weefselstructuur, wat resulteert in het verlies van ruimtelijke informatie en cel-celinteracties3,4,5,6,7. Bovendien zijn deze methoden beperkt in hun vermogen om immuuncellen binnen de TME te visualiseren en te kwantificeren, vooral tijdens de vroege stadia van tumorontwikkeling.
Zebravissen (Danio rerio) zijn een krachtig model voor kankeronderzoek vanwege hun lage kosten, snelle ontwikkeling, relatieve transparantie en hoge genetische conservatie8,9. Deze voordelen bieden een reproduceerbaar en schaalbaar experimenteel systeem dat grote steekproefgroottes en efficiënte microscopische screening binnen een kort tijdsbestek mogelijk maakt10. Belangrijk is dat zebravissen een aanzienlijke immunologische conservatie delen met mensen, inclusief sleutelcomponenten van zowel het aangeboren als het adaptieve immuunsysteem, waardoor bevindingen relevant zijn voor menselijke ziekten11. Deze eigenschappen zijn bijzonder nuttig voor het bestuderen van pediatrische kankers zoals neuroblastoom8. Bijgevolg zijn er talrijke immuun-reporterlijnen en kankermodellen voor zebravissen ontwikkeld11. Daarom dienen zebravissen als een waardevol in vivo model voor het bestuderen van interacties tussen tumor- en immuuncellen, wat inzicht biedt in hoe immuunregulatie de tumorgroei vormgeeft, met name tijdens de vroege stadia.
Eerdere studies naar de TME in zebravissen waren sterk afhankelijk van tumorxenograft-modellen in combinatie met endpoint-imaging om de lokalisatie van immuuncellen binnen tumoren te beoordelen12,13,14,15,16,17. Hoewel deze methoden nuttige inzichten bieden, worden ze beperkt door hun afhankelijkheid van tweedimensionale imaging, die de driedimensionale organisatie van de TME en de ruimtelijke relaties tussen tumor- en immuuncellen tijdens de ontwikkeling niet volledig kan vastleggen14. Daarnaast houden tumorxenograft-modellen in dat menselijke tumorcellen kunstmatig worden getransplanteerd, waardoor de natuurlijke tumorinitiatie mogelijk niet volledig wordt gereproduceerd18. Deze modellen zijn doorgaans ook kortstondig en kunnen de tumorprogressie of veranderingen in de ruimtelijke relatie tussen tumor- en immuuncellen tijdens de ontwikkeling niet volledig volgen14,19. Bovendien biedt deze benadering een beperkte weergave van de ruimtelijke organisatie, de ontwikkelingscontext en de fysiologische relevantie van het gedrag van immuuncellen binnen de TME. Onlangs hebben wij en anderen samengestelde transgene zebravissen ingezet, waarbij tumor- en immuuncellen differentieel zijn gelabeld met fluorescente markers, om immuuncellen geassocieerd met tumoren te visualiseren20,21. Deze samengestelde transgene vissen maken het mogelijk om de TME gedurende de ontwikkeling van het dier en de tumor te bestuderen, wat onderzoek naar immuun-tumorinteracties in vivo faciliteert.
Hier presenteren we een methode die confocale microscopie gebruikt om immuuncellen binnen de TME van een zebravismodel voor neuroblastoom te bestuderen. Bij deze aanpak gebruikten we zebravis-reporterlijnen die immuuncellen labelen en een genetisch gemodificeerde zebravislijn die het menselijke MYCN-oncogen overexpresseert onder de dopamine-β-hydroxylase-promotor (dβh), wat resulteert in de ontwikkeling van een neuroblastoom dat lijkt op de menselijke ziekte20. In dit samengestelde transgene zebravismodel zijn tumorcellen en immuuncellen respectievelijk verschillend gelabeld met EGFP en mCherry. De dβh-promotor is actief in cellen van de sympathoadrenale lijn en is gebruikt in meerdere zebravismodellen van neuroblastoom22,23,24,25. Daarnaast gebruikten we een Cd4-promotor die mCherry-fluorescentie aanstuurt om CD4+ cellen te visualiseren15. Confocale beeldvorming met Z-stack acquisitie werd toegepast om de TME in drie dimensies te visualiseren tijdens verschillende stadia van tumorontwikkeling, waardoor de ruimtelijke relaties tussen tumor- en immuuncellen binnen intact weefsel konden worden beoordeeld. Deze methode maakt analyse mogelijk van de organisatie van immuuncellen ten opzichte van tumorcellen tijdens verschillende stadia van de tumorontwikkeling.
Protocol
All animal procedures were approved by the Institutional Animal Care and Use Committee (IACUC) at Boston University Chobanian & Avedisian School of Medicine under protocol PROTO202100001. The overall workflow for generation of compound transgenic zebrafish, larval imaging, adult tissue preparation, and image analysis is summarized in Figure 1.
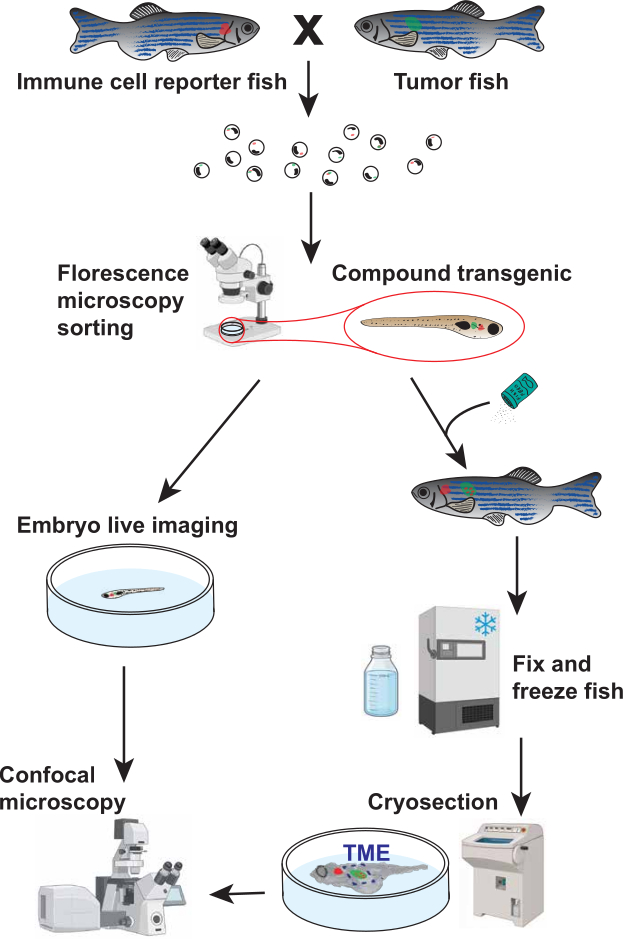
Figure 1. Workflow for visualization and quantification of immune cells within the zebrafish tumor microenvironment (TME). Schematic overview of the experimental workflow. Immune-reporter zebrafish were crossed with tumor-prone zebrafish to generate compound transgenic offspring expressing fluorescent markers in both immune cells (red) and tumor cells (green). Embryos were screened by fluorescence microscopy to identify compound transgenic fish. Selected fish were either subjected to live confocal imaging during larval development (<21 days post-fertilization [dpf]) or processed by fixation, cryosectioning, and confocal imaging for fish older than 21 dpf. This workflow enables visualization and quantification of immune cells associated with the TME across multiple developmental stages. Part of the illustration was created using BioRender. Please click here to view a larger version of this figure.
1. Generation of Compound Transgenic Zebrafish Lines Through Breeding
- Select adult immune-reporter fish and tumor fish that are at least 3 months old for natural breeding.
NOTE: For the representative results, Tg(cd4-1:mCherry) heterozygous fish were crossed with Tg(dβh:MYCN; dβh:EGFP) heterozygous fish to differentially label immune cells and tumor cells15,23. - On the evening before breeding, fill a two-chamber mating tank two-thirds full with fish water.
- Place a grated top insert into the mating chamber. Use dividers to separate one male from one or two females.
- Leave the dividers in place overnight. Add artificial plants or other enrichment items to simulate natural breeding conditions.
NOTE: A 1:2 male-to-female ratio increases the likelihood of successful spawning when breeding tumor male fish with immune-reporter fish. Do not breed two males with one female, as competition between males may occur. - On the following morning, remove the dividers after the facility lights turn on.
- Tilt the grated top chamber slightly using the divider as a wedge to create a shallow water area. Allow the fish to spawn for at least 1 h.
- Collect eggs from the bottom of the mating chamber by pouring the water through a fine-mesh net.
- Transfer the eggs to a sterile Petri dish containing fish water at a density no greater than 1 egg per 50 mm2 (approximately 200 eggs per 100 mm dish).
- Remove dead and unfertilized eggs.
NOTE: Healthy fertilized eggs are translucent and round. Remove cloudy, white, unfertilized, or deformed eggs. - Double-check the fish to avoid mixing sexes or cross-contaminating transgenic tanks.
- Return the males and females to their respective tanks.
- Place the embryos in a 28.5°C incubator overnight. Do not exceed the embryo density specified in Step 1.8.
- Bleach the embryos on the following morning to remove contaminants.
- Prepare a working bleach solution consisting of 100 µL bleach in 200 mL system water. Prepare a neutralization solution consisting of 0.5 g sodium thiosulfate in 150–200 mL system water.
- Sort and transfer viable embryos into a mesh-net well insert. Submerge the insert in the bleach solution for 5 min.
- Transfer the insert directly into the sodium thiosulfate solution. Incubate for 2 min to neutralize residual bleach.
- Rinse the embryos in a final bath of fresh system water. Use a squirt bottle to gently transfer the embryos into clean petri dishes containing fresh system water.
- Return the embryos to the incubator after bleaching.
- Transfer larvae at 5–7 days post-fertilization (dpf) or later to a larger tank containing 5 ppt rotifer water for rearing.
- Prepare 5 ppt rotifer water by mixing 1 part stock rotifer water (15 ppt) with 2 parts zebrafish system water.
- Verify that the final salinity is 5 ppt using a conductivity meter before transferring the larvae.
NOTE: Sorting EGFP+ MYCN larvae at 3–5 dpf facilitates identification of tumor-prone fish before rearing. Sorting MYCN embryos at this stage avoids false-negative identification because EGFP expression in neural crest cells may decrease later in development due to MYCN-induced apoptosis.
2. Screening Zebrafish for Fluorescent Markers
- Prepare a 0.4% (w/v) tricaine stock solution using system water.
- Transfer the fish to a clean petri dish containing only enough system water to cover the bottom.
- Add the tricaine stock solution to achieve a final concentration of approximately 0.005% (50 mg/L) for fish younger than 14 dpf or 0.012% (120 mg/L) for fish older than 14 dpf. Confirm adequate anesthesia by observing little to no voluntary movement.
- Remove excess water from the dish once the fish are anesthetized and no longer capable of swimming while maintaining visible opercular or cardiac movement.
- Screen the fish for fluorescence. Identify green or red fluorescence in the expected region (e.g., the interrenal gland region in MYCN fish).
- Separate the fish into groups using a stiff-bristled sorting tool.
NOTE: Sort tumor-prone fish as early as possible because MYCN-induced apoptosis during later developmental stages may result in false-negative identification. Sort immune-reporter fish immediately before imaging at the larval stage or between 2 and 4 months of age for adult studies. This approach minimizes handling-associated stress and maximizes survival. - Transfer positive and negative fish to separate tanks containing system water for continued rearing.
NOTE: Step 3 describes handling and imaging of larvae younger than 21 dpf. Steps 4–6 describe fixation, tissue preparation, imaging, and image analysis of older fish.
3. Larval Live-Mounting and Imaging
- Place sorted larvae in a 100 mm petri dish containing tricaine fish water (see Step 2.3 for age-appropriate concentrations).
- Transfer the sedated larvae to a glass-bottom imaging dish.
- Use only enough solution to cover the larva and maintain sedation.
- Prepare 1%–1.5% low-melting agarose in fish water. Heat the agarose solution until fully dissolved.
- Allow the agarose to cool for 1–2 min. Maintain the agarose at 30°C using a heat block to prevent solidification prior to mounting.
- Position each larva laterally in the imaging dish.
- Apply approximately 30–200 µL of agarose over the larva to immobilize it. Use larger volumes for larger larvae and smaller volumes for smaller larvae.
- Once the agarose has solidified, add approximately 100 µL of 0.005% tricaine solution over the agarose.
- Image the larvae using a confocal microscope.
- Use a standard laser-scanning confocal microscope with a resonant scanner. Use a 40× objective with a numerical aperture greater than 1.10.
- Set the pinhole to 1.0 Airy unit (AU) for all imaging channels.
- Use a 488 nm laser for EGFP excitation and a 594 nm laser for mCherry excitation. Keep laser output below 25 mW to minimize photobleaching and phototoxicity. Adjust detector gain and laser power using a range indicator lookup table (LUT) to avoid pixel saturation and black clipping. Do not exceed a detector gain of 800 V because higher voltages introduce excessive noise.
- Use a voxel size of 0.42 × 0.42 × 6.0 µm (x, y, z) at a resolution of 1024 × 1024 pixels and a Z-step interval of 6.0 µm. Acquire optical sections continuously through the full volume of interest, typically spanning 90–120 µm in total imaging depth. Use highly sensitive photodetectors operating in 16-bit acquisition mode.
- Acquire images using unidirectional line scanning at a resonant scan frequency of 33.3 kHz (approximately 1.58 µs pixel dwell time). Use 2× or 4× averaging to reduce motion artifacts while limiting laser exposure.
NOTE: Optimize tricaine exposure to maintain larval survival during imaging. After imaging, add fish water until the imaging dish is approximately half full.
- Add fresh fish water to the imaging dish immediately after imaging.
- Gently remove the larva from the agarose using a stiff-bristled stick and transfer the larva to a dish containing clean fish water for recovery.
- Return the fish to its original tank once normal swimming behavior resumes.
NOTE: For fish older than 21 dpf, the skin overlying the tumor must be removed by cryosectioning to enable high-resolution confocal imaging.
4. Fish Fixation and Cryosectioning
- Euthanize fish in accordance with approved institutional animal care guidelines.
- Make a ventral incision extending from the anal pore to the pectoral girdle to expose the abdominal cavity and facilitate fixative penetration into internal tissues.
- Transfer the fish using forceps into a 1.5 mL tube containing 4% paraformaldehyde (PFA) in phosphate-buffered saline (PBS) or a volume of fixative at least 10-fold greater than the tissue volume.
NOTE: Avoid handling the region containing the tumor to preserve tissue integrity. - Place the samples on a nutating rocker set to gentle continuous agitation (30 rpm) and incubate overnight for at least 12 h at 4°C.
CAUTION: PFA is hazardous, toxic, and potentially carcinogenic. Wear appropriate personal protective equipment, including gloves and eye protection. Perform all procedures involving PFA in a fume hood and avoid inhalation of vapors. - Remove the PFA and wash the samples at least four times with 1.5 mL of 1× PBS. Gently invert the tube two to three times during each wash.
- Transfer the fish to 30% sucrose prepared in PBS.
- Incubate the fish in a cold room overnight until the specimen sinks to the bottom of an upright tube (approximately 12 h), indicating adequate sucrose penetration.
- Remove excess sucrose solution by gently blotting the fish on a laboratory tissue.
- Transfer the fish to storage tubes.
- Store the samples at −80°C until imaging.
NOTE: Process samples within 3 months to minimize fluorescent protein degradation and signal loss. - Transport the fixed fish to the cryostat room on dry ice.
- Place the fish flat in a plastic mold with one sagittal side facing downward.
- Add Optimal Cutting Temperature (OCT) compound until the fish is fully covered.
- Freeze the mold at −20°C or in the cryostat until the OCT turns white.
NOTE: Position the fish as flat as possible before freezing to facilitate consistent sectioning. - Cryosection the zebrafish in the sagittal plane to remove the skin for subsequent whole-mount imaging.
- Cool the cryostat chuck.
- Apply room-temperature OCT to the chuck.
- Press the OCT fish block firmly into the OCT layer.
- Freeze the chuck and block until the newly applied OCT turns white.
- Mount the chuck in the cryostat.
- Cryosection the block at a thickness of 14 µm until the blade reaches the specimen.
NOTE: Specimen shifting may occur during freezing, causing the fish to sit higher in the block than expected. Entry into the specimen is indicated by the appearance of translucent tissue replacing the opaque OCT background. - Reduce the section thickness to 7 µm.
- Continue sectioning for one additional cut.
NOTE: This procedure removes the skin while preserving a uniform sagittal profile across the specimen. - Confirm the endpoint by identifying skin in the collected sections.
NOTE: Skin appearance in sections provides a more reliable indicator than eye morphology. Perform this procedure only when the skin obscures imaging of the tumor microenvironment.
- Warm the chuck gently with your hands.
- Remove the OCT block from the chuck using forceps. Avoid disturbing the cut surface of the specimen.
- Trim excess OCT surrounding the fish while the OCT remains frozen.
- Remove the fish from the OCT block using forceps once the OCT softens to a viscous consistency.
5. Mounting and Imaging of Fish with Skin Removed
- Place the fish in a glass-bottom dish with the sectioned sagittal side facing the glass surface.
NOTE: Maintain the orientation of the fish during handling. Identifying the sectioned side may become difficult after the fish is removed from the OCT block. - Prepare 1%–1.5% low-melting agarose.
- Apply approximately 30–50 µL of agarose to the dorsal and ventral sides of the fish to secure the sample.
NOTE: Avoid placing agarose beneath the fish because it can reduce image quality. Use only the minimum amount of agarose required for stabilization. - Keep the sample on ice during transport. Image the sample within 2 h of mounting.
- Transport the sample to the confocal microscopy facility.
- Image the sample using confocal microscopy.
- Use a standard laser-scanning confocal microscope with a resonant scanner. A two-photon microscope may be used when autofluorescence limits image quality. Use a corrected 20× objective lens with a numerical aperture of at least 0.80.
- Set the pinhole to 1.0 Airy unit (AU) for all imaging channels.
- Use a 488 nm laser for EGFP excitation and a 594 nm laser for mCherry excitation. Keep laser output below 25 mW. Adjust detector gain and laser power using a range indicator lookup table (LUT) to avoid pixel saturation and black clipping. Do not exceed a detector gain of 800 V because higher voltages introduce excessive noise.
- Configure image acquisition parameters as follows.
- Use a voxel size of 0.42 × 0.42 × 6.0 µm (x, y, z) at a resolution of 1024 × 1024 pixels and a Z-step interval of 6.0 µm.
- Acquire spectral image stacks through the full volume of interest, typically spanning a total Z-stack acquisition range of 90–120 µm (15–20 optical sections).
- Initiate image acquisition in the fluid space immediately above the tissue surface and continue through the full target imaging depth to ensure complete coverage of the specimen.
- Acquire images using highly sensitive photodetectors operating in 16-bit acquisition mode.
- Acquire images using unidirectional line scanning at a resonant scan frequency of 33.3 kHz (approximately 1.58 µs pixel dwell time) with 8× line averaging.
6. Image Analysis and Quantification
- Image visualization using Fiji (version 1.54p).
- Open the confocal z-stack images.
- Merge colors to see channel overlay by selecting Image > Color > Merge Channels.
- Generate a projection of the full z-range containing the imaging region by selecting Image > Stacks > Z Project. Enter the slice range of interest, as well as Max Intensity projection type. This will display the 2D projection of the image.
NOTE: For larval fish, it is feasible to capture the whole TME by confocal microscopy. Therefore, we recommend the volumetric normalization and quantification method for the TME analysis. For older fish, it is impossible to capture the whole TME by confocal microscopy; therefore, we recommend applying the area-based normalization and quantification method. Based on our analysis and quantification of the larval fish, both methods can provide reliable biological results.
- Volumetric normalization and quantification of the TME in the larval fish.
- Quantifying tumor volume using MATLAB R2022b (download the package from the Matlab website) and Bio-Formats package (download from the openmicroscopy website).
- The user runs a script that performs the following tasks:
- Prompt the user to select a .CZI file from their computer.
- Read the image and extract the data from the channel containing the tumor region.
- Identify the region for each slice that is the tumor region through a threshold of fluorescence (can be through user input or machine learning), keeping the same threshold for all analyzed images for consistency.
- Outline the tumor region and display the image with the tumor region outlined in a collage of all slices for user verification.
- Calculate the area of the tumor region per slice in pixels and convert to mm2 using the scale of the image and imaging settings.
- Multiply the area of the tumor region by the depth (stored in the file’s metadata) to get the volume of each slice.
- Sum the calculated values of each slice to obtain the total volume of the imaged tumor and its surrounding region in voxels or mm3.
- Scale both volume measurements by multiplying by 104 for tumor volume and 106 for the surrounding region. This will create a more reasonable cell number:volume ratio during normalization.
- Quantifying cell number.
- Open the confocal z-stack images.
- Merge colors to see channel overlay by selecting Image > Color > Merge Channels.
- Generate a 3D view of the full z-range containing the imaging region by selecting Image > Stacks > 3D Project. Select Brightest Point as the projection method and other settings to the desired values.
- Due to the small number of cells, manually count and tabulate the cells, separating cells located within the tumor boundary from those located outside the tumor boundary.
NOTE: Cells on the boundary of the tumor region are counted as being outside.
- Normalization.
- For infiltrating cells inside the tumor region, divide the number of cells by the scaled tumor volume. For the cells outside the tumor region, divide the number of cells outside the tumor volume by the scaled volume of the full image minus the tumor volume.
- Generate a table that includes the following headings: “fish identification”, “tumor volume”, “# of cells inside tumor region”, “# of cells outside tumor region”, “normalized cells inside”, “normalized cells outside”.
- Area-based normalization and quantification of the TME.
- Define the tumor region of interest (ROI) using the Rectangle or Freehand selection tool to outline the tumor.
- Add the ROI to the ROI Manager by pressing T or by selecting Analyze > Tools > ROI Manager > Add.
- Measure the ROI area using Analyze > Measure.
- Confirm that Area is selected under Set Measurements before recording measurements.
- Save the ROI in the ROI Manager.
- Apply the same ROI to all images using ROI Manager > More > Multi-Measure.
- Do not resize the ROI between images.
- Manually count cells within the ROI. If cells are more, count cells using the Cell Counter plugin by selecting Plugins > Analyze > Cell Counter.
- Mark each counted cell by left-clicking when its centroid falls within the ROI.
- Scroll through the z-stack to verify cell identity.
- Avoid counting the same cell more than once across multiple image planes.
- Count infiltrating cells separately if they contact or lie within the tumor boundary.
- Record infiltrating cells as a distinct category even when the cell centroid falls outside the ROI.
- Convert the ROI area from pixels to mm2.
- Obtain the pixel width, pixel height, and Z-step interval from Image > Properties.
- Calculation of normalized cell counts.
- Divide the raw cell count for each fish by the corresponding ROI area value.
- Record the resulting value as the normalized cell count.
- For absolute density measurements, calculate the physical area using the image calibration values obtained from Image > Properties.
- Divide the raw cell count by the calculated area (mm2).
- Record the result as cell density expressed as cells/mm2.
Resultaten
De algemene experimentele workflow wordt weergegeven in Figuur 1. Volwassen Tg(cd4-1:mCherry) zebravissen werden gekruist met Tg(dβh:MYCN;dβh:EGFP) zebravissen om samengestelde transgene nakomelingen te genereren waarin CD4+ cellen en dβh-expresserende cellen respectievelijk differentieel werden gelabeld met mCherry- en EGFP-fluorescentie. Embryo's werden gescreend op de juiste fluorescentiemarkers en vervolgens geanalyseerd middels live confocale imaging tijdens de larvale ontwikkeling of confocale imaging na fixatie en cryosectie bij oudere vissen (Figuur 1).
Om de associatie van CD4+ cellen met premaligne neuroblastoomlaesies tijdens de larvale ontwikkeling te beoordelen, werden samengestelde transgene vissen afgebeeld op 7 en 14 dagen na bevruchting (dpf). De tijdstippen waren geselecteerd op basis van stadia van lymfocytenontwikkeling bij zebravis26,27. Representatieve confocale beelden zijn getoond in Figuur 2A. Op 7 dpf werden CD4+ cellen zelden waargenomen binnen of rondom de dβh-expresserende regio in zowel controlevissen als MYCN-expresserende vissen (Figuur 2A; Aanvullende video's 1 en 2). Op 14 dpf vertoonden MYCN-expresserende vissen een verhoogd aantal CD4+ cellen geassocieerd met de uit de neurale lijst afgeleide premaligne tumor vergeleken met de uit de neurale lijst afgeleide sympathoadrenale progenitorregio in controlevissen (Figuur 2A; Aanvullende video's 3 en 4).
Om rekening te houden met verschillen in tumorgrootte en het vermogen van confocale microscopie om de gehele tumor in de larvale vis vast te leggen, hebben we zowel volumetrische als oppervlaktegebaseerde normalisatiemethoden vergeleken. Belangrijk is dat volumetrische en oppervlaktegebaseerde normalisatiemethoden vergelijkbare resultaten gaven in larvale vissen, wat het gebruik van oppervlaktegebaseerde normalisatie ondersteunt voor volwassen tumoren wanneer het volledige tumorvolume niet door confocale microscopie kan worden vastgelegd. Kwantificering toonde geen significant verschil aan in het aantal omliggende CD4+ cellen tussen de groepen op beide tijdstippen (Figuur 2B, onder; n = 4 en 6 op 7 dpf en n = 4 en 5 op 14 dpf voor respectievelijk de controle- en MYCN-groepen). In tegenstelling hiermee vertoonden MYCN-exprimerende vissen een significant grotere infiltratie van CD4+ cellen binnen het geanalyseerde gebied op 14 dpf vergeleken met controlevissen (Figuur 2B, boven; P < 0,05; n = 4 en 5 voor respectievelijk de controle- en MYCN-groepen). Gegevens worden gepresenteerd als genormaliseerde celgetallen relatief aan het tumorvolume (cellen/mm3) en uitgedrukt als gemiddelde ± SEM.
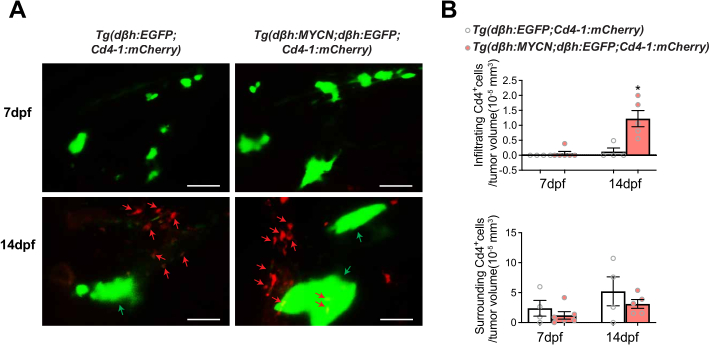
Figuur 2. Toegenomen associatie van CD4+ cellen met MYCN-exprimerende neuroblastoomlaesies op 14 dagen na bevruchting. (A) Representatieve confocale beelden van Tg(dβh:EGFP;Cd4-1:mCherry) controlevissen en Tg(dβh:MYCN;dβh:EGFP;Cd4-1:mCherry) vissen op 7 en 14 dagen na bevruchting (dpf). EGFP-positieve cellen (groen) markeren dβh-exprimerende cellen afgeleid van de neurale kam/neuroblastoomcellen, en CD4+ cellen zijn gelabeld met mCherry (rood). Pijlen geven representatieve CD4+ cellen aan die geassocieerd zijn met de neurale kam/tumorregio. Schaalbalken = 50 µm. (B) Kwantificering van CD4+ cellen die de neurale kam/tumorregio omringen (onder) en infiltreren (boven) in controle- en MYCN-exprimerende vissen op 7 en 14 dpf. Celgetallen werden genormaliseerd naar het tumorvolume (cellen/mm3). Gegevens zijn weergegeven als gemiddelde ± SEM. Statistische vergelijkingen werden uitgevoerd met ongepaarde tweezijdige t-toetsen. P < 0,05. n = 4 en 6 op 7 dpf en n = 4 en 5 op 14 dpf voor de controle- en MYCN-groepen, respectievelijk. Representatieve gegevens van drie onafhankelijke experimenten. Klik hier om een grotere versie van deze figuur te bekijken.
Om de associatie van CD4+ cellen met gevestigde tumoren te onderzoeken, werden gesorteerde compound transgene vissen tot volwassenheid gekweekt en geanalyseerd na fixatie, cryosectie en confocale beeldvorming (Figuur 1). Representatieve beelden van gelokaliseerd en metastatisch neuroblastoom van 4 maanden oude vissen zijn weergegeven in Figuur 3A. Tumoren werden als metastatisch geclassificeerd wanneer EGFP-positieve tumorcellen buiten de perifere sympathische ganglia werden gedetecteerd. We hebben een oppervlaktegebaseerde kwantificatiemethode toegepast omdat confocale microscopie het volledige tumorvolume niet kan vastleggen. Onze analyse toonde een significant verhoogd aantal CD4+ cellen aan die metastatische tumoren omringen of infiltreren in vergelijking met gelokaliseerde tumoren (Figuur 3B; P < 0.05; n = 4 per groep). De gegevens worden gepresenteerd als genormaliseerde celgetallen per tumoroppervlak (cellen/mm2) en uitgedrukt als gemiddelde ± SEM.
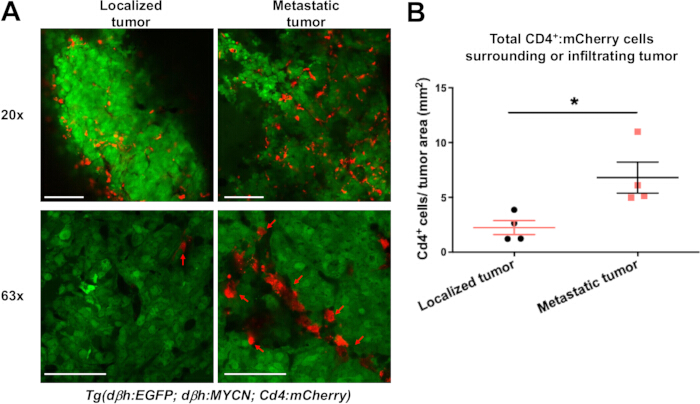
Figuur 3. Metastatisch neuroblastoom vertoont een verhoogde CD4+ celinfiltratie binnen de tumormicro-omgeving. (A) Representatieve confocale beelden van gelokaliseerd en metastatisch neuroblastoom bij 4 maanden oude sibling Tg(dβh:MYCN;dβh:EGFP;Cd4-1:mCherry) zebravissen. Tumorcellen zijn gelabeld met EGFP (groen) en CD4+ cellen zijn gelabeld met mCherry (rood). Pijlen geven representatieve CD4+ cellen aan die geassocieerd zijn met tumorweefsel. De beelden verkregen met 20× en 63× objectieven worden getoond als onafhankelijke gezichtsvelden. Schaalbalken = 100 µm (20×) en 50 µm (63×). (B) Kwantificering van het totale aantal CD4+ cellen rondom of infiltrerend in gelokaliseerde en metastatische tumoren. Celgetallen werden genormaliseerd naar de tumorgrootte zoals beschreven in het protocol. Gegevens worden weergegeven als gemiddelde ± SEM. Statistische vergelijkingen werden uitgevoerd met ongepaarde tweezijdige t-toetsen. P < 0,05. n = 4 per groep. Representatieve gegevens van drie onafhankelijke experimenten. Klik hier om een grotere versie van deze figuur te bekijken.
Deze bevindingen tonen aan dat het protocol kan worden gebruikt om CD4+ cellen geassocieerd met neuroblastoomlaesies te visualiseren en te kwantificeren in meerdere stadia van tumorgroei bij zebravissen.
Aanvullende video 1. Representatieve confocale z-stack van een controle-zebravis op 7 dagen na bevruchting. Driedimensionale confocale beeldvorming van een Tg(dβh:EGFP;Cd4-1:mCherry) controle-zebravis op 7 dagen na bevruchting (dpf). EGFP-positieve cellen afgeleid van de neurale lijst zijn in het groen weergegeven, en CD4+ cellen zijn in het rood weergegeven. In dit ontwikkelingsstadium worden weinig CD4+ cellen waargenomen binnen of rondom het dβh-exprimerende gebied. Klik hier om dit bestand te downloaden.
Aanvullende video 2. Representatieve confocale z-stack van een MYCN-expresserende zebravis op 7 dagen na bevruchting. Driedimensionale confocale beeldvorming van een Tg(dβh:MYCN;dβh:EGFP;Cd4-1:mCherry) zebravis op 7 dagen na bevruchting (dpf). EGFP-positieve, MYCN-expresserende premaligne neuroblastoomcellen worden in het groen weergegeven, en CD4+ cellen in het rood. Vergelijkbaar met controlevissen worden in dit vroege ontwikkelingsstadium weinig CD4+ cellen waargenomen binnen of rondom het tumorgebied. Klik hier om dit bestand te downloaden.
Aanvullende video 3. Representatieve confocale z-stapel van een controle-zebravissen bij 14 dagen na bevruchting. Driedimensionale confocale beeldvorming van een Tg(dβh:EGFP;Cd4-1:mCherry) controle-zebravissen bij 14 dagen na bevruchting (dpf). EGFP-positieve cellen afgeleid van de neurale lijst worden in het groen getoond, en CD4+ cellen worden in het rood getoond. CD4+ cellen zijn schaars verdeeld en vertonen een beperkte associatie met de dβh-expresserende regio. Klik hier om dit bestand te downloaden.
Aanvullende Video 4. Representatieve confocale z-stack van een MYCN-expresserende zebravis 14 dagen na bevruchting. Driedimensionale confocale beeldvorming van een Tg(dβh:MYCN;dβh:EGFP;Cd4-1:mCherry) zebravis 14 dagen na bevruchting (dpf). EGFP-positieve MYCN-expresserende premaligne neuroblastoomcellen worden in het groen weergegeven, en CD4+ cellen in het rood. Een verhoogde accumulatie en infiltratie van CD4+ cellen worden waargenomen in associatie met het vergrote tumorgebied in vergelijking met leeftijd-gematchte controlevissen, wat consistent is met de kwantificering getoond in Figuur 2B. Klik hier om dit bestand te downloaden.
Discussie
Het hier beschreven protocol maakt gebruik van zebravis als in vivo model om immuuncellen binnen de TME te visualiseren en te kwantificeren. Verschillende factoren zijn cruciaal voor een succesvolle implementatie van deze benadering. Ten eerste zijn de juiste selectie en validatie van samengestelde transgene zebravislijnen essentieel. Larven moeten worden gescreend op de verwachte fluorescente expressiepatronen en, indien nodig, worden bevestigd via genotypering. De expressie van immuun-reporters en oncogenen moet voorafgaand aan de experimenten worden geverifieerd om een nauwkeurige toewijzing van experimentele groepen en controlegroepen te waarborgen. Ten tweede is een nauwkeurige identificatie van het interessegebied cruciaal tijdens confocale beeldvorming. Bright-field imaging kan worden gebruikt om anatomische referentiepunten te identificeren en de lokalisatie van het doelweefsel te vergemakkelijken. Bijvoorbeeld, bij het afbeelden van tumoren in het voorste lichaamsgebied kan het oog als referentiepunt dienen om de lokalisatie te ondersteunen. Ten derde is een juiste positionering van de vis essentieel om een adequate blootstelling van het beeldvormingsgebied te garanderen. Een onjuiste uitlijning kan de beeldkwaliteit verminderen of het weefsel van interesse onzichtbaar maken. Ten slotte zijn passende montage en immobilisatie vereist om bewegingsartefacten tijdens live imaging te minimaliseren. De tricaine-concentratie en de duur van de beeldvorming moeten worden geoptimaliseerd om de levensvatbaarheid van de larven te behouden terwijl de beeldkwaliteit gewaarborgd blijft.
Fototoxiciteit kan worden geminimaliseerd door de laserintensiteit en de blootstellingstijd tijdens live imaging te verminderen. Voor volwassen monsters moeten weefsels tijdens de behandeling en de voorbereiding voor imaging op ijs worden bewaard, omdat herhaaldelijk ontdooien de weefselintegriteit kan beïnvloeden. Een zorgvuldige behandeling van de monsters is bijzonder belangrijk na cryosectie en verwijdering uit het OCT-blok.
De interpretatie van beeldvormingsresultaten vereist overweging van de specificiteit van de reporter. Verschillende immuun-reporterlijnen labelen meerdere immuuncelpopulaties. Zo is CD4-expressie gerapporteerd in celpopulaties buiten de conventionele T-cellen, waaronder macrofagen28. Daarnaast wordt mpeg-expressie, naast in macrofagen, ook gedetecteerd in B-cellen29. Lysc kan zowel neutrofielen als macrofagen labelen30. Bijgevolg is fluorescentie-reporterexpressie alleen mogelijk niet voldoende om de celidentiteit definitief vast te stellen. Aanvullende validatiebenaderingen, zoals RNAscope, flowcytometrie, kwantitatieve reverse-transcriptie polymerasekettingreactie of single-cell RNA-sequencing, kunnen de waarnemingen op basis van beeldvorming aanvullen en zorgen voor een verdere moleculaire karakterisering van de gelabelde celpopulaties.
Deze methode kent verschillende beperkingen. De aanpak is afhankelijk van de expressie van fluorescente reporters en kan daarom de identiteit of functionele status van immuuncellen niet onafhankelijk bevestigen. Daarnaast is de beeldanalyse in de huidige workflow voor volwassen vissen gebaseerd op geprojecteerde confocale datasets van een beperkt aantal lagen, waardoor complexe driedimensionale cellulaire relaties binnen de TME mogelijk niet volledig worden vastgelegd. Tot slot vereist de methode ook het genereren en onderhouden van samengestelde transgene zebravislijnen, wat de toegankelijkheid voor sommige laboratoria kan beperken.
Ondanks deze beperkingen biedt het protocol een praktische aanpak voor het visualiseren van immuuncellen die geassocieerd zijn met neuroblastoomlaesies in zebravissen. In vergelijking met conventionele eindpunt-histologie behoudt deze methode de weefselarchitectuur en maakt zij beeldvorming mogelijk van fluorescentielabelled cellen binnen intacte weefsels20,21. De workflow kan worden toegepast op meerdere ontwikkelingsstadia en kan worden aangepast voor aanvullende fluorescente reporterlijnen. Naast neuroblastoom hebben meerdere studies de TME in beeld gebracht voor de interactie tussen melanoom en immuuncellen, waaronder CD4+ cellen, macrofagen en CD8+ cellen15,21,31,32. Samen maken deze kenmerken het protocol tot een nuttig platform voor het bestuderen van de lokalisatie van immuuncellen binnen de TME van de zebravis.
Openbaarmakingen
De auteurs verklaren geen concurrerende belangen te hebben.
Dankbetuigingen
Wij erkennen de ondersteuning van de National Institutes of Health (NIH; 1UL1TR001430, CA215059 en NS140967), de American Cancer Society (RSG-17-204-01-TBG), de National Science Foundation (1911253) en Alex’s Lemonade Stand Foundation aan H.F.; en van een Warren Alpert Distinguished Scholars Fellowship aan X.Q. Y.W. werd ondersteund door het Boston University Undergraduate Research Opportunities Program (UROP) en het St. Baldrick’s Summer Fellowship Program. M.V. werd ondersteund door het St. Baldrick’s Summer Fellowship Program. De inhoud van dit artikel is uitsluitend de verantwoordelijkheid van de auteurs en vertegenwoordigt niet noodzakelijkerwijs de officiële standpunten van de NIH.
Materialen
| Naam | Bedrijf | Catalogusnummer | Opmerkingen |
|---|---|---|---|
| 200 µL Gel Loading Tip | MilliporeSigma | 1022-0600 | Gebruikt voor manipulatie van larven |
| Kunstplanten | The Hidden Reef | 62874200000000000 | Optionele verrijking voor kweek |
| Bleekmiddel | Fisher Scientific | 50371500 | Gebruikt voor decomcontaminatie van embryo's |
| Cell Counter Plugin | National Institutes of Health (NIH) | N/A | Fiji-plugin gebruikt voor celkwantificering |
| Computer en Monitor | HP | 2TB68A8#ABA | Gebruikt voor beeldacquisitie en analyse |
| Confocale microscoop | Zeiss | LSM 710 | Gebruikt voor beeldvorming van larven en volwassenen |
| Cryomould, plastic | Epredia | 22-050-160 | Gebruikt voor OCT-inbedding |
| Cryostaat | Thermo Fisher Scientific | 95-664-0EC70 | Gebruikt voor cryosectie |
| Droogijs | Fisher Scientific | N/A | Gebruikt voor transport van monsters |
| Fiji Software | National Institutes of Health (NIH) | Version 1.54p | Software voor beeldanalyse |
| Fijnmazig net | Carolina Biological | 651345 | Gebruikt voor het verzamelen van embryo's |
| Visincubator | VWR | 35960-056 | Gehouden op 28,5°C |
| Pincet | Fisher Scientific | 10-316B | Gebruikt voor monsterbehandeling |
| Glass-bottom dish | IBIDI | 81218-200 | Gebruikt voor beeldvorming |
| Low-melting agarose | Prolab Supply | 9012-36-6 | Gebruikt voor het monteren van larven en volwassenen |
| Paartank (hoofdtank, scheidingswand, roostergedeelte) | Carolina Biological | 161937 | Gebruikt voor de kweek van zebravissen |
| Nutating Rocker | Midsci | R2D-30 | Gebruikt voor fixatie tijdens incubatie overnacht |
| OCT-compound | Tissue-Tek | 4583 | Inbeddingsmedium voor cryosectie |
| Paraformaldehyde (PFA) | Sigma Aldrich | 158127-500G | Fixatief |
| Petrischaal, plastic | MilliporeSigma | BR452000 | Gebruikt voor het hanteren van embryo's en larven |
| Fosfaatgebufferde zoutoplossing (PBS) | Gibco | 14080-055 | Gebruikt voor was- en fixatieprocedures |
| Plastic transferpipet | Fisher Scientific | 50-998-100 | Gebruikt voor overdracht van embryo's en larven |
| Scheermesje | Fisher Scientific | 12-640 | Gebruikt tijdens monsterpreparatie |
| Geleidbaarheidsmeter | YSI | EC300ACC-04 | Gebruikt om de saliniteit van rotifer-water te verifiëren |
| Rotiferen | The Hidden Reef | 116151603 | Gebruikt voor de opkweek van larven |
| Natriumthiosulfaat | Thermo Fisher Scientific | AAA1762936 | Gebruikt voor neutralisatie van bleekmiddel |
| Sucrose | Fisher Scientific | S25590A | Cryoprotectiemiddel |
| Tricaine methansulfonaat | Western Chemical | NC0872873 | Anesthesicum; verkocht door Fisher Scientific |
| Pincet | Fisher Scientific | 12-000-122 | Gebruikt voor monsterbehandeling |
| Rechte fluorescentiemicroscoop | Leica | M165 | Gebruikt voor fluorescentiescreening |
Referenties
- Anderson NM, Simon MC. The tumor microenvironment. Curr Biol. 2020;30(16):R921-R925.
- Kumagai S, Momoi Y, Nishikawa H. Immunogenomic cancer evolution: A framework to understand cancer immunosuppression. Sci Immunol. 2025;10(105):eabo5570.
- Keren L, et al. A structured tumor-immune microenvironment in triple negative breast cancer revealed by multiplexed ion beam imaging. Cell. 2018;174(6):1373-1387.e19.
- Gerner MY, et al. Histo-cytometry: A method for highly multiplex quantitative tissue imaging analysis applied to dendritic cell subset microanatomy in lymph nodes. Immunity. 2012;37(2):364-376.
- Pittet MJ, Weissleder R. Intravital imaging. Cell. 2011;147(5):983-991.
- Wienke J, et al. The immune landscape of neuroblastoma: Challenges and opportunities for novel therapeutic strategies in pediatric oncology. Eur J Cancer. 2021;144:123-150.
- Spitzer MH, Nolan GP. Mass cytometry: Single cells, many features. Cell. 2016;165(4):780-791.
- Roy D, et al. Zebrafish—A suitable model for rapid translation of effective therapies for pediatric cancers. Cancers (Basel). 2024;16(7):1361.
- White RM, et al. Transparent adult zebrafish as a tool for in vivo transplantation analysis. Cell Stem Cell. 2008;2(2):183-189.
- MacRae CA, Peterson RT. Zebrafish as tools for drug discovery. Nat Rev Drug Discov. 2015;14(10):721-731.
- Miao KZ, et al. Tipping the scales with zebrafish to understand adaptive tumor immunity. Front Cell Dev Biol. 2021;9:660969.
- Povoa V, et al. Innate immune evasion revealed in a colorectal zebrafish xenograft model. Nat Commun. 2021;12(1):1156.
- Wang J, et al. Novel mechanism of macrophage-mediated metastasis revealed in a zebrafish model of tumor development. Cancer Res. 2015;75(2):306-315.
- Loveless R, Shay C, Teng Y. Unveiling tumor microenvironment interactions using zebrafish models. Front Mol Biosci. 2020;7:611847.
- Dee CT, et al. CD4-transgenic zebrafish reveal tissue-resident Th2- and regulatory T cell-like populations and diverse mononuclear phagocytes. J Immunol. 2016;197(9):3520-3530.
- Murali Shankar N, et al. Preclinical assessment of CAR-NK cell-mediated killing efficacy and pharmacokinetics in a rapid zebrafish xenograft model of metastatic breast cancer. Front Immunol. 2023;14:1254821.
- Tan KE, et al. LMO1 expression in neuroblastoma cells reprograms tumor-associated macrophages to promote metastasis. iScience. 2026;29(3):115144.
- Fior R, et al. Single-cell functional and chemosensitive profiling of combinatorial colorectal therapy in zebrafish xenografts. Proc Natl Acad Sci U S A. 2017;114(39):E8234-E8243.
- Fazio M, et al. Zebrafish patient avatars in cancer biology and precision cancer therapy. Nat Rev Cancer. 2020;20(5):263-273.
- Qin X, et al. CKLF instigates a “cold” microenvironment to promote MYCN-mediated tumor aggressiveness. Sci Adv. 2024;10(11):eadh9547.
- Ludin A, et al. CRATER tumor niches facilitate CD8+ T cell engagement and correspond with immunotherapy success. Cell. 2025;188(24):6720-6736.e26.
- Zhu S, et al. LMO1 synergizes with MYCN to promote neuroblastoma initiation and metastasis. Cancer Cell. 2017;32(3):310-323.e5.
- Tao T, et al. The pre-rRNA processing factor DEF is rate limiting for the pathogenesis of MYCN-driven neuroblastoma. Oncogene. 2017;36(27):3852-3867.
- Zimmerman MW, et al. MYC drives a subset of high-risk pediatric neuroblastomas and is activated through mechanisms including enhancer hijacking and focal enhancer amplification. Cancer Discov. 2018;8(3):320-335.
- Dankert EN, Look AT, Zhu S. Unraveling neuroblastoma pathogenesis with the zebrafish. Cell Cycle. 2018;17(4):395-396.
- Langenau DM, et al. In vivo tracking of T cell development, ablation, and engraftment in transgenic zebrafish. Proc Natl Acad Sci U S A. 2004;101(19):7369-7374.
- Lam SH, et al. Development and maturation of the immune system in zebrafish, Danio rerio: A gene expression profiling, in situ hybridization and immunological study. Dev Comp Immunol. 2004;28(1):9-28.
- Zhen A, et al. CD4 ligation on human blood monocytes triggers macrophage differentiation and enhances HIV infection. J Virol. 2014;88(17):9934-9946.
- Ferrero G, et al. The macrophage-expressed gene (mpeg)1 identifies a subpopulation of B cells in the adult zebrafish. J Leukoc Biol. 2020;107(3):431-443.
- Hall C, et al. The zebrafish lysozyme C promoter drives myeloid-specific expression in transgenic fish. BMC Dev Biol. 2007;7:42.
- Lorenzini F, et al. Melanoma innervation, noradrenaline and cancer progression in zebrafish xenograft model. Cell Death Discov. 2025;11(1):260.
- Ramakrishnan G, et al. Real-time imaging reveals a role for macrophage protrusive motility in melanoma invasion. J Cell Biol. 2025;224(2):e202403096.
Herprints en machtigingen
Dit artikel is gepubliceerd
Video binnenkort beschikbaar