Niniejszy protokół opisuje generowanie i charakterystykę fenotypową modelu mysiego C57BL/6N-Cracdem1(c.538-83 to c.3352+255 del) z wykorzystaniem technologii CRISPR/Cas9 w celu zbadania roli białka CRACD w przebudowie serca po zawale mięśnia sercowego.
Artykuł metodologiczny
Generowanie i charakterystyka fenotypowa modelu mysiego z deficytem Cracd wytworzonego za pomocą CRISPR/Cas9 do badań nad przebudową po zawale mięśnia sercowego
W tym artykule
Podsumowanie
Streszczenie
Myocardial infarction (MI) remains a major cause of morbidity and mortality worldwide. This protocol describes a method for generating and characterizing a Cracd-deficient mouse line on the C57BL/6N background using CRISPR/Cas9 technology. Zygotes were co-injected with Cas9 mRNA, a gRNA construct, and a donor template designed to generate a 3153-bp genomic deletion. The edited allele was confirmed by PCR genotyping and Sanger sequencing. To assess the functional role of CRACD in post-MI remodeling, Cracd-deficient and wild-type (WT, C57BL/6N) mice underwent MI induced by permanent ligation of the left anterior descending coronary artery. On postoperative day 7, cardiac function and left ventricular wall motion were assessed using transthoracic echocardiography and speckle-tracking strain imaging, followed by histopathological evaluation with H&E and Masson's trichrome staining. Representative results showed that Cracd-deficient mice exhibited reduced ventricular dilation and preserved systolic function compared to WT controls. This protocol provides a reliable experimental platform for mechanistic studies of CRACD in cardiac pathophysiology.
Wprowadzenie
Zawał mięśnia sercowego (MI) pozostaje wiodącą przyczyną zachorowalności i śmiertelności na całym świecie, stanowiąc znaczne obciążenie dla globalnego zdrowia układu sercowo-naczyniowego1. Długoterminowe rokowania po zawale MI są determinowane przede wszystkim przez proces przebudowy lewej komory (LV)2, który obejmuje rozszerzenie komory, ścieńczenie ścian oraz włóknienie śródmiąższowe3,4, co jest kluczowym czynnikiem sprzyjającym progresji do niewydolności serca (HF). Globalna zapadalność na HF wynikająca z przebudowy serca po zawale MI dodatkowo pogarsza obciążenie chorobami układu sercowo-naczyniowego5. Pomimo tych ugruntowanych obserwacji klinicznych, brakuje systematycznych badań wykorzystujących czułe i powtarzalne modele in vivo do oceny roli konkretnych genów w przebudowie po zawale MI. Obecnie żaden protokół nie łączy modelu nokautowego opracowanego za pomocą CRISPR/Cas9 z zaawansowanym obrazowaniem odkształceń (strain imaging) w celu oceny regulatora cytoszkieletu, takiego jak CRACD. W związku z tym istnieje pilna potrzeba opracowania metody umożliwiającej precyzyjną manipulację genetyczną oraz wysokorozdzielcze fenotypowanie serca.
Regulator dynamiki aktyny hamujący białko cappingowe (CRACD), znany również jako KIAA1211, jest regulatorem polimeryzacji aktyny zlokalizowanym głównie w cytozolu, który odgrywa kluczową rolę w dynamice cytoszkieletu6. Pozytywnie reguluje polimeryzację aktyny poprzez wiązanie się z białkami cappingowymi aktyny (CAPZA1, CAPZA2, CAPZB) i zapobieganie ich przyłączaniu do końców szybko rosnących (barbed ends) filamentów aktynowych7. W tkankach nabłonkowych CRACD odgrywa istotną rolę w utrzymaniu morfologii komórek i transdukcji sygnałów poprzez zachowanie integralności cytoszkieletu aktynowego8,9. W komórkach nowotworowych jego dysregulacja wiąże się ze zwiększoną przerzutnością i proliferacją komórek6,10. Rola CRACD w sercu nie jest w pełni poznana. Analizy transkryptomu serca oraz badania z interwencją eksperymentalną wskazują, że ekspresja genu Cracd reaguje na stres patologiczny i może regulować geny związane z dynamiką cytoszkieletu podczas przebudowy komórCventricular remodeling9,11. Co więcej, jego białko hamujące, CapZ, zostało ściśle powiązane z patologią serca: fosforylacja CapZ reguluje wzrost miofibryli podczas hipertrofii indukowanej fenylofryną12. Nasze wcześniejsze badania wskazują, że umiarkowane obniżenie poziomu CRACD zapewnia ochronę przed uszkodzeniem mięśnia sercowego i zachowuje kurczliwość miofilamentów po ostrej ischemii13. Wyniki te sugerują, że CRACD może odgrywać rolę w nieadaptacyjnej przebudowie komór podczas zawale mięśnia sercowego (MI). Brakuje jednak systematycznych badań in vivo nad utratą funkcji, które sprawdzałyby, czy niedobór Cracd moduluje przebudowę po MI, co wynika głównie z braku zwalidowanego, szczegółowego protokołu generowania i fenotypowania myszy z niedoborem Cracd w warunkach stresu niedokrwiennego.
Istnieje kilka podejść do generowania myszy z konstytutywnym nokautem. Tradycyjna rekombinacja homologiczna w embrionalnych komórkach macierzystych (ES) jest precyzyjna, lecz kosztowna, czasochłonna (12–18 miesięcy) i ograniczona do określonych szczepów myszy.14Mutageneza za pomocą ENU (N-etylo-N-nitrozomocznika) powoduje powstawanie losowych mutacji punktowych, co wymaga szeroko zakrojonego krzyżowania wstecznego i sekwencjonowania15W przeciwieństwie do tego, CRISPR/Cas9 oferuje wyraźne zalety praktyczne w niniejszym badaniu: (i) bezpośrednia iniekcja do zygot skraca czas realizacji do 4–6 miesięcy; (ii) umożliwia usunięcie dużego fragmentu genomowego (3153 bp), co zapewnia całkowitą utratę funkcji; (iii) działa bezpośrednio w tle genetycznym C57BL/6N bez konieczności konwersji szczepu; oraz (iv) pozwala uniknąć zastosowania markera selekcyjnego, minimalizując niezamierzone zakłócenia transkrypcyjne. W związku z tym CRISPR/Cas9 jest najwydajniejszym wyborem do wygenerowania Cracdlinia z deficytem [nazwa], odpowiednia do rutynowego fenotypowania układu sercowo-naczyniowego. Technologia ta była szeroko stosowana do przeprowadzania precyzyjnych in vivo badania nad utratą funkcji16,17.
Obrazowanie odkształceń metodą śledzenia plamek (speckle-tracking strain imaging) jest techniką postprocessingu, która klatka po klatce śledzi ruch naturalnych plamek akustycznych w obrębie mięśnia sercowego, umożliwiając obliczenie parametrów odkształcenia mięśnia sercowego, takich jak odkształcenie (strain – ułamkowa zmiana długości) oraz szybkość odkształcenia (strain rate – tempo deformacji)18. W przeciwieństwie do konwencjonalnej echokardiografii w trybie M lub dwuwymiarowej, która dostarcza globalnych wskaźników funkcjonalnych (frakcja wyrzutowa, frakcyjne skrócenie, wewnętrzna średnica lewej komory) i jest stosunkowo nieczuła na regionalne zaburzenia kurczliwości ścian, obrazowanie odkształceń pozwala na ilościowe określenie segmentowej funkcji skurczowej. Jest to szczególnie istotne we wczesnym okresie po zawałach, kiedy kompensacyjna hiperkineza segmentów niezawałowców może utrzymywać globalną frakcję wyrzutową mimo znacznej dysfunkcji regionalnej. Śledzenie plamek oferuje kilka zalet w porównaniu ze standardowymi punktami końcowymi: pozwala na wyznaczenie segmentowego odkształcenia i szybkości odkształcenia, przemieszczenia oraz prędkości, wykrywając tym samym subtelne zmiany subkliniczne19; może zidentyfikować dyssynchronię i wczesne deficyty skurczowe przed wystąpieniem nieodwracalnego przebudowywania (remodelingu); bezpośrednio bada ono warstwę podwsierdziową, która jest najbardziej podatna na niedokrwienie20. W niniejszym badaniu CRACD jest regulatorem cytoszkieletu, który może wpływać na kurczliwość miofibryli na poziomie mikroskopowym. Konwencjonalne pomiary oparte na objętości jam serca mogłyby łatwo przeoczyć takie lokalne efekty mechaniczne. Zatem zintegrowanie analizy śledzenia plamek z niniejszym protokołem zwiększa możliwość wykrycia wczesnych efektów ochronnych wynikających z niedoboru Cracd. W konsekwencji, włączenie śledzenia plamek do tego protokołu dostarcza czułego i ilościowego narzędzia do oceny remodelingu pozawałowego, zwłaszcza w pierwszym tygodniu po zawale mięśnia sercowego, kiedy pojawia się wczesna dylatacja i dysfunkcja skurczowa21,22.
Niniejszy protokół został opracowany dla badaczy analizujących funkcjonalny wpływ delecji konkretnego genu na ostre (7-dniowe) przebudowywanie serca po zawale mięśnia sercowego (MI), z wykorzystaniem kombinacji konstytutywnego nokautu i obrazowania o wysokiej rozdzielczości. Jest on odpowiedni dla badań służących do generowania hipotez, w których dopuszczalna jest globalna utrata docelowego genu, a głównym punktem końcowym jest wczesna funkcja skurczowa i zmiany strukturalne. Należy jednak wziąć pod uwagę kilka ograniczeń. Po pierwsze, mysz z niedoborem Cracd jest nokautem globalnym; w związku z tym zaobserwowane efekty kardioprotekcyjne nie mogą być przypisane wyłącznie utracie CRACD w kardiomiocytach, ponieważ rolę mogą odgrywać również czynniki systemowe. Do uzyskania delecji specyficznej dla serca niezbędne będą przyszłe badania z wykorzystaniem strategii nokautu warunkowego. Po drugie, protokół koncentruje się na pojedynczym punkcie czasowym (dzień 7.) i nie odnosi się do przewlekłego przebudowywania ani progresji niewydolności serca (HF). Wymagane będą badania podłużne wykraczające poza fazę ostrą. Po trzecie, analiza speckle-tracking wymaga obrazów wysokiej jakości (wyraźnych granic wsierdzia) oraz specjalistycznego oprogramowania, które może nie być dostępne we wszystkich placówkach badawczych. Pomimo tych ograniczeń, protokół zapewnia solidną, powtarzalną platformę do wstępnej charakterystyki funkcjonalnej genów zaangażowanych w przebudowywanie serca po MI.
Celem niniejszego badania było wykorzystanie systemu CRISPR/Cas9 do stworzenia i walidacji modelu myszy z niedoborem Cracd (C57BL/6N-Cracdem1 (c.538-83 to c.3352+255 del)) w celu zbadania wpływu niedoboru Cracd na przebudowę serca po zawale mięśnia sercowego (MI) oraz ruch ścian komór. MI indukowano zarówno u myszy typu dzikiego (WT, C57BL/6N), jak i u myszy z niedoborem Cracd, a kompleksowe oceny przeprowadzono tydzień po MI. Oceny obejmowały konwencjonalne parametry echokardiograficzne, analizę odkształceń metodą speckle-tracking oraz ocenę histopatologiczną. Skupiono się szczególnie na wczesnej fazie po MI (dzień 7), aby uchwycić początkowe zdarzenia przebudowy i ustalić, czy niedobór Cracd wpływa na rozszerzenie komór i funkcję skurczową w ostrej fazie MI. Oczekuje się, że uzyskane wyniki dostarczą cennych informacji na temat roli białka CRACD w modulowaniu niekorzystnej przebudowy serca po MI.
Protokół
All animal experiments were approved by the Institutional Animal Care and Use Committee of the Guangdong Institute of Biotechnology (Approval No. IACUC2025179). The study utilized 20 SPF Cracd-deficient and 20 age- and weight-matched WT mice. All mice were 10–12 weeks old and weighed 20–25 g. All male animals were housed in an AAALAC-accredited facility (License No. SYXK (Yue) 2016-0122) at the Guangdong Institute of Biotechnology (Guangdong Laboratory Animals Monitoring Institute). The housing environment was maintained at 22–25 °C with 50–70% relative humidity under a 12 h light/12 h dark cycle.
1. Generation of Cracd-deficient mice using CRISPR/Cas9
- Use CRISPR/Cas9 gene editing technology to generate Cracd-deficient mice on a C57BL/6N background. Delete the genomic sequence from c.538-83 to c.3352+255 (partial intron 5 to intron 6) of Cracd by homology-directed repair.
NOTE: The mouse Cracd gene (NCBI RefSeq: NM_001163793.1; Ensembl: ENSMUSG00000036377) is located on chromosome 5 and contains 9 exons, with the ATG start codon in exon 2 and the TAA stop codon in exon 9. - Design the sequence of gRNA targeting vector and donor oligonucleotide (with targeting sequence flanked by 120 bp homologous sequences combined on both sides).
- Log in to the NCBI website, select the Primer-BLAST function, and design PCR primers for genotyping.
- Paste the NCBI reference sequence number of Cracd (NM_001163793.1) into the PCR template field, specify the exon range for amplification, and click “Get Primers” to retrieve multiple pairs of candidate primers for PCR-based detection of the deletion and wild-type alleles.
- Design single-guide RNAs (gRNAs) to target sites flanking the intended deletion interval in the Cracd gene.
- Select four gRNA sequences (20 nt upstream of the PAM) using online CRISPR design tools.
- To minimize potential off-target effects, score the candidate gRNAs with CRISPRater and select the two optimal sequences (including the NGG PAM).
NOTE: Example selected sequences:
gRNA-A1: CGGCGCTCTTAACATCCAGAGGG (score: 0.71)
gRNA-A2: CCCTTCAGTCTGGGTAGTAGAGG (score: 0.71)
Accept gRNAs with a CRISPRater score ≥ 0.5. For in vitro validation, accept gRNAs with > 50% cleavage efficiency in a Cas9/gRNA target efficiency detection kit.
- Design a single-stranded donor oligonucleotide to promote efficient joining of the intended breakpoints. Example donor sequence: TTAACCATCAACGGGCCGCTGCAAGGGCTGCTGT
GTCTATA CTCAGGACCACCTGCCCTCTAGAGGCAGGAAGGT
AGAGTTCCAAGCTCTGCTGTGCTAGGTTAAATGCAACTTAACATC. - Co-inject Cas9 mRNA, gRNA and donor oligonucleotide into fertilized eggs to generate Cracd-deficient mice. Prepare Cas9 mRNA and gRNA by in vitro transcription.
- Preparation of gRNA.
- Transcribe gRNAs in vitro from DNA templates using the MEGAshortscript™ T7 transcription kit (see Table of Materials) following the manufacturer's protocol.
- Purify the transcribed gRNAs using an RNA purification kit (see Table of Materials) and elute them in RNase-free water.
- Assess gRNA cleavage activity using an in vitro Cas9/gRNA target efficiency detection kit (see Table of Materials).
- Perform all RNA preparation steps on ice using RNase‑free consumables (pipette tips, tubes, water). Keep RNA samples on ice at all times to prevent degradation.
- To perform the cleavage assay: mix the transcribed gRNA (25 ng/µL) with recombinant Cas9 protein (50 ng/µL) and a PCR-amplified DNA fragment containing the target sequence (50 ng).
- Incubate the reaction at 37 °C for 30 min.
- Run the products on a 2% agarose gel to visualize uncleaved and cleaved bands.
- Calculate cleavage efficiency as the ratio of cleaved band intensity to total (cleaved + uncleaved) band intensity.
- Accept gRNAs with > 50% cleavage efficiency.
- Preparation of Cas9 mRNA.
- Thaw the reagents from the T7 ARCA mRNA Kit (see Table of Materials).
- At room temperature, combine 10 µL of 2× ARCA/NTP mix, 1 µL of template DNA, 2 µL of T7 RNA polymerase mix, and nuclease-free water to 20 µL.
- Mix thoroughly, pulse-spin in a microfuge (5 s at 5000 × g), and incubate at 37 °C for 30 min.
- Remove the template DNA by adding 2 µL of DNase I (1 U/µL), mix well, and incubate at 37 °C for 15 min to obtain Cas9 mRNA. Optionally add 1 µL of RNase inhibitor (40 U/µL) (see Table of Materials) to the reaction to prevent RNA degradation.
- Perform all steps on ice with RNase‑free consumables. Keep the Cas9 mRNA on ice until use.
- Superovulate 4-week-old C57BL/6N female mice by intraperitoneal injection of 5 IU of pregnant mare serum gonadotropin (PMSG), followed 48 h later by 5 IU of human chorionic gonadotropin (hCG).
CAUTION: PMSG and hCG are hormones that may cause skin sensitization. Wear gloves and dispose of needles in a sharps container. - Approximately 14–18 h after hCG injection, euthanize the C57BL/6N female mice and one 8–12-week-old C57BL/6N male mouse by cervical dislocation. Collect oocytes from the oviducts of the females and sperm from the cauda epididymis of the male.
CAUTION: Euthanasia must be performed in accordance with institutional guidelines. Cervical dislocation should only be performed by trained personnel. - Capacitate the sperm in capacitation medium (see Table of Materials).
- Add a small volume of the sperm suspension to the oocytes for in vitro fertilization and co-culture for 3–4 h at 37 °C to obtain fertilized zygotes.
- Dilute the transcribed gRNA and Cas9 mRNA with RNase-free water to working concentrations (typically 25 ng/µL for gRNA and 50 ng/µL for Cas9 mRNA) and donor oligonucleotide at 10 ng/µL.
- Microinject 1–2 pL of the mixture into the cytoplasm of fertilized zygotes using a microinjection system (see Table of Materials).
- Identify healthy zygotes by the presence of two distinct pronuclei and an intact polar body under a stereomicroscope.
- Transplant 300 healthy fertilized zygotes into the oviducts of pseudopregnant female mice that have been mated with vasectomized males.
NOTE: This results in the generation of 2 positive founder mice (F0). - Use RNase‑free water and ice‑cold conditions during dilution to maintain RNA integrity.
- Identify F0 mice by PCR genotyping of tail biopsies (see section 1.6).
- Breed F0 founders with WT mice to generate F1 heterozygous offspring, to obtain germline transmission of the deletion.
- Intercross heterozygous F1 mice to produce F2 homozygous Cracd-deficient mice.
- Preparation of gRNA.
- Genotype by Polymerase Chain Reaction (PCR)
NOTE: The following protocol uses a commercial TIANamp Genomic DNA Kit (see Table of Materials). Buffer GL is the lysis buffer, Buffer GB is the binding buffer, and Buffer WA and Buffer WB are wash buffers.- Place approximately 2–5 mm of mouse tail tissue in a microcentrifuge tube containing 180 µL of Buffer GL, 20 µL of Proteinase K (20 mg/mL stock solution), and 10 µL of RNase A (10 mg/mL stock solution).
- Incubate the sample at 56 °C overnight to digest the tissue.
- Centrifuge the tube at 13800 × g for 2 min at room temperature to pellet tissue debris and transfer the supernatant to a new tube.
- Add 200 µL of Buffer GB and 200 µL of 100% ethanol to the supernatant, mix thoroughly, and apply the mixture to a spin column placed in a collection tube.
- Centrifuge at 13800 × g for 2 min at room temperature and discard the flow-through.
- Add 500 µL of Buffer WA to the column, centrifuge at 13800 × g for 1 min at room temperature and discard the flow-through.
- Carefully add 700 µL of Buffer WB (wash buffer containing ethanol, pre-mixed with 100% ethanol) to the spin column, centrifuge at 13800 × g for 1 min at room temperature and discard the flow-through.
- Apply Buffer WB to the inner wall of the column to wash residual salts.
- Repeat step 1.6.5 once, then transfer the column into a new collection tube and centrifuge at 13800 × g for 2 min at room temperature to dry the membrane and remove residual ethanol.
- Place the column into a new 1.5 mL microcentrifuge tube. Add 50–200 µL of sterilized water or elution buffer (preheated to 65 °C) to the center of the membrane, incubate for 5 min.
- Centrifuge the column at 13800 × g for 2 min at room temperature to elute the DNA.
- To increase DNA yield, either reapply the flow-through to the membrane or add an additional 50–200 µL of sterilized water, incubate for 5 min.
- Perform a final centrifugation at 13800 × g for 2 min.
NOTE: Expect DNA yield of 50–200 ng/µL from tail tissue; A260/A280 ratio of 1.8–2.0 indicates pure DNA.
- Place approximately 2–5 mm of mouse tail tissue in a microcentrifuge tube containing 180 µL of Buffer GL, 20 µL of Proteinase K (20 mg/mL stock solution), and 10 µL of RNase A (10 mg/mL stock solution).
- Genotyping by multiplex PCR using three primers in a single reaction.
- Design three primers to distinguish WT, heterozygous, and homozygous genotypes in one PCR reaction: Forward primer F1 (5’-CAGAAGTCATAGCAGCAAGGCAG-3’, binds upstream of the deletion), Forward primer F2 (5’-GAGGGAATTGAGAGGGAGCC-3’, binds within the deleted region, present only in the WT allele), and Reverse primer R1 (5’-GCCAATTTAGCTGCTTCAAATGTTC-3’, common reverse primer downstream of the deletion).
NOTE: The targeted allele generates a 421 bp amplicon (F1 + R1) only when the deletion is present; the WT allele generates a 357 bp amplicon (F2 + R1) only when the intact allele is present. - Set up the PCR reaction in a 25 µL total volume containing 50–100 ng genomic DNA, 0.2 µM of each primer (F1, F2, and R1), 200 µM dNTPs, 1.5 mM MgCl₂, and 1 U Taq DNA polymerase (see Table of Materials).
- Use the following thermocycling program: initial denaturation at 95 °C for 3 min; 35 cycles of denaturation at 95 °C for 15 s, annealing at 60°C for 15 s, and extension at 72 °C for 25 s; and a final extension at 72 °C for 5 min.
- Separate the PCR products by 1–2% agarose gel electrophoresis (120 V, 30 min) in 1× TAE buffer.
- Genotype interpretation based on band pattern: WT shows only a 357 bp band (F2+R1); Heterozygous shows both 421 bp (F1+R1) and 357 bp (F2+R1) bands; Homozygous shows only a 421 bp band (F1+R1).
- Design three primers to distinguish WT, heterozygous, and homozygous genotypes in one PCR reaction: Forward primer F1 (5’-CAGAAGTCATAGCAGCAAGGCAG-3’, binds upstream of the deletion), Forward primer F2 (5’-GAGGGAATTGAGAGGGAGCC-3’, binds within the deleted region, present only in the WT allele), and Reverse primer R1 (5’-GCCAATTTAGCTGCTTCAAATGTTC-3’, common reverse primer downstream of the deletion).
2. Myocardial infarction model establishment
- Anesthetize the mice via inhalation of 3% isoflurane (delivered in 100% oxygen at 1 L/min), place them in a supine position on a surgical platform, and confirm deep anesthesia by the absence of pedal withdrawal reflex.
CAUTION: Isoflurane is a volatile anesthetic. Use only in a well-ventilated area or under a fume hood to avoid inhalation. - Perform orotracheal intubation using a 20-gauge intravenous catheter sheath. Apply ophthalmic ointment to both eyes to prevent corneal drying during surgery.
- Connect the tube to a mechanical ventilator upon successful intubation to maintain ventilation and anesthesia with 2% isoflurane.
NOTE: Successful intubation is confirmed by visible chest movements synchronized with the ventilator.
- Connect the tube to a mechanical ventilator upon successful intubation to maintain ventilation and anesthesia with 2% isoflurane.
- Remove hair from the anterior chest with depilatory cream. Disinfect the surgical area by applying povidone-iodine and 70% alcohol in a circular motion for multiple times, starting from the center and moving outward.
- After fully exposing the skin, make a 1–1.5 cm incision in the left chest wall between the 2nd and 3rd intercostal spaces to open the thoracic cavity.
- Incise the pericardium to fully expose the heart.
CAUTION: Surgical procedures must be performed under sterile conditions. Use appropriate personal protective equipment (PPE), including gloves and a surgical mask.
- Using the inferior border of the left auricle as a landmark, pass a 7–0 atraumatic suture needle beneath the left anterior descending coronary artery (LAD) approximately 2–3 mm distal to its origin.
- Pass the needle to a depth of approximately 0.5–1 mm and tighten the ligature slowly to avoid myocardial tearing.
- Confirm successful occlusion by observing pallor (whitening) of the left ventricular anterior wall distal to the ligation site within 30 s.
- In sham-operated controls, open the chest and pass the suture beneath the coronary artery without tying the knot.
- After establishing the model, sequentially suture the ribs (4-0 absorbable suture, simple interrupted pattern) and skin (4-0 absorbable suture, continuous pattern) to close the thoracic cavity. Remove the endotracheal tube once the mouse resumes stable spontaneous breathing.
- Place mice on a heating pad (37 °C) until fully conscious.
- Administer postoperative analgesia (e.g., buprenorphine 0.05–0.1 mg/kg, subcutaneously, every 12 h for 48 h) according to institutional IACUC guidelines and closely monitor the postoperative health status for several days.
NOTE: Monitor for signs of distress (hunched posture, ruffled fur, reduced mobility, weight loss > 20%).
- Administer postoperative analgesia (e.g., buprenorphine 0.05–0.1 mg/kg, subcutaneously, every 12 h for 48 h) according to institutional IACUC guidelines and closely monitor the postoperative health status for several days.
- Mortality and exclusion criteria.
- Record the number of mice that die within the first 7 days after MI surgery.
NOTE: In a typical cohort, expect a mortality rate of approximately 10–20% by postoperative day 7, with no significant difference between WT and Cracd‑deficient mice. Common causes of death include extensive infarction leading to acute heart failure, surgical bleeding, or pneumothorax. Exclude any mouse with persistent arrhythmia (heart rate < 350 bpm) or signs of severe distress (e.g., hunched posture, ruffled fur, weight loss > 20%) from subsequent echocardiographic and histological analyses. For sham‑operated mice, mortality should be < 5%.
- Record the number of mice that die within the first 7 days after MI surgery.
3. Echocardiographic assessment
- Animal Preparation and Anesthesia
- Power on the high-resolution small animal ultrasound imaging system (see Table of Materials) and its integrated heated stage.
- Ensure that the appropriate high-frequency transducer is securely connected to the mounting apparatus following the manufacturer’s instructions. Set the temperature of the heated stage to 37 °C and allow it to stabilize.
- Place mice in an induction chamber and anesthetize them with 3% isoflurane in oxygen (1–2 L/min) until the pedal withdrawal reflex is absent. Transfer anesthetized mice to the heated platform in a supine position.
- Maintain anesthesia with 1–1.5% isoflurane delivered via a nose cone, adjusting to maintain heart rate between 450–550 beats per min.
- Apply ophthalmic ointment to both eyes to prevent corneal drying.
- Shave the thoracic region, evenly apply depilatory cream for no longer than 3 min, then remove the depilatory cream thoroughly with wet gauze.
- Rinse the skin gently with warm saline if necessary and dry the area. Attach surface ECG electrodes to the limbs using electrode gel at the contact sites and secure them with tape.
NOTE: Confirm stable ECG and heart rate within 450–550 bpm before proceeding to ultrasound imaging.
- Power on the high-resolution small animal ultrasound imaging system (see Table of Materials) and its integrated heated stage.
- Conventional Echocardiography Image Acquisition
- Position the mouse in a horizontal, supine posture on the heated stage, with a slight leftward tilt if needed to optimize cardiac imaging.
- Apply a generous amount of pre-warmed ultrasound coupling gel to the hairless left precordial region, avoiding air bubbles.
- Place the transducer gently on the chest wall at the left parasternal position. Adjust its orientation so that the index mark points toward the mouse’s right shoulder and fine-tune the angle and pressure to optimize image quality.
- Switch to B-mode (two-dimensional) imaging, adjust depth, focus zone, and frame rate to obtain a clear parasternal long-axis view of the left ventricle. Acceptable image quality requires clear visualization of the endocardial border with no dropouts.
- Once the heart rate stabilizes (450–550 bpm), acquire three separate parasternal long-axis B-mode cine loops, each containing at least 3–5 consecutive cardiac cycles.
- Save each loop by pressing “Cine Store”, and store representative still frames using “Frame Store”.
- From the long‑axis view, rotate the transducer 90° clockwise to obtain a short‑axis view at the mid‑papillary level.
- Acquire three separate short‑axis B‑mode cine loops (each with ≥ 3–5 cycles).
- Activate M‑mode, position the cursor perpendicular to the interventricular septum and posterior wall, and record three separate M‑mode tracings.
NOTE: Acceptable M‑mode tracings require clear endocardial borders throughout the cardiac cycle.
- Use the VevoLab 3.2.0 software (see Table of Materials) to measure the following parameters from M‑mode tracings according to the American Society of Echocardiography leading‑edge method: interventricular septum thickness at diastole and systole (IVSd, IVSs), left ventricular internal diameter at diastole and systole (LVIDd, LVIDs), and left ventricular posterior wall thickness at diastole and systole (LVPWd, LVPWs).
- Calculate left ventricular ejection fraction (EF) and fractional shortening (FS) using the Teichholz formula: EF (%) = [(LV Vold - LV Vols) / LV Vold] × 100, LV Vold = ((7 / (2.4 + LVIDd)) × LVIDd3), LV Vol;s = ((7 / (2.4 + LVIDs)) × LVIDs3), FS (%) = [(LVIDd – LVIDs) / LVIDd] × 100.
NOTE: For each mouse, measurements were averaged from three consecutive cardiac cycles per M‑mode recording, and the average was taken across three separate recordings, resulting in a total of 9 measurements per parameter per mouse.
- Calculate left ventricular ejection fraction (EF) and fractional shortening (FS) using the Teichholz formula: EF (%) = [(LV Vold - LV Vols) / LV Vold] × 100, LV Vold = ((7 / (2.4 + LVIDd)) × LVIDd3), LV Vol;s = ((7 / (2.4 + LVIDs)) × LVIDs3), FS (%) = [(LVIDd – LVIDs) / LVIDd] × 100.
- Position the mouse in a horizontal, supine posture on the heated stage, with a slight leftward tilt if needed to optimize cardiac imaging.
- Speckle-Tracking Strain Analysis
- Perform speckle-tracking analysis using the dedicated analysis software (VevoStrain module within VevoLab 3.2.0).
- Open a clear parasternal long-axis B-mode cine loop, select "Vevo Strain" to enter the strain analysis mode, retain only complete cardiac cycles, and choose "Long Axis".
- Manually trace the endocardial border at the end‑diastolic frame. After the endocardial border is drawn, the software automatically generates an epicardial border (adjust as needed). Then start the strain analysis and activate the "toggle contour/vector/orbit line/B mode" function to visualize the motion trajectory.
- Assess tracking quality via the colour‑coded mesh: it should appear green, closely follow the endocardial and epicardial borders without jerking, and move synchronously with myocardial contraction/relaxation. If not, manually refine the borders and re‑analyze.
- Activate "Time‑to‑peak analysis" to divide the left ventricle into six segments (basal anterior, mid anterior, apical anterior, apical posterior, mid posterior, basal posterior), with each colour representing an individual segment. Once satisfactory tracking is achieved, export data for wall motion parameters: velocity (cm/s), displacement (cm), strain (%), strain rate (1/s) for both longitudinal and radial.
NOTE: If tracking quality remains poor after three acquisition attempts (e.g., erratic strain curves, or inability to visualise clear motion trajectories), exclude the mouse from strain analysis.
- Perform speckle-tracking analysis using the dedicated analysis software (VevoStrain module within VevoLab 3.2.0).
4. Histopathological analysis
- After echocardiography, administer a lethal dose of isoflurane to deeply anesthetized mice and apply a secondary physical method (e.g., cervical dislocation) according to institutional guidelines.
- Open the thoracic cavity, rapidly harvest the hearts and rinse the hearts gently in cold phosphate-buffered saline (PBS).
CAUTION: Euthanasia must be performed according to institutionally approved protocols.
- Open the thoracic cavity, rapidly harvest the hearts and rinse the hearts gently in cold phosphate-buffered saline (PBS).
- Trim the hearts, remove the great vessels and cut transversely from apex to base into 2–3 slices (approximately 2–3 mm thick).
- Immerse the tissue slices in 4% paraformaldehyde in PBS and fix them at 4 °C for 12–24 h.
NOTE: Use a volume ratio of fixative to tissue of at least 10:1.
CAUTION: Paraformaldehyde is toxic and a suspected carcinogen. Handle in a fume hood and wear appropriate PPE (gloves, lab coat, safety goggles). Dispose of paraformaldehyde waste as hazardous chemical waste according to institutional guidelines.
- Immerse the tissue slices in 4% paraformaldehyde in PBS and fix them at 4 °C for 12–24 h.
- Dehydrate tissue through a graded ethanol series (50%, 70%, 80%, 95%, 100% ethanol, each for 1 h), clear them in xylene (2 changes, 30 min each), embed them in paraffin, and section them at 4–5 µm thickness using a microtome.
NOTE: Sections should be free of folds and tears.
CAUTION: Xylene is flammable and toxic. Use only in a fume hood and avoid skin contact. Collect xylene waste in a designated container and dispose of as hazardous chemical waste. - Deparaffinize the sections in xylene (2 changes, 5–10 min each), rehydrate them through descending ethanol series (100%, 95%, 80%, 70%, each for 3 min) to water.
- Stain them using standard Hematoxylin and Eosin (H&E) (see Table of Materials) and Masson’s trichrome protocols (see Table of Materials).
CAUTION: Xylene is toxic. Use only in a fume hood and avoid skin contact. Dispose of xylene waste as hazardous material.
- Stain them using standard Hematoxylin and Eosin (H&E) (see Table of Materials) and Masson’s trichrome protocols (see Table of Materials).
- Examine the stained sections under a light microscope (see Table of Materials).
- For quantitative analysis, capture digital images at 4×, 20×, and 40× magnification using a digital camera attached to the microscope. Measure infarct size and fibrotic area using ImageJ.
NOTE: Infarct size (%) = (infarct area / total LV area) × 100; collagen content (%) = (blue-stained area / total myocardial area) × 100.
- For quantitative analysis, capture digital images at 4×, 20×, and 40× magnification using a digital camera attached to the microscope. Measure infarct size and fibrotic area using ImageJ.
Wyniki
Generation of Cracd-deficient mice
A heritable mouse model carrying a targeted deficiency in the Cracd gene was generated using CRISPR/Cas9-mediated genome editing (Figure 1A, Figure 1B). To distinguish WT, heterozygous, and homozygous genotypes, a multiplex PCR was performed using three primers (F1, F2, R1) in a single reaction. Mice homozygous for the deletion (Cracd‑deficient) displayed only the 421 bp band, WT mice showed only the 357 bp band (Figure 1C). Sanger sequencing of genomic DNA from Cracd-deficient mice confirmed the predicted deletion in the target gene compared to WT controls (Figure 1D). Western blot analysis further demonstrated a marked reduction in CRACD protein levels in cardiac tissues from Cracd-deficient mice compared with WT controls (Figure 1E). Together, these data confirm the successful establishment of the Cracd-deficient mouse line.
Echocardiography
Echocardiographic assessment on postoperative day 7 revealed pronounced pathological cardiac remodeling in WT mice after MI (WT-MI) compared with sham-operated controls (Figure 2A). The WT-MI group showed thinning of the interventricular septum (Figure 2B, C), significant left ventricular (LV) dilation as reflected by increased LVIDd (Figure 2D) and LVIDs (Figure 2E), and thinning of the posterior wall (Figure 2F, G). These structural alterations were associated with a pronounced decline in global systolic function, as demonstrated by significantly reduced EF (Figure 2H) and FS (Figure 2I). In contrast, Cracd-deficient mice displayed a cardioprotective phenotype following MI. LV dilation was significantly attenuated, with notably smaller LVIDd and LVIDs compared with the WT-MI group. Furthermore, these mice exhibited improved systolic thickening of the posterior wall and maintained significantly higher EF and FS values. These findings indicate that Cracd deficiency effectively attenuates post-infarction LV dilation and preserves global systolic function.
Speckle-tracking strain analysis
Left ventricular myocardial motion and deformation were further evaluated by speckle‑tracking echocardiography using only parasternal long‑axis views (Figure 3A). To ensure data reliability, we defined pragmatic criteria for acceptable output based on the capabilities of the VevoStrain software. Acceptable strain analysis required: (i) a clear parasternal long‑axis view with endocardial borders visible throughout the cardiac cycle; (ii) a stable heart rate between 450–550 bpm during acquisition; (iii) after automatic tracking, the colour‑coded mesh (activated via “toggle contour/vector/orbit line/B mode”) had to closely follow the endocardial and epicardial borders without jerking or losing contact; and (iv) strain curves had to be smooth, show consistent waveforms across segments, and lack sudden spikes or arrhythmic interruptions. Suboptimal output—most commonly erratic strain curves or inability to visualise clear motion trajectories—led to manual adjustment of endocardial or epicardial contours and re‑analysis. If quality remained poor after three attempts, the mouse was excluded. Using these criteria, we obtained reliable strain data in WT‑MI mice and Cracd‑deficient MI mice.
Compared with the sham group, WT-MI mice exhibited significantly reduced radial velocity (Figure 3B) and longitudinal velocity (Figure 3C), as well as radial displacement (Figure 3D) and longitudinal displacement (Figure 3E), indicating impaired global myocardial motion. The absolute values of radial strain (Figure 3F), radial strain rate (Figure 3G), longitudinal strain (Figure 3H), and longitudinal strain rate (Figure 3I) were also markedly decreased, reflecting severely compromised regional myocardial deformation and function. In contrast, Cracd-deficient mice showed significant improvement in these parameters. Compared with the WT-MI group, they displayed better recovery of radial and longitudinal displacements. Furthermore, radial velocity, radial strain, and radial strain rate were maintained at higher levels, while longitudinal strain and longitudinal strain rate were significantly improved. These results suggest that Cracd deficiency not only preserves global systolic function but also enhances regional LV myocardial deformation after MI.
The speckle‑tracking imaging analysis also included visualization of segmental strain distribution and cardiac motion trajectories. Parasternal long‑axis B‑mode images with segmented six regions (BA, MA, AA, AP, MP, BP) and color gradient mapping are displayed in Figure 4A. Cardiac motion trajectories, time‑to‑peak curves for radial and longitudinal strain, parametric distribution maps of strain synchrony, and three‑dimensional reconstructions are presented in Figure 4B. These data further support the functional improvements observed in Cracd‑deficient mice.
Histological examination
To assess the protective effect of Cracd deficiency against MI, histopathological examination was performed on heart sections from WT and Cracd-deficient mice at 7 days post-MI using H&E and Masson's trichrome staining. Whole‑heart longitudinal sections are shown in Figure 5A, with quantitative analysis of infarct size and collagen content presented in Figure 5B and Figure 5C, respectively. High‑magnification views of the infarct zone, border zone, and remote zone are displayed in Figure 5D. In WT-MI hearts, H&E staining showed pronounced left ventricular wall thinning and a well-demarcated infarct zone. Within the infarct region, extensive inflammatory cell infiltration, myocardial necrosis, and marked fibrosis with scar formation were observed. In the border zone, inflammatory infiltration, myocardial necrosis, fibrosis and cardiomyocyte hypertrophy were evident, while the remote zone displayed prominent hypertrophic changes. Corresponding Masson's trichrome staining further demonstrated extensive interstitial fibrosis within both the infarct and border zones of WT hearts following MI. In contrast, Cracd-deficient mice exhibited substantially attenuated pathological alterations, including reduced wall thinning, diminished inflammatory infiltration and myocardial necrosis, less pronounced cardiomyocyte hypertrophy, and markedly decreased interstitial fibrosis compared with WT-MI hearts. These histological findings indicate that Cracd deficiency mitigates post-infarction myocardial damage and adverse remodeling.
Successful protocol execution should yield: (i) a well‑demarcated infarct zone with extensive collagen deposition in WT-MI hearts; (ii) clear cellular morphology without staining artifacts; and (iii) significantly attenuated pathology in Cracd‑deficient MI hearts. Although infarct size may vary with ligation precision, the genotype‑dependent difference is a reliable indicator of successful performance.
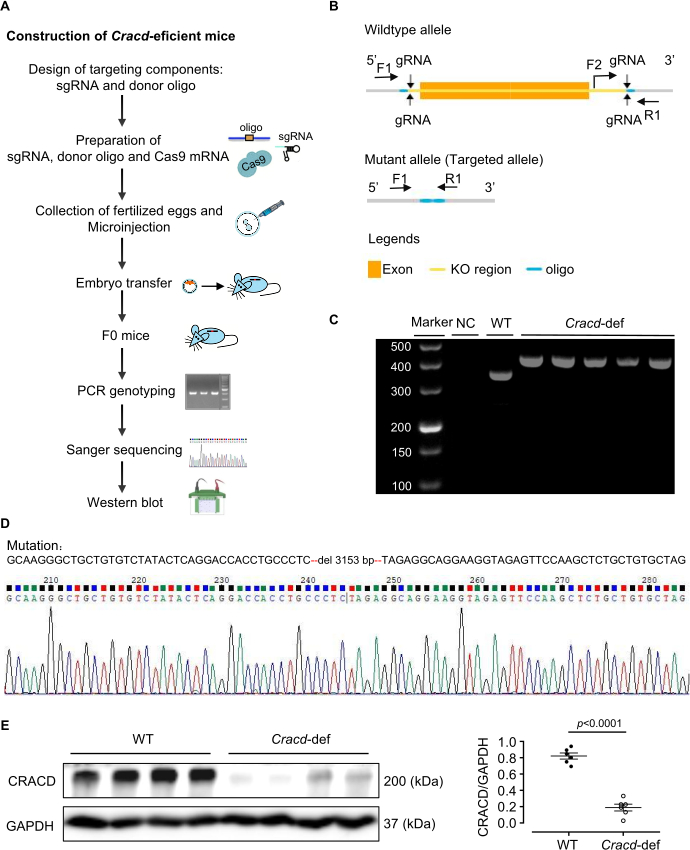
Figure 1: Generation of Cracd-deficient mice. (A) Construction of Cracd-deficient mice. (B) Schematic of the Cracd gene modification strategy. (C) PCR genotyping of tail genomic DNA. WT mice show a single 357 bp band, while homozygous (Cracd‑deficient) mice show a single 421 bp band. (D) Sanger sequencing of genomic DNA confirmed the predicted deletion in the Cracd locus of deficient mice compared to WT controls. (E) Western blot analysis showed significantly reduced CRACD protein levels in the hearts of Cracd-deficient mice compared to WT controls. n = 6 mice per group. Data are presented as mean ± SEM. Statistical significance was calculated with a two-tailed unpaired Student's t-test. Please click here to view a larger version of this figure.
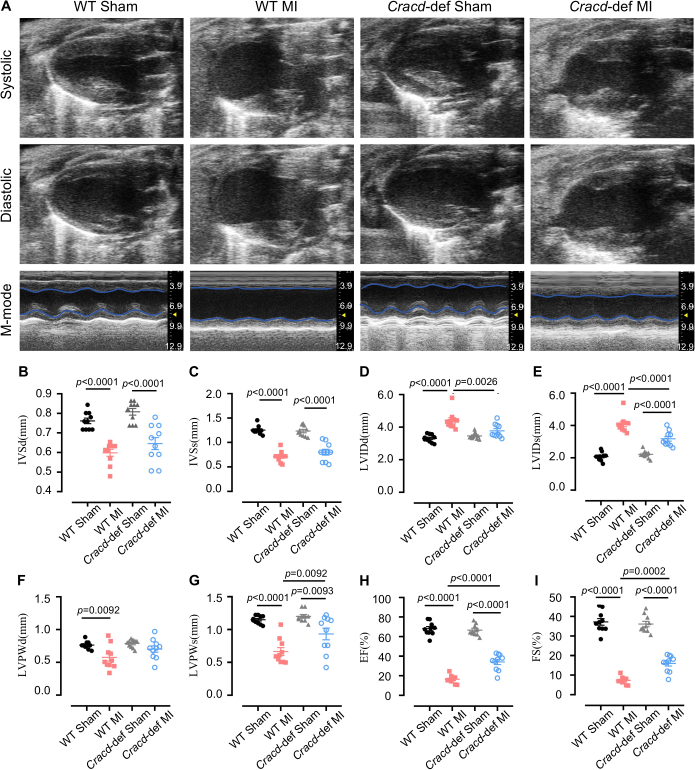
Figure 2: Echocardiographic assessment of cardiac function. (A) Representative B-mode and M-mode echocardiographic images of mouse hearts at diastole and systole. Quantitative analysis of (B) interventricular septum thickness at diastole (IVSd) and (C) systole (IVSs), (D) left ventricular internal diameter at diastole (LVIDd) and (E) systole (LVIDs), (F) left ventricular posterior wall thickness at diastole (LVPWd) and (G) systole (LVPWs), (H) ejection fraction (EF), and (I) fractional shortening (FS). n = 10 mice per group. Data are presented as mean ± SEM. Statistical significance was determined by one-way ANOVA followed by Tukey's multiple comparisons test. Please click here to view a larger version of this figure.
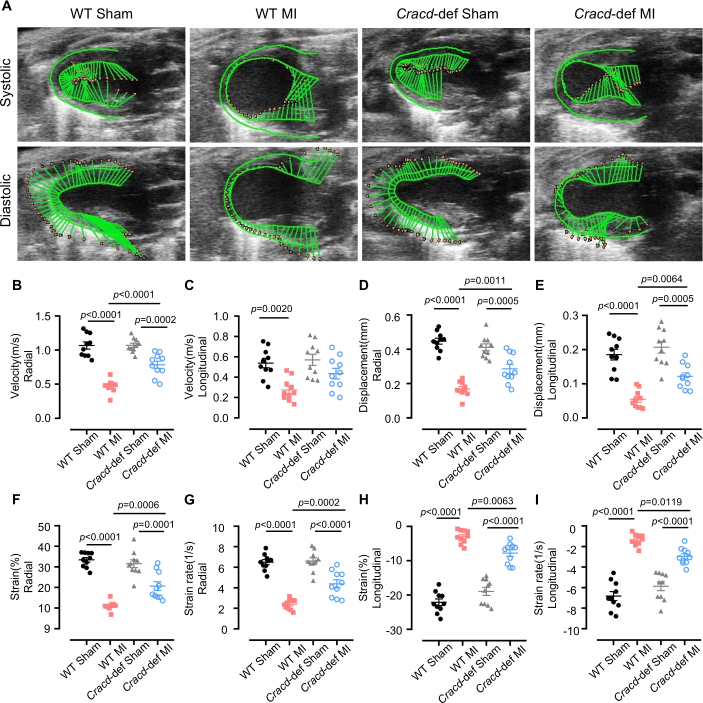
Figure 3: Speckle-tracking strain analysis. (A) Representative images of left ventricular wall motion and deformation at diastole and systole. Quantitative analyses of the following parameters: (B) radial velocity, (C) longitudinal velocity, (D) radial displacement, (E) longitudinal displacement, (F) radial strain, (G) radial strain rate, (H) longitudinal strain, and (I) longitudinal strain rate. n = 10 mice per group. Data are presented as mean ± SEM. Statistical significance was determined by one-way ANOVA followed by Tukey's multiple comparisons test. Please click here to view a larger version of this figure.
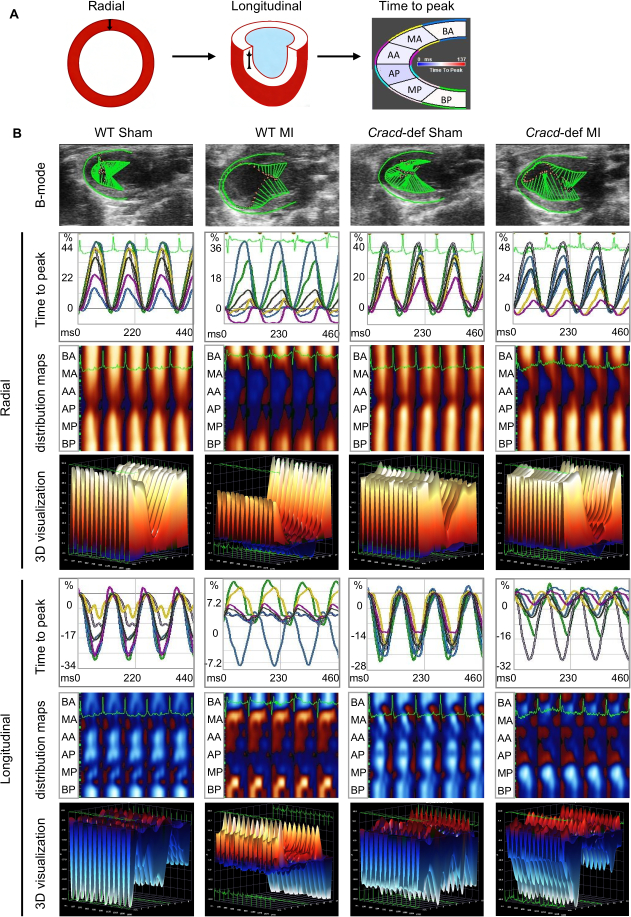
Figure 4: Speckle-tracking imaging in WT-Sham, WT-MI, Cracd-deficient Sham, and Cracd-deficient MI groups at 7 days post-MI. (A) Parasternal long‑axis B‑mode images. Left ventricular wall was segmented into six regions: BA (basal anterior), MA (mid anterior), AA (apical anterior), AP (apical posterior), MP (mid posterior), and BP (basal posterior). Color gradient from blue to red represents increasing strain magnitude. (B) Cardiac motion trajectories; time-to-peak curves for radial and longitudinal strain values along with corresponding peak times. Parametric distribution maps of strain synchrony (blue/red indicate direction: radial – away from/toward center; longitudinal – away from/toward apex). White dots = highest velocity regions, black dots = lowest velocity. Three-dimensional reconstructions (X: time, Y: spatial position, Z: strain magnitude). Please click here to view a larger version of this figure.
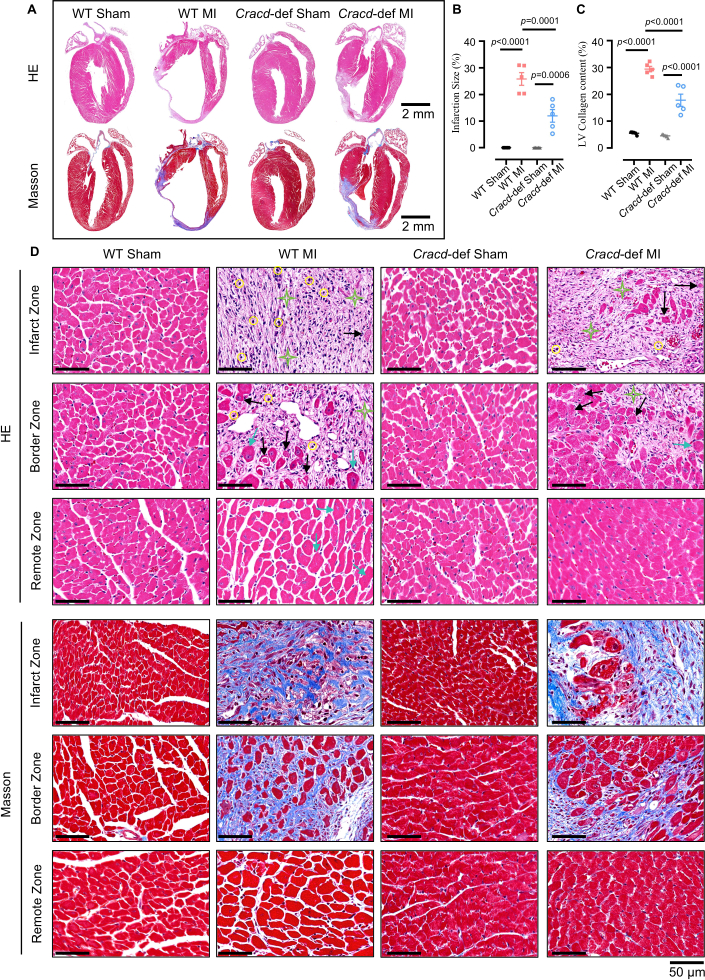
Figure 5: Histopathological analysis of cardiac remodeling after MI. (A) Whole-heart longitudinal sections with H&E and Masson's trichrome staining. Scale bars: 2 mm. (B) Quantitative analysis of infarct size and (C) collagen content. (D) High‑magnification views of infarct zone (IZ), border zone (BZ), and remote zone (RZ). H&E: yellow circles = inflammatory infiltration; black arrows = myocardial necrosis; green stars = fibrosis; blue arrows = hypertrophy. Masson’s trichrome: blue indicates collagen deposition. Scale bar: 50 μm. n = 5 mice per group. Data are presented as mean ± SEM. Statistical significance was determined by one-way ANOVA followed by Tukey's multiple comparisons test. Please click here to view a larger version of this figure.
Dyskusja
W niniejszym badaniu stworzyliśmy mysz z deficytem Cracd otrzymaną dzięki inżynierii CRISPR/Cas9 oraz opracowaliśmy schemat fenotypowania po zawałach mięśnia sercowego (MI) z wykorzystaniem konwencjonalnej echokardiografii, obrazowania odkształceń metodą śledzenia plamek (speckle-tracking strain imaging) oraz histologii. Protokół pozwolił na uzyskanie osobników z nokautem z potwierdzoną utratą białka CRACD. Myszy z deficytem Cracd wykazały mniejszą dylatację komór, lepszą frakcję wyrzutową (EF) oraz zmniejszoną włóknienie w porównaniu z grupą kontrolną WT po MI, co potwierdza użyteczność tego modelu w badaniu przebudowy serca.
Sukces tego modelu zależy od kilku krytycznych etapów. Projektowanie gRNA oraz walidacja in vitro bezpośrednio wpływają na wydajność edycji zygoty23. Do wyboru gRNA z wynikami CRISPRater ≥ 0,5 wykorzystujemy programy CRISPick lub Benchling, a następnie testujemy wydajność cięcia za pomocą testu Cas9/gRNA in vitro. Do mikroiniekcji przekazywane są wyłącznie gRNA, które osiągają wydajność cięcia > 50%. Równie istotne jest prawidłowe podwiązanie LAD: szew 7‑0 musi przechodzić 2–3 mm od początku LAD na głębokości 0,5–1 mm, aby uniknąć przebicia prawej komory (zbyt głęboko) lub niepełnego zamknięcia naczynia (zbyt płytko); natychmiastowe zblednięcie ściany przedniej potwierdza zamknięcie. Niezbędna jest również kontrola częstości akcji serca podczas echokardiografii24 – utrzymanie wartości 450–550 bpm poprzez regulację stężenia izofluranu (zazwyczaj 1–2%) poprawia powtarzalność pomiarów konwencjonalnych i odkształceń. Na koniec, w przypadku analizy speckle‑tracking, kluczowa jest ocena wizualna kolorowej siatki25. Siatka musi podążać za granicami mięśnia sercowego bez gwałtownych przesunięć, w przeciwnym razie wymagana jest ręczna korekta; jeśli po trzech próbach jakość pozostaje niska, mysz jest wykluczana z badania.
Nawet przy skrupulatnym przestrzeganiu protokołu mogą wystąpić pewne trudności techniczne. Większość z nich można rozwiązać poprzez systematyczne usuwanie usterek. Niskie wskaźniki transmisji w linii zarodkowej (poniżej 10%) zazwyczaj wskazują na słabą integrację oligonukleotydu donora lub niską aktywność gRNA26. W związku z tym zwiększenie stężenia oligo donora do 20 ng/µL, wydłużenie ramion homologii do 120–200 bp oraz ponowna weryfikacja cięcia gRNA (> 50%) mogą poprawić transmisję. Wysoka śmiertelność po MI (powyżej 30%) często wynika z odmy opłucnowej, krwawienia oraz rozległego zawału27. Dlatego utrzymywanie myszy na ciągłym tlenie aż do momentu wybudzenia oraz stosowanie maty grzewczej w celu utrzymania temperatury ciała znacząco zmniejsza wskaźniki śmiertelności. Jeśli ściana przednia nie blednie po ligacji, prawdopodobnie błędnie zidentyfikowano LAD lub szew jest zbyt płytki. W takim przypadku ponowne zlokalizowanie LAD (jasnoczerwone naczynie biegnące ukośnie) i ponowne przeprowadzenie igły na głębokość 0,5–1 mm, niekiedy przy użyciu mikroskopu stereoskopowego, rozwiązuje ten problem. W przypadku słabej jakości speckle-trackingu, zazwyczaj przyczyną jest niska częstotliwość klatek, rozmyte krawędzie lub artefakty ruchowe28. Odpowiednio, zwiększenie częstotliwości klatek, precyzyjne dostrojenie wzmocnienia, ręczna korekta obrysu wsierdzia oraz odrzucenie cykli z arytmią pomagają w rozwiązaniu tych problemów.
Poza tymi kwestiami operacyjnymi, metoda ta posiada wyraźne ograniczenia. Nokaut Cracd ma charakter globalny, zatem białko CRACD nie występuje we wszystkich tkankach. W konsekwencji obserwowana ochrona nie może zostać przypisana wyłącznie kardiomiocytom, ponieważ rolę mogą odgrywać również wkłady systemowe. Aby rozdzielić role specyficzne dla poszczególnych typów komórek, konieczne byłoby zastosowanie nokautu kondycjonalnego. Kolejnym ograniczeniem jest pojedynczy punkt czasowy w 7. dniu; nie dostarcza on informacji na temat przewlekłego przebudowywania. Dlatego w badaniach długoterminowych należy uwzględnić późniejsze punkty czasowe (4 lub 8 tygodni). Powtarzalność zależy również od jakości obrazowania: nie każdy system USG pozwala na uzyskanie wyraźnych granic wsierdzia, a istotne jest doświadczenie operatora. W związku z tym zaleca się, aby wszystkie zabiegi chirurgiczne i pomiary wykonywała osoba przeszkolona zawodowo.
W obliczu tych ograniczeń warto porównać nasze podejście z alternatywnymi strategiami badania funkcji genów w przebudowie po zawale mięśnia sercowego (MI). Manipulacja genetyczna za pośrednictwem AAV oraz oligonukleotydy antysensowne (ASO) to dwie powszechne alternatywy29,30. AAV9 pozwala na specyficzną dla serca, przejściową nadekspresję lub wyciszenie genów bez konieczności krzyżowania osobników, jednak jego limit pakowania (~4,7 kb), zmienna wydajność transdukcji oraz efekty poza docelowe stanowią wady tej metody31. W przeciwieństwie do tego, nasz model knockoutu CRISPR/Cas9 zapewnia trwałą, całkowitą utratę funkcji, co jest korzystne w badaniach długoterminowych. ASO umożliwiają odwracalne, zależne od dawki wyciszenie o szybkim początku działania, co czyni je odpowiednimi do interwencji ostrych; wymagają one jednak wielokrotnego podawania i nie wykazują specyficzności tkankowej32. W związku z tym opisany tutaj konstytutywny knockout jest najlepszym rozwiązaniem dla wstępnych odkryć oraz chronicznego fenotypowania.
Wreszcie, protokół ten można rozszerzyć znacznie poza zakres CRACD. Ten sam schemat postępowania — generowanie myszy z nokautem za pomocą CRISPR/Cas9 w połączeniu z echokardiografią, obrazowaniem odkształceń (strain imaging) oraz histologią — może służyć do oceny dowolnego kandydującego genu w przebiegu przebudowy po zawale mięśnia sercowego (MI). Ramy fenotypowania są również odpowiednie dla innych modeli chorób układu sercowo-naczyniowego, takich jak poprzeczna konstrikcja aorty (przeciążenie ciśnieniowe) czy uszkodzenie niedokrwienno-reperfuzyjne. Ponadto próbki tkanek uzyskane zgodnie z tym protokołem mogą być wykorzystane do analiz multiomicznych (transkryptomiki, proteomiki, metabolomiki) w celu odkrycia mechanizmów molekularnych. Cracdmodel z deficytem może służyć jako narzędzie do testowania leków: możliwe jest ocenienie związków, których podejrzewa się o działanie poprzez szlak CRACD. Tym samym niniejszy protokół stanowi platformę możliwą do dostosowania do szerokiego zakresu badań mechanistycznych i translacyjnych w badaniach układu sercowo-naczyniowego.
Oświadczenia
Autorzy oświadczają, że nie mają żadnych konfliktów interesów.
Podziękowania
Praca ta była wspierana przez Guangdong Basic and Applied Basic Research Foundation (2023A1515011278), projekt finansowany z funduszy własnych Guangdong Provincial Biotechnology Research Institute (GDBRI-ZL202602) oraz program wymiany i współpracy akademickiej Chiny-Kanada w zakresie modeli i patogenezy chorób układu sercowo-naczyniowego (MS202500058).
Materiały
| Nazwa | Firma | Numer katalogowy | Komentarze |
|---|---|---|---|
| CRISPR/Cas9 | |||
| Roztwór chlorowodorku trizny | Sigma-Aldrich, USA | T2663 | Stosowany do przygotowania buforu do ekstrakcji DNA |
| Proteinaza K | Sigma-Aldrich, USA | 539480 | Stosowane do trawienia ogona myszy |
| Mieszanka Green Taq | Vazyme, Chiny | P131 | Stosowane do amplifikacji PCR |
| Agaroza | BioFroxx, Niemcy | 1110GR500 | Stosowane do elektroforezy żelowej DNA przy 1–stężenie 2% |
| Marker DNA | Thermo Scientific, USA | SM0242 | Stosowany jako drabinka DNA do określania wielkości produktów PCR |
| Zestaw do izolacji genomowego DNA TIANamp | Tiangen Biotech, Chiny | DP304 | Stosowane do ekstrakcji genomicznego DNA z tkanki ogona myszy |
| MEGAshortscript™ zestaw do transkrypcji T7 | Thermo Scientific, USA | AM1354 | Stosowane do transkrypcji in vitro gRNA |
| Zestaw do oczyszczania RNA | Zymo Research, USA | R1016 | Stosowane do oczyszczania transkrybowanego gRNA |
| BeyoCRISPR™ Zestaw do skriningu sgRNA | Beyotime, Chiny | D8412S | Stosowane do oceny in vitro aktywności cięcia gRNA |
| inhibitor RNazy | NEB, USA | M0314 | Stosowane w celu zapobiegania degradacji RNA podczas transkrypcji in vitro |
| TaKaRa Taq | Takara Bio, Japonia | R001A | Stosowane do genotypowania metodą PCR DNA z ogona myszy |
| FERTIUP® Poziomka do preinkubacji plemników mysich: PM | Cosmo Bio, Japonia | KYD-002-EX | Stosowane do kapacytacji plemników przed zapłodnieniem in vitro |
| Zestaw do syntezy mRNA T7 ARCA | NEB, USA | E2060 | Stosowane do transkrypcji in vitro mRNA Cas9 |
| gonadotropina z surowicy klaczy w ciąży | MCE, USA | 9002-70-4 | Stosowane do superowulacji, podawane poprzez wstrzyknięcie doszpikowe |
| Ludzka gonadotropina kosmórkowa | ProSpec, Izrael | HOR-250 | Stosowany do indukcji owulacji, podawany poprzez wstrzyknięcie dosytrojeniowe |
| woda wolna od RNaz | Aladdin, Chiny | R665526 | Stosowane do rozpuszczania RNA i przygotowania reakcji PCR |
| Startery | Sangon Biotech, Chiny | / | Stosowane do genotypowania |
| Chirurgia | |||
| Izofluran | RWD Life Science, Chiny | R510-22-10 | Stosowany do indukcji i podtrzymywania znieczulenia podczas operacji |
| Krem do depilacji | Veet, Francja | 1000207 | Nanieść na obszar klatki piersiowej w celu usunięcia sierści przed operacją i badaniem ultrasonograficznym |
| Szew 7-0 | Lingqiao, Chiny | LQ7022380206 | Stosowane do trwałego podwiązania lewej przedniej zstępującej (LAD) tętnicy wieńcowej |
| Szew 4-0 | Lingqiao, Chiny | LQ4022380412 | Stosowane do zamknięcia nacięcia skóry po operacji |
| Wentylator anestezjologiczny | Harvard Apparatus, USA | Blat laboratoryjny | Służy do podawania izofluranu i wspomagania oddychania |
| Respirator dla małych zwierząt | Taimeng, Chiny | HX-101E | Stosowane do zapewnienia wentylacji ciśnieniowej podczas operacji w otwartej klatce piersiowej |
| Mata grzewcza o stałej temperaturze | TigerGene, USA | TG-TP-GS | Stosowane do utrzymania temperatury ciała myszy podczas operacji i rekonwalescencji |
| Rozieracz żebrowy | Shenzhen Huayon Biotech, Chiny | LN-18-4101 | Służy do rozdzielenia żeber i odsłonięcia serca w celu podwiązania LAD |
| Nożyczki | Shenzhen Huayon Biotech, Chiny | 18-0551 | Służy do wykonywania nacięć skóry i wycinania tkanek |
| Mikroskop stereoskopowy | Nikon, Japonia | SMZ 745 | Służy do zapewnienia powiększonego obrazu podczas operacji podwiązania tętnicy LAD |
| Mikrochirurgiczny uchwyt igłowy | Shenzhen Huayon Biotech, Chiny | 18-2211 | Służy do manipulowania małą igłą szewską 7-0 pod mikroskopem |
| Odczynniki i substancje chemiczne | |||
| Środki sprzęgające do ultrasonografii | Tianjin Jinya Technology Development, Chiny | TM-100 | Nakładany na klatkę piersiową podczas echokardiografii w celu zapewnienia odpowiedniego kontaktu głowicy |
| Paraformaldehyd | Sigma-Aldrich, USA | V900894 | Stosowane do utrwalania tkanki serca po pobraniu |
| Ksylen | Macklin, Chiny | 1330-20-7 | Stosowane do usuwania parafiny i przejrzyszczania tkanek przed barwieniem |
| Hematoksylina | Sigma-Aldrich, USA | H3136 | Barwnik jądrowy, stosowany w barwieniu H&E, |
| Eozyna | Sigma-Aldrich, USA | E4009 | Barwnik cytoplazmatyczny, stosowany w barwieniu HE, |
| Ponceau S | Sigma-Aldrich, USA | P3504 | Stosowany w barwieniu Massona do barwienia cytoplazmy |
| Kwas fosfomolibdowy | Sigma-Aldrich, USA | 221856 | Stosowane w barwieniu Massona jako zaprawa i do różnicowania |
| Roztwór błękitu anilinowego | Sigma-Aldrich, USA | 415049 | Stosowane w barwieniu Massona do wybarwiania włókien kolagenowych (na niebiesko) |
| przeciwciało CRACD | Absea, Chiny | KC-35356 | Przeciwciało pierwszorzędowe do wykrywania białka CRACD metodą Western Blot, rozcieńczenie 1:2000 |
| przeciwciało przeciwko GAPDH | CST, USA | 2118S | Przeciwciało do kontroli ładunku w Western Blot, rozcieńczenie 1:5000 |
| Etanol | Macklin, Chiny | 64-17-5 | Stosowany do dehydratacji i przygotowania odczynników (stężenia 70%, 80%, 95%, 100%) |
| Sprzęt laboratoryjny | |||
| Sorvall™ Legenda™ Wirówka Micro 17 | Thermo Scientific, USA | 75002541 | Stosowane do rutynowego przygotowania próbek |
| Termocykler do PCR | Bio-Rad Laboratories, USA | 1861096 | Stosowane do amplifikacji DNA |
| System mikroiniekcyjny | Eppendorf, Niemcy | 5193000020 | Stosowane do mikroiniekcji odczynników CRISPR/Cas9 do zygot |
| System obrazowania Vevo 2100 | VisualSonics, Kanada | Vevo2100 | System obrazowania wysokiej częstotliwości do nieinwazyjnej oceny funkcji i struktury serca po zawale mięśnia sercowego |
| Mikroskop świetlny | Leica, Niemcy | DM2500 | Stosowane do obserwacji przekrojów serca barwionych HE oraz metodą Massona |
| Oprogramowanie do analizy | |||
| ImageJ | National Institutes of Health, USA | / | Służy do analizy obrazów, w tym do pomiaru powierzchni, kwantyfikacji sygnału oraz przetwarzania obrazów histologicznych (barwienie HE i Massona) |
| VevoLab 3.2.0 / VevoStrain | VisualSonics, Kanada | / | Oprogramowanie VevoLab do analizy funkcji serca; moduł VevoStrain wykorzystywany do analizy odkształcenia mięśnia sercowego w celu oceny wydolności serca po zawale mięśnia sercowego |
| GraphPad Prism 8 | GraphPad Software, USA | / | Wykorzystywany do analizy statystycznej i przygotowywania wykresów |
Bibliografia
- Fauconnier J, Meli AC, Thireau J, Roberge S, Shan J, Sassi Y, et al. Ryanodine receptor leak mediated by caspase-8 activation leads to left ventricular injury after myocardial ischemia-reperfusion. Proc. Natl. Acad. Sci. U. S. A. 2011;108(32):13258-63.
- Cohn JN, Ferrari R, Sharpe N. Cardiac remodeling-concepts and clinical implications: a consensus paper from an international forum on cardiac remodeling. J Am Coll Cardiol. 2000.
- Liu D, Tian X, Liu Y, Song H, Cheng X, Zhang X, et al. CREG ameliorates the phenotypic switching of cardiac fibroblasts after myocardial infarction via modulation of CDC42. Cell Death Dis. 2021;12(4).
- Contessotto P, Pandit A. Therapies to prevent post-infarction remodelling: from repair to regeneration. Biomaterials. 2021;275.
- Zhu R, Sun H, Yu K, Zhong Y, Shi H, Wei Y, et al. Interleukin-37 and dendritic cells treated with interleukin-37 plus troponin I ameliorate cardiac remodeling after myocardial infarction. J Am Heart Assoc. 2016;5(12).
- Chang Y, Zhang J, Huo X, Qu X, Xia C, Huang K, et al. Substrate rigidity dictates colorectal tumorigenic cell stemness and metastasis via CRAD-dependent mechanotransduction. Cell Rep. 2022;38(7).
- Seo Y, Jang J, Ko KP, Zou G, Huang Y, Zhang S, et al. Actin dysregulation induces immune evasion via oxidative stress-activated PD-L1 in gastric cancer. bioRxiv. 2024.
- Kim B, Zhang S, Huang Y, Ko KP, Jung YS, Jang J, et al. CRACD loss induces neuroendocrine cell plasticity of lung adenocarcinoma. Cell Rep. 2024;43(6).
- Jung YS, Wang W, Jun S, Zhang J, Srivastava M, Kim MJ, et al. Deregulation of CRAD-controlled cytoskeleton initiates mucinous colorectal cancer via β-catenin. Nat Cell Biol. 2018;20(11):1303-14.
- Liu Z, Cao H, Shi Y, Yang R. KIAA1211 plays an oncogenic role in human non-small cell lung cancer. J Cancer. 2019;10(26):6747-53.
- Snider PL, Snider E, Simmons O, Lilly B, Conway SJ. Analysis of uncharacterized mKiaa1211 expression during mouse development and cardiovascular morphogenesis. J Cardiovasc Dev Dis. 2019;6(2).
- Lin YH, Warren CM, Li J, McKinsey TA, Russell B. Myofibril growth during cardiac hypertrophy is regulated through dual phosphorylation and acetylation of the actin capping protein CapZ. Cell Signal. 2016;28(8):1015-24.
- Yang FH, Pyle WG. Reduced cardiac CapZ protein protects hearts against acute ischemia-reperfusion injury and enhances preconditioning. J Mol Cell Cardiol. 2012;52(3):761-72.
- Tong C, Huang G, Ashton C, Wu H, Yan H, Ying QL. Rapid and cost-effective gene targeting in rat embryonic stem cells by TALENs. J Genet Genomics. 2012;39(6):275-80.
- Cordes SP. N-ethyl-N-nitrosourea mutagenesis: boarding the mouse mutant express. Microbiol Mol Biol Rev. 2005;69(3):426-39.
- Cong L, Ran FA, Cox D, Lin S, Barretto R, Habib N, et al. Multiplex genome engineering using CRISPR/Cas systems. Science. 2013;339(6121):819-23.
- Kanke KL, Rayner RE, Bozik J, Abel E, Venugopalan A, Suu M, et al. Single-stranded DNA with internal base modifications mediates highly efficient knock-in in primary cells using CRISPR-Cas9. Nucleic Acids Res. 2024;52(22):13561-76.
- Mihos CG, Liu JE, Anderson KM, Pernetz MA, O'Driscoll JM, Aurigemma GP, et al. Speckle-tracking strain echocardiography for the assessment of left ventricular structure and function: a scientific statement from the American Heart Association. Circulation. 2025;152(10).
- Garg PK, Biggs ML, Kizer JR, Shah SJ, Psaty B, Carnethon M, et al. Glucose dysregulation and subclinical cardiac dysfunction in older adults: the Cardiovascular Health Study. Cardiovasc Diabetol. 2022;21(1).
- Asanuma T, Fukuta Y, Masuda K, Hioki A, Iwasaki M, Nakatani S. Assessment of myocardial ischemic memory using speckle tracking echocardiography. JACC Cardiovasc Imaging. 2012;5(1):1-11.
- Chong SY, Zharkova O, Yatim SMJM, Wang X, Lim XC, Huang C, et al. Tissue factor cytoplasmic domain exacerbates post-infarct left ventricular remodeling via orchestrating cardiac inflammation and angiogenesis. Theranostics. 2021;11(19):9243-61.
- Hung CL, Verma A, Uno H, Shin SH, Bourgoun M, Hassanein AH, et al. Longitudinal and circumferential strain rate, left ventricular remodeling, and prognosis after myocardial infarction. J Am Coll Cardiol. 2010;56(22):1812-22.
- Labuhn M, Adams FF, Ng M, Knoess S, Schambach A, Charpentier EM, et al. Refined sgRNA efficacy prediction improves large- and small-scale CRISPR-Cas9 applications. Nucleic Acids Res. 2018;46(3):1375-85.
- Wu J, Bu L, Gong H, Jiang G, Li L, Ma H, et al. Effects of heart rate and anesthetic timing on high-resolution echocardiographic assessment under isoflurane anesthesia in mice. J Ultrasound Med. 2010;29(12).
- Voigt JU, Pedrizzetti G, Lysyansky P, Marwick TH, Houle H, Baumann R, et al. Definitions for a common standard for 2D speckle tracking echocardiography: consensus document of the EACVI/ASE/Industry Task Force to standardize deformation imaging. J Am Soc Echocardiogr. 2015;28(2):183-93.
- Port F, Chen HM, Lee T, Bullock SL. Optimized CRISPR/Cas tools for efficient germline and somatic genome engineering in Drosophila. Proc Natl Acad Sci U S A. 2014;111(29).
- Gao E, Lei YH, Shang X, Huang ZM, Zuo L, Boucher M, et al. A novel and efficient model of coronary artery ligation and myocardial infarction in the mouse. Circ Res. 2010;107(12):1445-53.
- Rösner A, Barbosa D, Aarsæther E, Kjønås D, Schirmer H, D'Hooge J. The influence of frame rate on two-dimensional speckle-tracking strain measurements: a study on silico-simulated models and images recorded in patients. Eur Heart J Cardiovasc Imaging. 2015;16(10):1137-47.
- Argiro A, Bui Q, Hong KN, Ammirati E, Olivotto I, Adler E. Applications of gene therapy in cardiomyopathies. JACC Heart Fail. 2024;12(2):248-60.
- Micheletti R, Plaisance I, Abraham BJ, Sarre A, Ting CC, Alexanian M, et al. The long noncoding RNA Wisper controls cardiac fibrosis and remodeling. Sci Transl Med. 2017;9(395).
- Wu Z, Yang H, Colosi P. Effect of genome size on AAV vector packaging. Mol Ther. 2010;18(1):80-6.
- Juliano RL. The delivery of therapeutic oligonucleotides. Nucleic Acids Res. 2016;44(14):6518-48.
Przedruki i uprawnienia
Ten artykuł został opublikowany
Film wkrótce dostępny