This study identifies an eight-gene macrophage polarization-related prognostic signature for multiple myeloma using integrated bioinformatics and machine learning. The model predicts survival, links risk groups to immune microenvironment features and drug sensitivity, and highlights candidate biomarkers for prognosis and potential therapeutic targeting.
Artykuł badawczy
Identification of Macrophage Polarization-Related Biomarkers in Multiple Myeloma Using Integrated Bioinformatics
* These authors contributed equally
W tym artykule
Podsumowanie
Streszczenie
Multiple myeloma (MM) is an incurable hematologic neoplasm with heterogeneous prognosis. Within the bone marrow microenvironment, macrophage polarization (MP) contributes to immune remodeling and may influence disease progression, yet MP-related prognostic biomarkers remain insufficiently characterized. In this study, we integrated transcriptomic data from UCSC Xena (n = 844) and GSE4581 (n = 414) to identify differentially expressed genes between immune-hot and immune-cold MM samples stratified by single-sample gene set enrichment analysis (ssGSEA)-derived immune scores. Weighted gene co-expression network analysis (WGCNA) and intersection with published MP-related genes yielded candidate genes, which were further refined using univariate Cox regression combined with least absolute shrinkage and selection operator (LASSO), eXtreme gradient boosting (XGBoost) and support vector machine recursive feature elimination (SVM-RFE) machine learning algorithms to construct a prognostic model. An eight-gene signature (LGALS3, IL2RG, ADAM8, MERTK, ACSS1, ARSK, CBX6 and SOCS3) was established, demonstrating acceptable discriminatory ability for 1-, 2-, and 3-year overall survival (AUC 0.666–0.736 in training cohort). Risk groups differed significantly in immune infiltration patterns, predicted drug sensitivity, and survival outcomes. A predicted competing endogenous RNA (ceRNA) network centered on MERTK and SOCS3 was also constructed. These findings identify eight MP-related hub genes as candidate prognostic biomarkers and provide a risk model with acceptable predictive performance, offering insights into the immune-metabolic interplay in MM and suggesting potential avenues for personalized therapeutic strategies.
Wprowadzenie
Multiple myeloma (MM) is an incurable hematologic neoplasm accompanied by the unchecked expansion of malignant plasma cells and excessive production of monoclonal immunoglobulins1. These pathological features frequently culminate in significant end-organ impairment, such as complications arising from bone marrow failure2. Despite substantial therapeutic advances in the last twenty years, the epidemiological burden of MM continues to rise, posing a growing public health challenge3,4,5,6. Consequently, new therapeutic approaches that enhance prognostic evaluation and patient care for MM are urgently required.
Macrophage polarization (MP) refers to the acquisition of distinct functional phenotypes by macrophages in response to microenvironmental signals, thereby influencing tumor cell behavior and shaping the tumor microenvironment (TME), with important implications for disease progression7. Within the bone marrow niche, tumor-associated macrophages (TAMs) have emerged as key regulators of MM biology8,9. Macrophages exhibit functional plasticity, with classically activated M1-type macrophages widely recognized for their pro-inflammatory properties and antitumor activity10. Alternatively activated M2-type macrophages share phenotypic and functional characteristics with TAMs and can promote tumor progression, immune evasion, and resistance to immunotherapy11. Extensive research has elucidated the molecular underpinnings of this phenotypic shift12. For instance, molecular regulators such as IRF4, STAT6, and PPARγ contribute to M2 polarization and activate transcriptional programs involved in tissue remodeling and immune suppression13. In MM, TAMs have also been reported to mediate drug resistance through cytokine-induced survival signaling and cell-contact-mediated exosomal transfer of pro-survival miRNAs14,15. Although increasing evidence supports a close relationship between MP and MM progression, the prognostic implications of MP-related transcriptional programs remain insufficiently characterized. Therapeutic strategies targeting TAM recruitment, polarization, or immunosuppressive mediators have shown promise in preclinical studies16,17,18,19. However, it remains unclear which MP-related genes are most relevant to MM prognosis and how these genes are associated with immune microenvironmental features and predicted therapeutic sensitivity.
In the present study, we integrated public transcriptomic datasets to identify differentially expressed MP-related genes in MM. From this, a prognostic model was formulated and subsequently validated. Additionally, we investigated the associations between the risk score, TME characteristics, and predicted drug sensitivity. These findings may provide useful insights into the prognostic assessment of MM and support further exploration of MP-related biomarkers as potential therapeutic targets.
Protokół
This study was based exclusively on publicly available datasets and did not involve any newly collected human samples or direct patient participation. Therefore, ethics approval and informed consent were not required.
Data acquisition and preprocessing
Transcriptomic expression profiles and corresponding clinical data of MM patients were obtained from the UCSC Xena Browser (https://xenabrowser.net/datapages/?cohort=GDC%20MMRF-COMMPASS&removeHub=https://xena.treehouse.gi.ucsc.edu:443) and the GEO database. Initially, 859 MM bone marrow samples with RNA-seq data and clinical survival information were retrieved from the UCSC Xena source. To ensure the accuracy of prognostic analysis and reduce potential bias from non-tumor-related deaths or incomplete follow-up, we excluded 15 cases with overall survival (OS) < 30 days, leaving 844 samples with complete survival information that were used as the training set. The GSE4581 dataset was retrieved from the GEO database as an independent validation set and included 414 MM bone marrow samples with available clinical and survival information. For this validation set, the raw expression data were first log2 transformed, and then independently quantile normalized across samples using the ‘normalizeBetweenArrays’ function from the limma package. Importantly, this normalization was performed solely based on the expression distribution of the validation set itself, without using the mean or standard deviation from the training set, in order to simulate real clinical scenarios where the model would be applied to a completely new independent dataset. All samples in both cohorts were collected at the time of initial diagnosis prior to any therapeutic intervention. For microarray data, probes were annotated to gene symbols, and if several probes corresponded to the same gene, the probe with the highest median expression was selected. Expression values were log2-transformed when necessary. To reduce platform-related scale differences and ensure that the validation set reflects independent application, the expression values of the model genes were standardized separately for the training and validation cohorts; for the validation cohort, only its own normalization‑derived values were used, without borrowing any parameters from the training set. Furthermore, a list of 776 MP-related genes (Supplementary Table 1) was obtained from a prior study20. The overall workflow of this study is illustrated in Figure 1.
Immune infiltration analysis based on ssGSEA
Enrichment scores for individual MM specimens were computed via single-sample gene set enrichment analysis (ssGSEA). For survival analysis, samples were dichotomized using an optimal cutoff value of 0.453, which was determined to maximize the survival differences between the groups. Samples were assigned to the high immune infiltration (Hot) or low immune infiltration (Cold) group according to the ssGSEA-derived immune score. Kaplan-Meier curves together with log-rank testing were used to compare survival differences between the two groups21.
Differential expression gene screening and functional enrichment analysis
Differential expression analysis between immune-hot and immune-cold MM samples was performed with the limma package in R. Genes exhibiting an adjusted P-value < 0.05 and an absolute log2 fold change > 0.2 were regarded as differentially expressed; a positive log2FC denoted elevated expression in the immune-hot group. Associations between candidate MP-related genes and immune infiltration scores were evaluated using Spearman correlation analysis. Multiple testing was controlled by the Benjamini-Hochberg false discovery rate (FDR) procedure. To investigate the enrichment of biological processes and signaling pathways of MM, Gene Ontology (GO) and Kyoto Encyclopedia of Genes and Genomes (KEGG) analysis were performed with clusterProfiler22.
Weighted gene co-expression network analysis and identification of immune score-associated modules
The weighted gene co-expression network analysis (WGCNA) was conducted on the MM transcriptome data to discover co-expression modules related to immune infiltration23. Low-abundance genes were filtered out using a mean expression cutoff of < 7 to remove genes with limited dynamic range and reduce noise before network construction. The soft-thresholding parameter β was determined according to the scale-free topology assumption, with the fit index required to be above 0.85. The resulting adjacency matrix was subsequently transformed into a topological overlap matrix (TOM). Co-expression modules were detected with dynamic tree cutting using a minimum module size of 150 genes to ensure statistical robustness of each module, and modules with highly correlated eigengenes were merged at a merge cut height of 0.2, corresponding to an eigengene correlation of 0.8 to merge highly similar modules while preserving biologically distinct co-expression patterns. Module eigengenes were correlated with ssGSEA-derived immune infiltration scores and immune-hot/cold status to identify immune infiltration-related modules. The module-trait heatmap was used to visualize these associations and to select the module most strongly associated with immune infiltration. Genes from this module were subsequently intersected with differentially expressed genes (DEGs) and MP-related genes for downstream hub-gene screening.
Machine learning for hub gene screening and prognostic model construction
To identify prognostic genes in MM and construct a predictive model, we employed a multi-step analytical framework integrating univariate Cox regression, LASSO regression, SVM, and XGBoost algorithms. Notably, the primary prognostic model was constructed exclusively using the immune-hot subgroup, which comprised 739 samples, to specifically capture MP-related signals within the immune-infiltrated microenvironment. Univariate Cox regression was then applied to these 739 samples to screen for survival-associated candidate genes with a significance threshold of P < 0.05. To mitigate overfitting, we performed 10-fold cross-validation during the LASSO and SVM-RFE steps. The LASSO algorithm was applied to perform a more rigorous screening, using the regularization term to remove genes with zero coefficients in order to reduce model complexity and improve interpretability. Subsequently, we used the XGBoost algorithm to rank the importance of the candidate prognostic genes and visualized the importance rankings of these genes. The parameter settings for XGBoost were as follows: nrounds = 100, max_depth = 3, subsample = 0.8, colsample_bytree = 0.8. Then, we performed feature selection using the rfe function in the SVM algorithm to identify the optimal subset of features from various combinations ranging from 1 to 18 features. For SVM-RFE, we used a linear kernel with 10-fold cross-validation to select the optimal feature subset. Genes consistently selected by the three algorithms were retained as hub genes. A multivariate Cox proportional hazards model was then fitted to derive individual risk scores. Patients were subsequently categorized into high- and low-risk strata according to an optimal cutoff obtained from log-rank statistics. This cutoff was estimated only in the training cohort and was applied directly to the external validation cohort. Variable selection was performed via bidirectional stepwise regression employing the Akaike Information Criterion (AIC). A nomogram was generated with the regplot package to support individualized risk estimation. Points assigned to each variable were summed to obtain total points, which were mapped to predicted 1-, 2-, and 3-year OS probabilities. Predictive discrimination was assessed by time-dependent ROC curves, and AUC values were calculated for 1 year, 2 years, and 3 years. Calibration curves were also used to evaluate agreement.
SHAP analysis
Shapley Additive Explanations (SHAP) analysis interpreted the contribution of hub genes to the predictions of the Cox regression model24. Specifically, SHAP values quantified the influence of individual genes on the Cox model-derived linear predictor or risk score. SHAP analysis was performed using the ‘additive_shap’ function implemented in the ‘shapviz’ R package. Core prognostic genes were ordered according to their mean absolute SHAP values in the training cohort. Summary, dependence, and interaction plots were generated to illustrate gene-level contributions and potential interaction patterns.
Single-gene GSEA
Single-gene GSEA was conducted to examine pathways associated with each hub gene. For each hub gene, Spearman coefficients between its expression level and other genes in the expression matrix were calculated. Genes were ranked by the corresponding correlation coefficients, and KEGG pathway enrichment was performed with clusterProfiler. The top pathways ranked by the absolute value of the normalized enrichment score were visualized.
Drug sensitivity analysis and competing endogenous RNA (ceRNA) regulatory network
Drug sensitivity was evaluated by integrating MM risk groups with response data from the Genomics of Drug Sensitivity in Cancer (GDSC) database. Candidate miRNAs targeting the core prognostic genes were predicted using both the miRanda and miRDB databases. Only miRNA–mRNA interactions predicted by both databases were retained. The oncoPredict package was employed to predict drug sensitivity, and specifically, the calcPhenotype function was used to estimate the half-maximal inhibitory concentration (IC50) values of 198 drugs for each MM sample. This function applies a ridge regression model trained on the GDSC drug response data, and the resulting output is a Box-Cox transformed predictive sensitivity score, which was then used to derive IC50 estimates for subsequent comparisons. Additionally, we used the Wilcoxon rank sum test to investigate the differences in IC50 between the high- and the low-risk groups. P values from the 198 comparisons were adjusted by the Benjamini-Hochberg method. Drugs with FDR < 0.05 were considered significantly different between risk groups. To explore upstream regulatory mechanisms, candidate miRNAs were further integrated with long non-coding RNAs retrieved from the StarBase database, with cross-linking and immunoprecipitation (CLIP) support values > 10. Predicted ceRNA interactions were further filtered by expression correlation analysis. Only lncRNA-mRNA pairs with positive correlation and miRNA-mRNA pairs with negative correlation were retained. The final lncRNA-miRNA-mRNA regulatory network was visualized using the ggalluvial R package.
Statistical analysis
Statistical analyses and visualization procedures were performed in statistical computing software. Data normality was examined using the Shapiro-Wilk test; normally distributed variables were analyzed with Student’s t-test, whereas non-normal variables were compared using the Wilcoxon rank-sum test. Spearman correlation analysis was used for continuous variables. When multiple comparisons were performed, P values were adjusted using the Benjamini-Hochberg FDR method, including DEG screening, enrichment analyses, drug-sensitivity comparisons, and correlation analyses. A two-sided P value or FDR < 0.05 was considered statistically significant.
Wyniki
Immune infiltration analysis based on ssGSEA and identification of differential expression genes
To describe immune heterogeneity in MM, ssGSEA-derived immune infiltration scores were used to stratify patients into immune-hot and immune-cold groups. The immune infiltration scores showed a continuous distribution across samples. The cutoff value of 0.453 classified 739 samples as immune-hot and 105 as immune-cold (Figure 2A). Kaplan-Meier survival analysis showed a significant overall-survival difference between the two groups (log-rank p = 0.039, Figure 2B); the median overall survival was notably longer in the immune-hot group compared to the immune-cold group. The immune-hot group exhibited markedly higher immune infiltration scores than the immune-cold group (p < 2 × 10-16, Figure 2C). The immune cell infiltration heatmap showed distinct immune infiltration patterns between the two groups, with several immune-cell populations enriched in the immune-hot group (Figure 2D). Specifically, activated CD8⁺ T cells, NK cells, and M1-type macrophages were more abundant in the immune-hot group, while MDSCs and regulatory T cells showed relatively higher proportions in the immune-cold group.
To define transcriptomic features associated with immune status, gene expression profiles were compared between the two groups. A total of 1,879 DEGs were identified, including 889 upregulated and 990 downregulated genes. The DEG expression heatmap and volcano plot are shown in Figures 2E,F, respectively. These DEGs provide a molecular basis for further investigating immune phenotype-associated regulatory mechanisms in MM.
WGCNA analysis of key genes in MM
To identify co-expression modules associated with immune infiltration, WGCNA was applied to the MM transcriptome. After filtering low abundance genes, 10,255 genes were retained for subsequent analysis. The optimal soft-thresholding power was selected in Figure 3A. Modules with highly correlated eigengenes were then merged, but the number of modules remained 14 (Figure 3B). Gene clustering and module assignment were performed in Figure 3C, resulting in 14 modules. Module-trait correlation analysis showed that the pink module was significantly positively correlated with the immune score (r = 0.31, p < 0.001; Figure 3D). In addition, module membership in the pink module was positively correlated with the immune score (cor = 0.67, p < 1 × 10-200; Figure 3E). The pink module contained 4,165 genes and was selected as the key immune score-associated module for subsequent hub gene screening.
Functional analysis of MP-related genes in MM
To obtain MP-related genes linked to the immune phenotype of MM, immune phenotype-related DEGs, genes in the pink WGCNA module, and 776 published MP-related genes were intersected. This yielded 33 candidate genes (Figure 4A). Functional enrichment analysis showed that these genes were mainly enriched in immune activation, leukocyte cell-cell adhesion, inflammatory response, lymphocyte proliferation, and lymphocyte differentiation (Figure 4B,C). Regarding the KEGG analysis, the most prominent pathways included B-cell receptor signaling pathway, rheumatoid arthritis, and osteoclast differentiation (Figure 4D,E). These enriched pathways suggest that the identified genes may be involved in immune regulation and MM-related microenvironmental processes.
Identification of hub genes via machine learning
To screen prognostically relevant MP-related genes, 33 candidate genes were evaluated in the immune-hot subgroup. Eighteen prognosis-related genes were identified, indicating significant associations between gene expression levels and patient outcomes (Figure 5A). These 18 genes were then subjected to three machine learning algorithms for further refinement. The intersection of genes selected by LASSO (Figures 5B,C), XGBoost (Figure 5D), and SVM-RFE (Figure 5E,F) yielded nine candidate MP-related prognostic hub genes: IL23A, LGALS3, IL2RG, ADAM8, MERTK, ACSS1, ARSK, CBX6, and SOCS3 (Figure 5G).
Construction of an MP-related prognostic risk model in MM
To establish an MP-related prognostic signature, the nine candidate genes were entered into a multivariate Cox proportional hazards regression model. During the stepwise regression process, IL23A was excluded according to the AIC-based model selection procedure. The remaining eight genes showed independent prognostic relevance and were used to build the final risk model. The corresponding regression coefficients for each gene are presented in Table 1. The formula was as follows: RiskScore = (0.1357 × expression value of LGALS3) + (- 0.2088 × expression value of IL2RG) + (0.1855 × expression value of ADAM8) + (- 0.2199 × expression value of MERTK) + (- 0.3399 × expression value of ACSS1) + (0.4926 × expression value of ARSK) + (0.1356 × expression value of CBX6) + (0.0568 × expression value of SOCS3).
To evaluate the prognostic stratification ability of the risk model, patients were classified into high- and low-risk groups using the cutoff derived from the training cohort. Low-risk patients had significantly better survival than high-risk patients in both the training set (p < 0.001) and the validation set (p = 0.023) (Figure 6A,B). Age-stratified analysis demonstrated that patients in the low-risk group had superior survival among patients aged ≤ 60 years (p = 0.001) and > 60 years (p < 0.001) (Figure 6C,D). Stage-stratified analysis showed significant survival differences in stage II and III patients (both p < 0.05), whereas the difference in stage I patients did not reach statistical significance (Figure 6E–G). Single-gene survival analyses also showed that LGALS3, IL2RG, ADAM8, MERTK, ACSS1, ARSK, CBX6, and SOCS3 were individually associated with overall survival in the training cohort (Figure 6H–O).
SHAP analysis of the prognostic signature
To further interpret the contribution of each hub gene to the prognostic model, we performed SHAP analysis based on the multivariate Cox regression model. The mean absolute SHAP values were calculated to rank the feature importance of the eight prognostic genes. The bar plot revealed that ARSK ranked first in global importance, followed by ACSS1, MERTK, and LGALS3 (Supplementary Figure 1). The bee swarm plot further illustrated the direction and magnitude of each gene’s contribution to the risk score. Specifically, high expression levels of ARSK, ADAM8, SOCS3, LGALS3, and CBX6 were predominantly associated with positive SHAP values (dense yellow points on the right side), indicating that elevated expression of these five genes contributed to higher risk scores. In contrast, high expression of MERTK, ACSS1, and IL2RG was predominantly associated with negative SHAP values, suggesting that increased expression of these three genes was linked to lower risk scores. These findings collectively indicate that ARSK, ADAM8, SOCS3, LGALS3, and CBX6 function as risk associated genes, whereas MERTK, ACSS1, and IL2RG may serve as protective factors within the prognostic signature of MM.
Construction and validation of prognostic nomogram based on hub genes
A nomogram was constructed based on the eight hub genes included in the multivariate Cox model (Figure 7A). Time-dependent ROC analysis showed that the AUC values for predicting 1-, 2-, and 3-year overall survival were 0.666, 0.736, and 0.725 in the training cohort (Figure 7B), and 0.706, 0.696, and 0.704 in the validation cohort (Figure 7C). Calibration curves showed good agreement between predicted and observed survival probabilities (Figure 7D,E). Single-gene GSEA further indicated that the eight prognostic genes were associated with metabolic reprogramming, cell cycle regulation, and immune responses. For example, ACSS1 was positively associated with pathways such as ascorbate metabolism, folate transport and metabolism, propanoate metabolism, N-glycan biosynthesis, and butanoate metabolism, while showing negative associations with cellular senescence, cell cycle, Toll-like receptor signaling, GABAergic synapse, and morphine addiction. Detailed results for LGALS3, IL2RG, ACSS1, and SOCS3 are shown in Figure 7F–I, and results for the other genes are shown in Supplementary Figure 2.
Drug sensitivity analysis and CeRNA regulatory network in MM
The top 10 drug-response entries, representing nine unique compounds, showed marked differences between risk groups (Figure 8A). Taselisib_1561, Pictilisib_1058, SB505124_1194, AZD8186_1918, Oxaliplatin_1089, Daporinad_1248, Oxaliplatin_1806, GSK269962A_1192, and Dactinomycin_1811 had lower predicted IC50 values in the low-risk group, suggesting computationally predicted higher sensitivity (p < 0.001). The high-risk group demonstrated computationally predicted significantly enhanced sensitivity to AZD6738_1917, as evidenced by significantly lower IC50 values relative to the low-risk group (p < 0.001). To explore potential computationally predicted upstream regulatory mechanisms of the hub genes, miRNA and lncRNA interactions were integrated to construct a ceRNA network. MERTK, IL2RG, and SOCS3 had overlapping predicted miRNAs, and after further filtering, six miRNAs and 14 lncRNAs were retained. The final Sankey diagram included MERTK and SOCS3, whereas IL2RG was not included because no eligible lncRNA-miRNA-IL2RG axis remained under the predefined criteria (Figure 8B,C). These results provide a computationally predicted ceRNA regulatory network centered on MERTK and SOCS3, but these predicted interactions require further validation by expression correlation analysis and experimental studies.
DATA AVAILABILITY:
The datasets analyzed in this study are publicly available from the following repositories: (1) UCSC Xena Browser (https://xenabrowser.net), accessing the GDC MMRF-COMMPASS cohort (downloaded on December 3, 2025); and (2) Gene Expression Omnibus (GEO) under accession number GSE4581 (https://www.ncbi.nlm.nih.gov/geo/query/acc.cgi?acc=GSE4581) (downloaded on December 25, 2025). All the code for this study is available at https://doi.org/10.5281/zenodo.22044469.
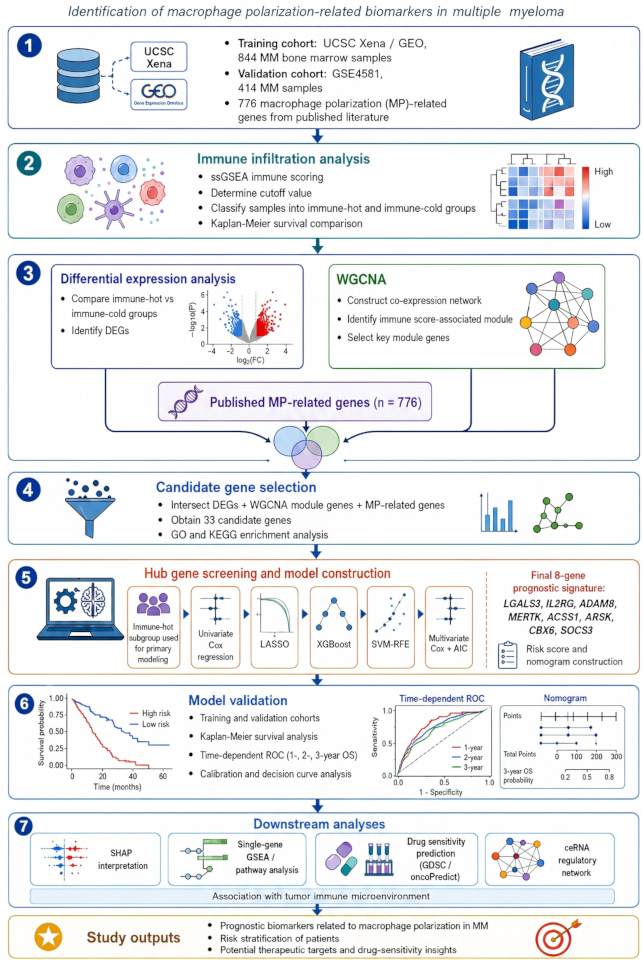
Figure 1: A schematic representation of the workflow. The workflow summarizes data acquisition and preprocessing, immune-infiltration analysis, differential-expression and WGCNA analyses, candidate-gene screening, machine-learning-based prognostic model construction, model validation, and downstream SHAP, enrichment, drug-sensitivity, and ceRNA analyses. Please click here to view a larger version of this figure.
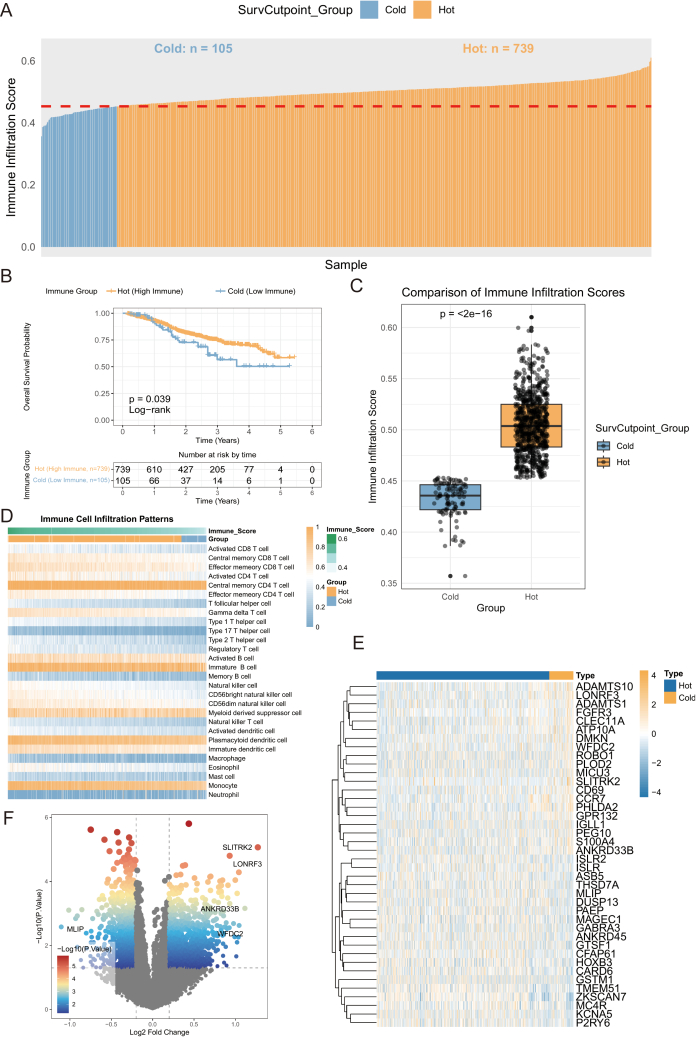
Figure 2: Immune infiltration analysis based on ssGSEA and identification of differentially expressed genes. (A) Distribution of immune infiltration scores; (B) Overall survival analysis of immune infiltration status; (C) Distribution difference of immune infiltration scores between immune-hot and immune-cold groups; (D) Infiltration patterns of different immune cell types; (E) Heatmap of DEGs; (F) Volcano plot of DEGs. Please click here to view a larger version of this figure.
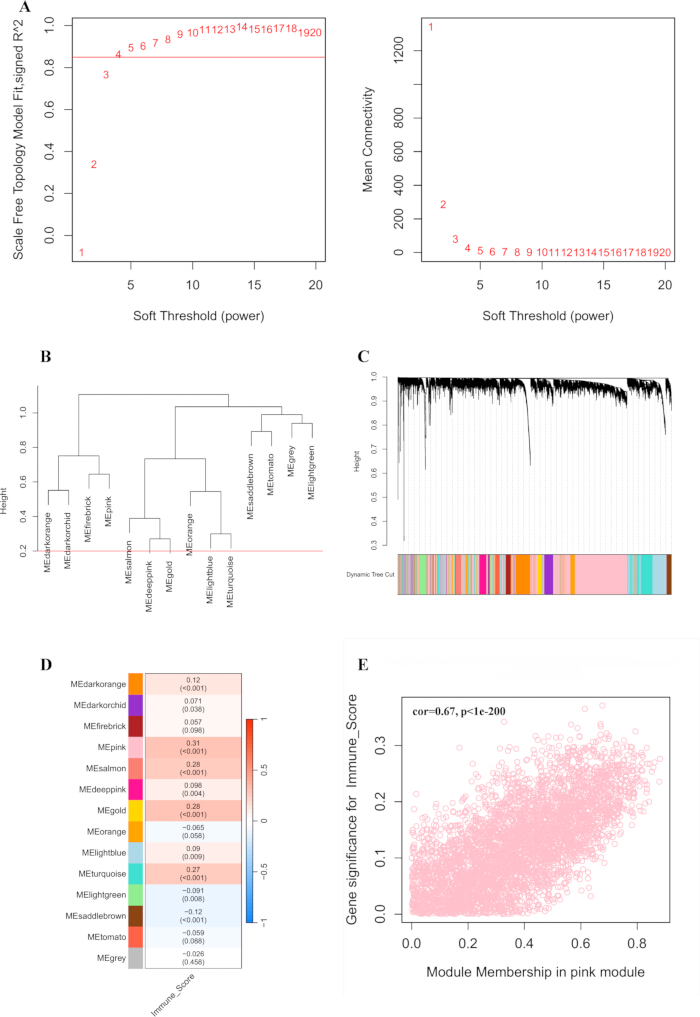
Figure 3: WGCNA analysis of key genes in MM. (A) Selection of the optimal soft-thresholding power β based on the scale-free topology fit index and mean connectivity; (B) Clustering dendrogram of module eigengenes used for module merging; (C) Gene-clustering dendrogram showing module assignments, where branch length reflects dissimilarity and colors indicate individual modules; (D) Heat map of the correlation between modules and traits; (E) Scatter plot illustrating the association between gene significance for immune score and module membership in the pink module. Please click here to view a larger version of this figure.
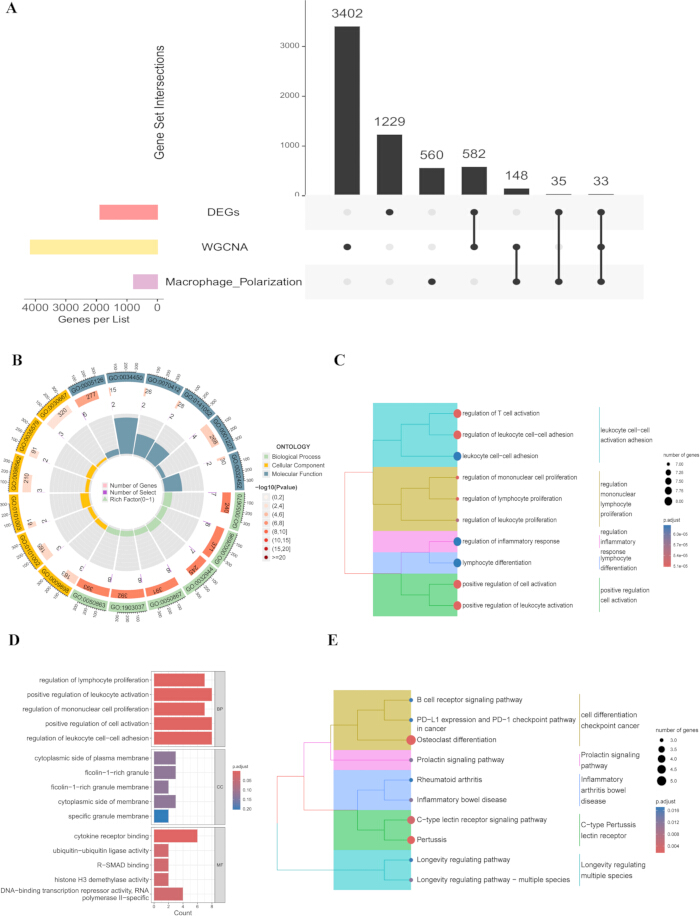
Figure 4: Functional enrichment analysis. (A) Screening of tumor immune-related macrophage polarization genes; (B) GO network diagram; (C) GO enrichment cluster dendrogram; (D) KEGG bar chart; (E) KEGG enrichment cluster dendrogram. Please click here to view a larger version of this figure.
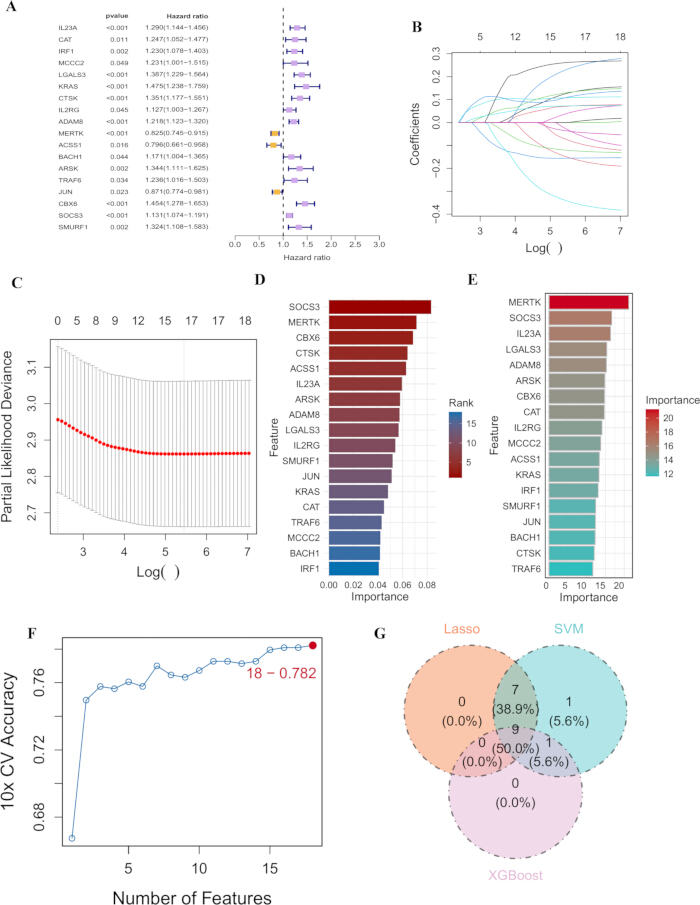
Figure 5: Identification of hub genes via machine learning. (A) Forest plot of univariate Cox regression analysis; (B) Feature selection using LASSO regression; (C) Cross-validation curve of LASSO regression; (D) XGBoost feature importance; (E) SVM-RFE feature ranking; (F) SVM-RFE cross-validation accuracy; (G) Venn diagram showing the intersection of genes selected by LASSO, SVM-RFE, and XGBoost. Please click here to view a larger version of this figure.
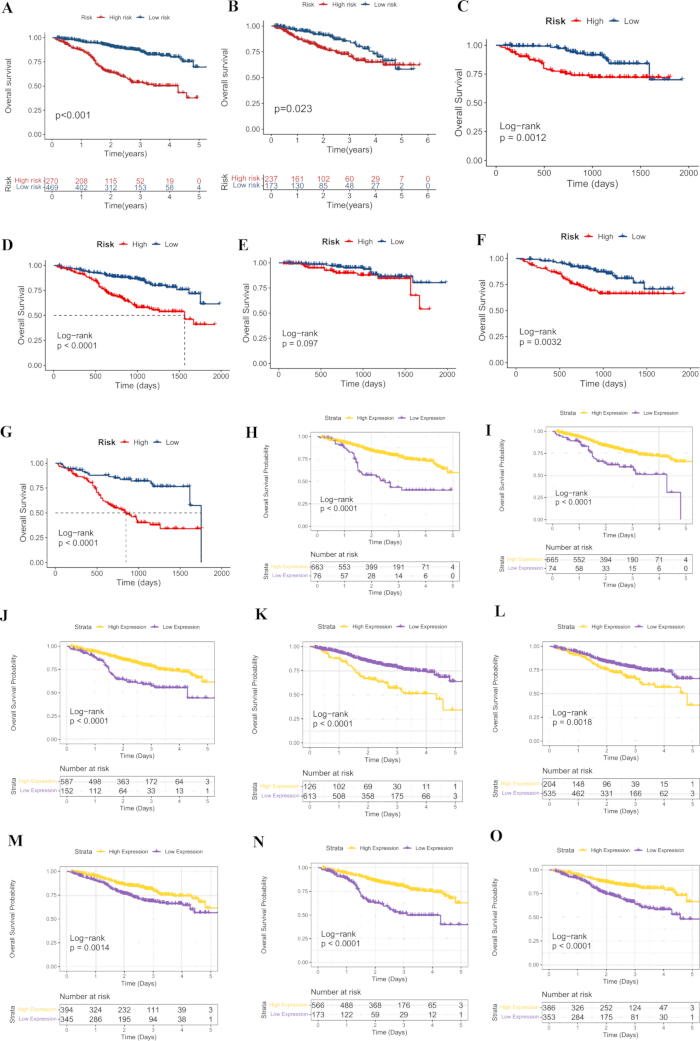
Figure 6: Construction of the risk prediction model for DEGs of macrophage polarization. (A) Kaplan-Meier survival curve of training set; (B) validation set; (C) aged ≤ 60 years; (D) aged > 60 years; (E) patients with stage I MM; (F) Kaplan-Meier survival curve of patients with stage II MM; (G) patients with stage III MM; (H–O) Kaplan-Meier survival curves of LGALS3, IL2RG, ADAM8, MERTK, ACSS1, ARSK, CBX6 and SOCS3. Please click here to view a larger version of this figure.
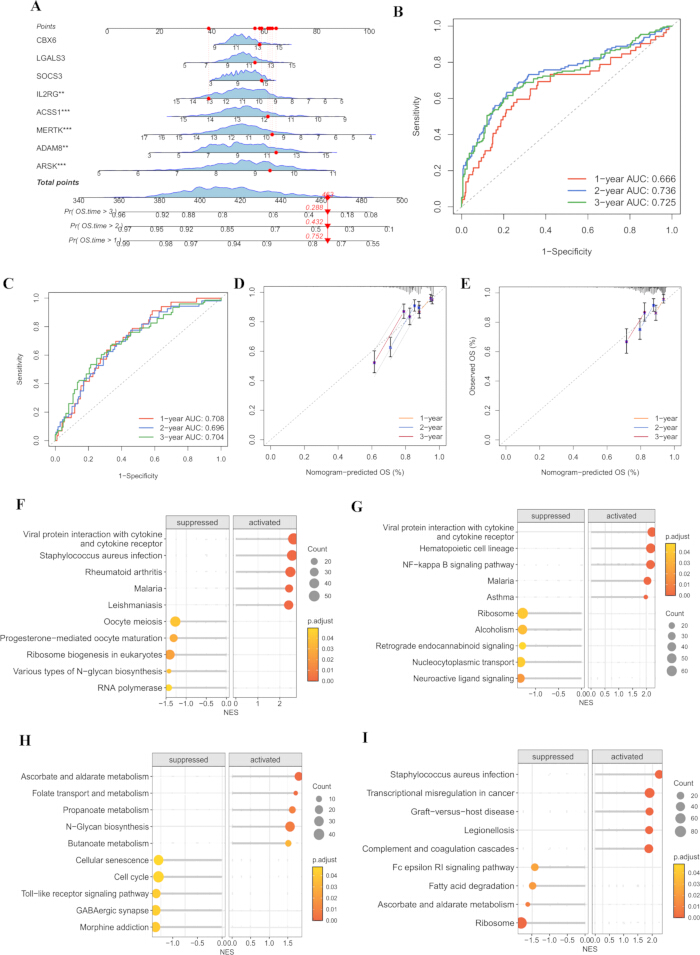
Figure 7: Construction, validation, and functional characterization of the prognostic model based on hub genes. (A) Nomogram based on the eight prognostic genes; (B) ROC curve shows the prediction performance of 1-year, 2-year, and 3-year OS in the training set; (C) and the validation set; (D) Calibration curves of the actual survival rates in the training set; (E) and the validation set at 1-year, 2-year, and 3-year; (F-I) The X-axis represents the standardized enrichment score after correction, and the Y-axis represents the enriched signaling pathways. Single-gene GSEA was performed on LGALS3 (F); IL2RG (G); ACSS1 (H), and SOCS3 (I). Please click here to view a larger version of this figure.
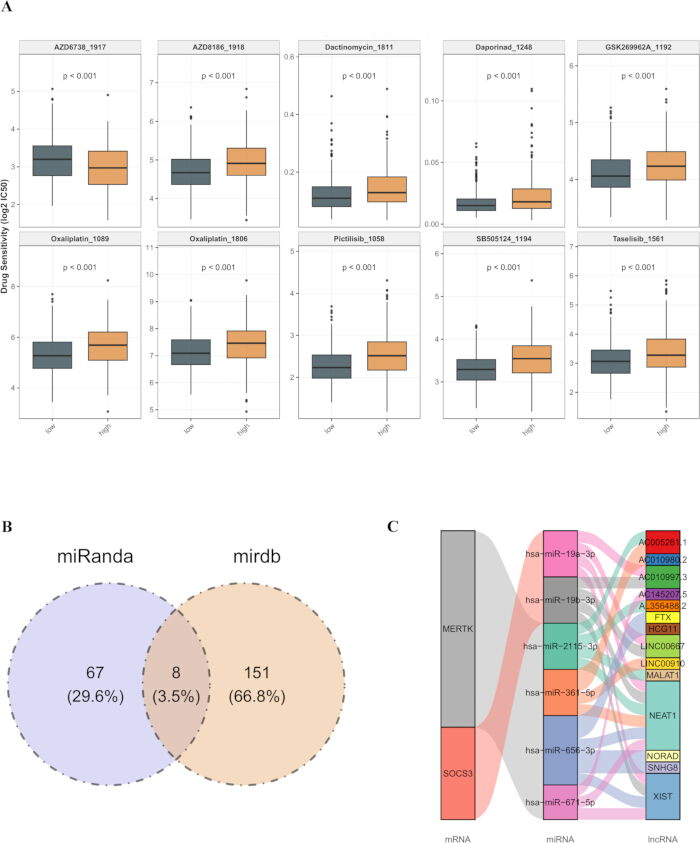
Figure 8: Drug sensitivity analysis and CeRNA regulatory network. (A) The top 10 drug-response entries, representing nine unique compounds, sensitivity analysis by risk group. Comparison of IC50 values of multiple drugs between risk groups. Each box plot represents a drug, and the difference in IC50 between the two groups is distinguished by orange (high-risk group) and grey-green (low-risk group). The p-value indicates the difference in drug sensitivity between the two groups; (B) Venn diagram showing the predicted miRNA targets; (C) Sankey diagram of the lncRNA-miRNA-mRNA regulatory network. Please click here to view a larger version of this figure.
| Gene | Coefficients |
| LGALS3 | 0.1357 |
| IL2RG | -0.2088 |
| ADAM8 | 0.1855 |
| MERTK | -0.2199 |
| ACSS1 | -0.3399 |
| ARSK | 0.4926 |
| CBX6 | 0.1356 |
| SOCS3 | 0.0568 |
Table 1: Multivariate cox regression analysis of prognostic genes. Regression coefficients used to calculate the individual risk score are provided for each prognostic gene.
Supplementary Figure 1: SHAP analysis of the eight-gene prognostic signature including ARSK, ADAM8, SOCS3, LGALS3, CBX6, MERTK, ACSS1, and IL2RG. (A) Bar chart; (B) Bee swarm chart. Please click here to download this file.
Supplementary Figure 2: Enrichment analysis of ADAM8, MERTK, ARSK and CBX6. The X-axis represents the standardized enrichment score after correction, and the Y-axis represents the enriched signaling pathways. Single-gene GSEA was performed on ADAM8, MERTK, ARSK and CBX6. Please click here to download this file.
Supplementary Table 1: MP-related genes included in the study. The table lists the 776 MP-related genes used in the study. Please click here to download this file.
Dyskusja
MM is profoundly shaped by the establishment and evolution of its surrounding TME25. MP is involved in immune regulation, tissue damage, and repair, and inflammatory mediators produced by polarized macrophages can influence the TME26. Nevertheless, the exact molecular pathways through which MP contributes to the pathogenesis of MM remain largely unknown and require further investigation. The present investigation successfully identified a panel of 8 prognosis-related genes closely related to the immunomodulation of MM. Notably, our risk model effectively stratified survival within stage II and III patients, suggesting that it may capture additional prognostic heterogeneity beyond conventional ISS staging. This indicates a potential complementary role for the MP-related signature alongside established clinical stratification systems. To systematically elucidate their biological roles, we categorized these genes into three functional modules based on their primary mechanisms of action in the MM microenvironment: (1) direct drivers of immunosuppression, (2) metabolic-immune cross-talk mediators, and (3) regulators of lymphoid development and tumor suppression.
LGALS3 is associated with tumor immune escape and inflammation regulation27. Based on previous reports, LGALS3 has been associated with immunosuppressive functions through potential pathways. For instance, one study suggested that LGALS3 may induce TAM polarization toward an M2-like phenotype, possibly involving PPARγ and downstream M2-associated genes28. LGALS3 acts as a soluble ligand that cross-links surface receptors on T cells, triggering apoptosis and suppressing effector functions29. Our data further showed that LGALS3 expression was negatively correlated with immune infiltration scores, consistent with these reported immunosuppressive functions. Moreover, high ADAM8 expression levels have been confirmed as a prognostic marker independent of high-risk abnormalities, which is consistent with our results30,31. The pro-tumorigenic mechanism of ADAM8 enhances the survival and expansion of MDSCs and Tregs32,33. At the molecular level, SOCS3 functions as a classic negative feedback regulator34. It binds to phosphorylated JAK2 via its SH2 domain and targets the receptor complex for proteasomal degradation through its SOCS box35,36. Consistent with its role as a suppressor of inflammatory signaling, SOCS3 expression in our cohort correlated with reduced immune cell infiltration. MERTK expressed on macrophages recognizes phosphatidylserine exposed on apoptotic cells, triggering efferocytosis and the subsequent release of anti-inflammatory cytokines, further promoting M2 polarization37,38. These genes may play a vital role in promoting immunosuppression and provide a basis for the immune escape of MM. ACSS1 is involved in multiple metabolic pathways, supporting the high energy demands of proliferating tumor cells, while being inversely correlated with immune-related pathways39,40,41,42. In our study, ACSS1 expression showed a positive correlation with immune score, suggesting that its metabolic activity may support rather than suppress anti-tumor immunity in the MM context. ARSK is one of the key genes in lipid metabolism-related risk models43. Prior studies have revealed that expression of ARSK is negatively related to the infiltration degree of activated CD8+ T cells and natural killer T cells, suggesting it may regulate immune cell mobilization44,45,46. Currently, studies on IL2RG mainly focus on primary immunodeficiencies and hematologic malignancies such as acute myeloid leukemia47,48. Its reduction can lead to the apoptosis of effector lymphocytes, thereby weakening the anti-tumor immune response49. CBX6 inhibits gene transcription through epigenetic mechanisms, maintains the functions of M1-type macrophages and CD8+ T cells, thereby exerting tumor suppression effects50,51.
Immune infiltration revealed that the immune score was markedly diminished in the cohort stratified as high-risk relative to their low-risk counterparts. This finding suggests a reduction in both immune and stromal cell populations within the TME of patients classified within the high-risk category. Meanwhile, the proportion of anti-tumor effector cells significantly decreased. The ssGSEA analysis confirmed that the gene sets related to immunosuppression showed a significant enrichment in the high-risk cohort, including the TGF-β signaling pathway, IL-10 signaling pathway, and angiogenesis. As a key factor in lymphocyte development, IL2RG demonstrated a positive relation to CD8+ T cells and NK cells abundance52. Downregulation of IL2RG in the high-risk group might explain the phenomenon of reduced effector lymphocyte infiltration. ARSK, as a metabolic-related gene, exhibited negative associations with immune score, revealing that metabolic reprogramming might synergistically act on the formation of the immunosuppressive microenvironment. CBX6 demonstrated positive correlations with M1-type macrophages and CD8+ T cells, which were consistent with its function as a potential tumor suppressor.
The drug sensitivity analysis suggested that low-risk patients were computationally predicted to be more sensitive to several compounds, including Taselisib, Pictilisib, SB505124, AZD8186, oxaliplatin, Daporinad, GSK269962A, and actinomycin D, whereas high-risk patients may be more sensitive to AZD6738. These drugs involve multiple mechanisms of action, including PI3K inhibitors (Taselisib, Pictilisib, AZD8186), TGF-β receptor inhibitors (SB505124), chemotherapeutic drugs (oxaliplatin, actinomycin D), and NAMPT inhibitors (Daporinad). It is noteworthy that AZD8186, as a PI3Kβ inhibitor, has been proven to affect the survival of multiple myeloma cells in previous studies53,54. Consistent with our findings, a recent study demonstrated that PI3K pathway activation is a hallmark of a specific MM subgroup with distinct metabolic dependencies, further supporting the rationale for risk-stratified PI3K inhibitor therapy6. These computational findings suggest that stratifying patients based on risk scoring models may generate hypotheses for individualized drug selection, but they require validation in clinical cohorts or experimental models before any therapeutic application can be considered. The predicted ceRNA network suggested potential upstream regulation of MERTK and SOCS3 by selected lncRNA-miRNA interactions. This finding is similar to work by Hu et al.55, who identified MALAT1 as a master regulator of metabolic gene expression in aggressive MM. However, these interactions were derived from database prediction and require functional validation.
This study employed integrated bioinformatics analyses to identify 8 prognostic genes related to MM. Several limitations should be recognized. First, the exclusive use of public bulk transcriptomic databases, without single-cell resolution or prospective multicenter validation, limits the generalizability of our findings; although ssGSEA and WGCNA are widely used for immune contexture inference in large cohorts, the possibility that malignant plasma cells contribute to immune-related gene signals cannot be excluded, and bulk data may not fully resolve the cellular heterogeneity of the bone marrow microenvironment. Second, the functional mechanisms of key genes were primarily inferred from literature and bioinformatics predictions, necessitating rigorous confirmation through in vitro and in vivo experimental systems. Third, the ceRNA network construction relied on database predictions, and its biological functions remain to be experimentally confirmed. In addition, the use of survival-based cutoff selection may introduce cutoff-related bias and potentially overestimate survival differences. The predicted drug sensitivity results were derived from computational inference based on GDSC data and were not validated using clinical treatment response or in vitro drug assays. Therefore, these findings should be interpreted as hypothesis-generating rather than as evidence of actual therapeutic efficacy. Future investigations should prioritize expansion of clinical sample size for validation and establish cellular and animal models to dissect the precise molecular signature underlying key gene involvement in MM pathogenesis and immune regulation, thereby providing a theoretical foundation for developing novel therapeutic targets and personalized treatment strategies. In particular, the MP-related associations identified in this study, derived from a published gene list and correlative immune infiltration estimates, require experimental validation using approaches such as in vitro polarization assays, single-cell RNA sequencing, or spatial transcriptomics to confirm functional relevance.
In conclusion, this study systematically identified and evaluated an eight-gene MP-related prognostic signature in MM, including LGALS3, IL2RG, ADAM8, MERTK, ACSS1, ARSK, CBX6, and SOCS3. These genes were significantly associated with patient prognosis and may be involved in the regulation of the immunosuppressive TME. The constructed risk model showed acceptable prognostic predictive performance. Collectively, our findings provide new insights into the potential relationship between MP, immune regulation, and MM progression, and suggest candidate biomarkers for prognostic evaluation. Further functional experiments and prospective multicenter clinical studies are needed to confirm these findings and evaluate their potential clinical applicability.
Oświadczenia
The authors declare that they have no competing interests.
Podziękowania
This work was supported by the Wannan Medical College Young and Middle-aged Research Fund (WK2024ZQNZ53, to Ran Wang), the Wuhu Municipal Science and Technology Program (2024kj051, to Jingwei Zhang), the Anhui Provincial Clinical Medicine Research and Translational Special Project (202527c10020028, to Jingwei Zhang), the Anhui Provincial New Era Education Quality Project for Graduate Education (2022zyxwjxalk160, to Zhongling Wei), the Wannan Medical College Quality Engineering Project (2022jyxm78, to Zhongling Wei), the Provincial Quality Engineering Project of Higher Education Institutions in Anhui Province (2023jyxm1229, to Zhongling Wei), and the Industry-Academia Collaboration Project of the First Affiliated Hospital of Wannan Medical University (XQHR202410, to Laiquan Huang).
Materiały
| Nazwa | Firma | Numer katalogowy | Komentarze |
|---|---|---|---|
| clusterProfiler | Bioconductor | v4.12.6 | GO and KEGG enrichment analysis |
| GSVA | CRAN | v2.0.7 | ssGSEA analysis |
| GEO | https://www.ncbi.nlm.nih.gov/geo/ | Public repository; used to retrieve GSE4581 dataset (validation set) | |
| GDSC | https://www.cancerrxgene.org/ | Drug response database; used for IC50 prediction | |
| ggalluvial | CRAN | v0.12.5 | Sankey diagram for ceRNA network visualization |
| limma | Bioconductor | v3.60.6 | Differential expression analysis; normalizeBetweenArrays() for quantile normalization |
| oncoPredict | CRAN | v4.0.2 | Drug sensitivity prediction; calcPhenotype() function with ridge regression and Box-Cox transformation |
| UCSC Xena Browser | https://xenabrowser.net | Public genomic database; used to access GDC MMRF-COMMPASS cohort (training set) |
Bibliografia
- Cowan AJ, et al. Diagnosis and management of multiple myeloma: a review. JAMA. 2022;327(5):464–77.
- Rees MJ, Kumar S. High-risk multiple myeloma: redefining genetic, clinical, and functional high-risk disease in the era of molecular medicine and immunotherapy. Am J Hematol. 2024;99(8):1560–75.
- Cantu MD, Chen W. Differential diagnosis of multiple myeloma. Semin Diagn Pathol. 2025;42(6):150944.
- Baloch SS, et al. Multiple myeloma and its rare paraneoplastic manifestations simmering under the surface. Pathol Res Pract. 2023;248:154689.
- Li X, et al. Prognostic implications of thrombocytopenia in Chinese patients with newly diagnosed multiple myeloma. Cancer Med. 2025;14(21):e71353.
- Lu Q, et al. Multiple myeloma: signaling pathways and targeted therapy. Mol Biomed. 2024;5(1):25.
- Rivera J, et al. Deciphering neutrophil dynamics in the focal lesion tumor microenvironment to overcome immunosuppression in multiple myeloma. Blood. 2025;146(20):2392–405.
- Wang SSY, Chng WJ, Liu H, de Mel S. Tumor-associated macrophages and related myelomonocytic cells in the tumor microenvironment of multiple myeloma. Cancers (Basel). 2022;14(22):5654.
- Cheng Y, et al. Multi-omics reveal immune microenvironment alterations in multiple myeloma and its precursor stages. Blood Cancer J. 2024;14(1):194.
- Luo M, et al. Macrophage polarization: an important role in inflammatory diseases. Front Immunol. 2024;15:1352946.
- Zeng W, et al. Functional polarization of tumor-associated macrophages dictated by metabolic reprogramming. J Exp Clin Cancer Res. 2023;42(1):245.
- Zhang L, et al. PGRN is involved in macrophage M2 polarization regulation through TNFR2 in periodontitis. J Transl Med. 2024;22(1):407.
- Yang X, et al. FABP5(+) lipid-loaded macrophages process tumour-derived unsaturated fatty acid signal to suppress T-cell antitumour immunity. J Hepatol. 2025;82(4):676–89.
- Sun J, et al. IL-10R inhibition reprograms tumor-associated macrophages and reverses drug resistance in multiple myeloma. Leukemia. 2024;38(11):2355–65.
- Sun J, et al. Tumor-associated macrophages in multiple myeloma: advances in biology and therapy. J Immunother Cancer. 2022;10(4):e003975.
- Wang S, Liu G, Li Y, Pan Y. Metabolic reprogramming induces macrophage polarization in the tumor microenvironment. Front Immunol. 2022;13:840029.
- Zhang H, et al. Roles of tumor-associated macrophages in anti-PD-1/PD-L1 immunotherapy for solid cancers. Mol Cancer. 2023;22(1):58.
- Chu X, Tian Y, Lv C. Decoding the spatiotemporal heterogeneity of tumor-associated macrophages. Mol Cancer. 2024;23(1):150.
- Bai X, et al. Macrophage polarization in cancer and beyond: from inflammatory signaling pathways to potential therapeutic strategies. Cancer Lett. 2025;625:217772.
- Yuan Y, et al. Analysis of macrophage polarization and regulation characteristics in ovarian tissues of polycystic ovary syndrome. Front Med (Lausanne). 2024;11:1417983.
- Meng D, et al. Identification of the immune subtypes for the prediction of metastasis in pancreatic neuroendocrine tumors. Neuroendocrinology. 2023;113(7):719–35.
- Yu G, Wang LG, Han Y, He QY. clusterProfiler: an R package for comparing biological themes among gene clusters. OMICS. 2012;16(5):284–7.
- Lv J, et al. WGCNA-ML-MR integration: uncovering immune-related genes in prostate cancer. Front Oncol. 2025;15:1534612.
- Qi X, et al. Machine learning and SHAP value interpretation for predicting comorbidity of cardiovascular disease and cancer with dietary antioxidants. Redox Biol. 2025;79:103470.
- Manna L, et al. Unraveling obesity and multiple myeloma: insights from epidemiology and molecular mechanisms. Curr Obes Rep. 2025;14(1):52.
- Cencini E, et al. Tumor-associated macrophages in multiple myeloma: key role in disease biology and potential therapeutic implications. Current Oncology. 2023; 30(7):6111-6133.
- Dong J, et al. The necroptosis related gene LGALS3 can be used as a biomarker for the adverse progression from chronic HBV infection to HCC. Front Immunol. 2023;14:1142319.
- Zhao S, et al. HDAC7 drives glioblastoma to a mesenchymal-like state via LGALS3-mediated crosstalk between cancer cells and macrophages. Theranostics. 2024;14(18):7072–87.
- Cheng D, et al. Senescent endothelial cell-derived Galectin 3 promotes silicosis through endothelial-fibroblast and endothelial-macrophage crosstalk. J Hazard Mater. 2025;489:137605.
- Pianetti S, et al. ADAM8 is expressed widely in breast cancer and predicts poor outcome in hormone receptor positive, HER-2 negative patients. Cancer Cell Int. 2023;23(1):165.
- Evers M, et al. Association of ADAM family members with proliferation signaling and disease progression in multiple myeloma. Blood Cancer J. 2024;14(1):156.
- Ji Z, et al. ADAM8 in macrophages exacerbates sepsis-induced cardiomyopathy by impeding efferocytosis. Front Immunol. 2025;16:1654688.
- Qu H, et al. Knockdown of ADAM8 inhibits the proliferation, migration, invasion, and tumorigenesis of renal clear cell carcinoma cells to enhance the immunotherapy efficacy. Transl Res. 2024;266:32–48.
- Xiao Y, et al. MEX3C-mediated decay of SOCS3 mRNA promotes JAK2/STAT3 signaling to facilitate metastasis in hepatocellular carcinoma. Cancer Res. 2022;82(22):4191–205.
- Yuan F, et al. Endothelial progenitor cell-derived exosomes promote anti-inflammatory macrophages via SOCS3/JAK2/STAT3 axis and improve the outcome of spinal cord injury. J Neuroinflammation. 2023;20(1):156.
- Lin L, et al. B7-H3 promotes multiple myeloma cell survival and proliferation by ROS-dependent activation of Src/STAT3 and c-Cbl-mediated degradation of SOCS3. Leukemia. 2019;33(6):1475–86.
- Pan Z, et al. Inhibition of MERTK reduces organ fibrosis in mouse models of fibrotic disease. Sci Transl Med. 2024;16(741):eadj0133.
- Cruz Cruz J, et al. Inhibiting efferocytosis reverses macrophage-mediated immunosuppression in the leukemia microenvironment. Front Immunol. 2023;14:1146721.
- Xu G, et al. Mitochondrial ACSS1-K635 acetylation knock-in mice exhibit altered metabolism, cell senescence, and nonalcoholic fatty liver disease. Sci Adv. 2024;10(20):eadj5942.
- Fu X, et al. ACSS1 co-opts acetyl-CoA metabolism to drive DNA repair and undermine radiotherapy efficacy in breast cancer. Cell Death Dis. 2025;17(1):119.
- Mochmann LH, et al. Proteomic profiling reveals ACSS2 facilitating metabolic support in acute myeloid leukemia. Cancer Gene Ther. 2024;31(9):1344–56.
- Tinoco AB, et al. Discovery of a neuropeptide that acts as an autotomy-promoting factor. Curr Biol. 2024;34(18):4325–31.e3.
- Zhang Z, et al. A novel lipid metabolism-based risk model associated with immunosuppressive mechanisms in diffuse large B-cell lymphoma. Lipids Health Dis. 2024;23(1):20.
- Uludag Alkaya D, et al. Further characterization of ARSK-related mucopolysaccharidosis type 10. Am J Med Genet A. 2024;194(8):e63635.
- Sun M, et al. A novel homozygous missense variant in ARSK causes MPS X, a new subtype of mucopolysaccharidosis. Genes Dis. 2023;11(3):101025.
- Deng X, et al. Identification and validation of prognostic markers for cuproptosis-related macrophage polarization genes in hepatocellular carcinoma. Discov Oncol. 2025;17(1):196.
- Hu M, et al. Preclinical ex vivo IL2RG gene therapy using autologous hematopoietic stem cells as an effective and safe treatment for X-linked severe combined immunodeficiency disease. Genes Dis. 2025;12(3):101445.
- Briassouli E, Marinakis N, Spoulou V, Notarangelo LD. IL2RG-related immunodeficiencies: from SCID to atypical presentations. Front Immunol. 2026;17:1703097.
- Hu W, et al. Prognostic and therapeutic relevance of IL2RG-related lncRNAs in clear cell renal cell carcinoma. Sci Rep. 2025;15(1):29651.
- van Wijnen AJ, et al. Biological functions of chromobox (CBX) proteins in stem cell self-renewal, lineage-commitment, cancer and development. Bone. 2021;143:115659.
- de Groot AP, de Haan G. How CBX proteins regulate normal and leukemic blood cells. FEBS Lett. 2024;598(22):2788–806.
- Kuijpers TW, et al. A reversion of an IL2RG mutation in combined immunodeficiency providing competitive advantage to the majority of CD8+ T cells. Haematologica. 2013;98(7):1030–8.
- Sklavenitis-Pistofidis R, et al. Systematic characterization of therapeutic vulnerabilities in Multiple Myeloma with Amp1q reveals increased sensitivity to the combination of MCL1 and PI3K inhibitors. bioRxiv. 2023.08.01.551480.
- Zhao F, Che F. Integrating single-cell and bulk RNA profiles to uncover glutamine metabolism’s role in prognosis and immune dynamics in multiple myeloma. BMC Cancer. 2025;25(1):887.
- Hu Y, et al. Targeting the MALAT1/PARP1/LIG3 complex induces DNA damage and apoptosis in multiple myeloma. Leukemia. 2018;32(10):2250–62.