Qi-Fu-Yin treatment significantly improved frailty-related behavioral deficits (gait, grip strength, motor coordination, nesting, and aging score) in 5x Familial Alzheimer’s Disease mice. It also restored neuroendocrine imbalances (estradiol (E2), testosterone (T), corticosterone (CORT)) and reshaped gut microbiota composition and function, with Adlercreutzia abundance negatively correlating with senescence and T levels.
Artykuł badawczy
Qi-Fu-Yin Attenuates Frailty by Regulating Gut Microbiota and Neuroendocrine Hormones in 5xFamilial Alzheimer’s Disease Transgenic Mice
* These authors contributed equally
W tym artykule
Podsumowanie
Streszczenie
Frailty is a common and debilitating feature of Alzheimer’s disease (AD), yet effective therapeutic strategies targeting both cognitive decline and physical frailty remain limited. Qi-Fu-Yin (QFY), a traditional Chinese herbal formulation, has been used to treat aging-related disorders, but its effects on frailty in AD and the underlying mechanisms are unclear. This study aimed to evaluate whether QFY alleviates frailty in 5xFamilial Alzheimer’s Disease (FAD) transgenic mice and to explore the potential involvement of gut microbiota and neuroendocrine hormones. Mice were treated with QFY at low (2.8 g/kg), medium (5.6 g/kg), or high (11.2 g/kg) doses, or with donepezil as a positive control, for 194 days. Frailty-related behaviors were assessed using CatWalk gait analysis, grip strength, rotarod, nest-building, and aging scoring. Plasma hormone levels were measured, and fecal gut microbiota composition and function were analyzed by 16S rRNA sequencing and metagenomic analysis. QFY treatment significantly improved gait parameters, grip strength, motor coordination, nesting ability, and reduced aging scores in 5xFAD mice, with effects comparable to or superior to those of donepezil. QFY also restored aberrant levels of estradiol, testosterone, and corticosterone, and reshaped gut microbiota composition, particularly by increasing the abundance of Adlercreutzia, which negatively correlated with senescence and testosterone levels. Functional metagenomics revealed that QFY partially restored disease-associated microbial pathways, including those involved in carbohydrate metabolism and virulence. These findings suggest that QFY alleviates frailty in 5xFAD mice, with effects associated with concurrent modulation of gut microbiota and neuroendocrine function, though causal relationships require further validation. These findings support further investigation of QFY as a potential intervention for AD-associated frailty.
Wprowadzenie
Alzheimer’s disease (AD), the most prevalent cause of dementia, is a multifactorial neurodegenerative disorder affecting 60–80% of dementia patients1. Its clinical course is dominated by a progressive collapse of cognitive domains, including memory and visuospatial function, which ultimately leads to severe restrictions in patients’ daily activities and social participation2,3. Furthermore, it cannot be ignored that there are many non-cognitive symptoms associated with the pathogenesis of AD, increased frailty and motor deficits4,5,6.
Frailty is often recognized as a state of high vulnerability and low resistance to stress. It is increasingly recognized that frailty may be a distinct clinical syndrome with a biological basis, primarily associated with advancing age and cognitive deficit7. The process of frailty appears to be a transitional state in the dynamic progression from health to functional decline8. Frailty consistently confers a heightened risk for a progressive cascade of adverse clinical endpoints, encompassing precipitous physical and cognitive decline, loss of functional autonomy, increased healthcare utilization, and premature all-cause mortality9. Frailty manifests as fatigue, weight loss, decreased grip strength, slowed gait, decreased activity, and so on. Therefore, it is necessary to investigate the anti-frailty effects of drugs for the prevention and treatment of AD.
The QFY, a traditional Chinese medicine prescription, is composed of Ginseng Radix Et Rhizoma, Rehmanniae Radix Praeparata, Angelicae Sinensis Radix, Atractylodis Macrocephalae Rhizoma, Glycyrrhizae Radix ET Rhizoma Praeparata Cum Melle, Ziziphi Spinosae Semen, Polygalae Radix. Clinical studies have shown that QFY can effectively treat AD10,11. The meta-analysis indicated the administration of QFY was effective in clinic for dementia12. Of note, QFY has demonstrated consistent cognitive-enhancing effects in two distinct AD rodent models. In AGE-induced rats, oral QFY significantly shortened escape latencies in the Morris water maze, indicative of improved spatial reference memory13,14. Parallel findings in Aβ-infused rats showed that QFY extended step-down passive avoidance latencies, coupled with a pronounced reduction in CA1 hippocampal neuron degeneration15. Our prior work has consistently demonstrated the therapeutic potential of QFY in transgenic AD models. In APP/PS1 mice, QFY significantly ameliorated age-dependent cognitive deterioration16. In the more severely affected 5xFAD mice, which closely recapitulate human AD neuropathology, QFY similarly rescued learning and memory impairments, providing the foundation for the present mechanistic investigation17. Pharmacochemical analysis has also identified multiple QFY prototype components and metabolites in rat plasma and cerebrospinal fluid, supporting the systemic and central exposure of QFY-derived constituents18. However, there are no reports on the effects of QFY on frailty in AD.
To investigate whether QFY ameliorates frailty in AD, we evaluated a comprehensive panel of frailty-related phenotypes, including gait parameters, grip strength, motor coordination, daily activity, and aging score, in 5xFAD mice. To explore the underlying mechanisms, we measured serum neuroendocrine hormone levels and performed 16S rRNA sequencing and metagenomic analysis of gut microbiota, aiming to identify potential mediators of QFY’s therapeutic effects.
Protokół
All animal-related experiments carried out have been reviewed and approved by the ethics committee of Shandong University of Traditional Chinese Medicine (Ethics No. SDUTCM20201228001). All the materials and tools used in this study are listed in the Table of Materials.
Preparation of QFY
The QFY extract powder (batch No. 220302) was supplied by a commercial vendor (see Table of Materials). The preparation process was as follows. Ginseng (3.0 kg) was refluxed twice with 60% ethanol (1.5 h each); the combined filtrate was concentrated after ethanol recovery. Volatile oils from Angelica sinensis (4.50 kg) and stir-fried Atractylodes macrocephala (2.50 kg) were isolated by steam distillation and encapsulated with β-cyclodextrin. The residues from these three herbs, together with the remaining four crude drugs (prepared rehmannia root, sour jujube seed, processed polygala, and honey-fried licorice), were decocted twice with water (2 h each). All filtrates were pooled, concentrated to a syrup, centrifuged, and further evaporated to a dense extract (relative density 1.22–1.28 at 60 °C), which was dried and pulverized. The resulting powder was thoroughly blended with the β-cyclodextrin–encapsulated volatile oil to yield the final QFY extract powder.
QFY extract powder was freshly dissolved in distilled water daily. The clinical daily dose of QFY for a 70 kg adult is 43 g/d, which was converted to the equivalent mouse dose using the standard body surface area normalization factor of 9.1, yielding a medium dose (M) of 5.6 g/kg/d. The low dose (L) and high dose (H) were set as half (2.8 g/kg/d) and twice (11.2 g/kg/d) of the medium dose, respectively. Donepezil (1.3 mg/kg/d) was similarly calculated from the clinical dose of 10 mg/d using the same conversion factor. All drug solutions were administered orally by gavage at a fixed volume of 10 mL/kg once daily. The dosing concentration for each group was adjusted daily based on individual body weight to ensure the intended dose. Solutions were stored at 4 °C and used within 24 h; residual solutions were discarded. The vehicle control received an equivalent volume of distilled water.
Animals
5xFAD transgenic mice carrying human APP and PSEN1 transgenes with five familial Alzheimer’s disease (FAD)-associated mutations were obtained from a laboratory animal supplier under the Thy1 promoter, alongside wild type (WT) littermates. Genotyping was performed by PCR19. Both male and female 5xFAD mice were bred and raised to 2.5 months of age at the Experimental Center of Shandong University of Traditional Chinese Medicine. The mice were group-housed in a quiet facility and maintained under a 12 h light/dark cycle environment, with ad libitum access to food and water. Before the experiment, all mice were acclimatized to the experimental environment for 6 days. All efforts were taken to minimize the number of animals used and their suffering20. The 2.5-month-old C57/B6XSJL and 5xFAD mice were randomly divided into 6 groups according to voluntary activity. Each group contained 9—13 mice: WT mice, 5xFAD mice, 5xFAD+Donepezil (1.3 mg/kg/d), 5xFAD+QFY (2.8 g/kg/d), 5xFAD+QFY (5.6 g/kg/d), 5xFAD+QFY (11.2 g/kg/d). Mice in the WT and 5xFAD groups were given an equal volume of distilled water. According to the experimental timelines (Figure 1), drug administration (totaling 194 days) and behavioral tests were conducted. After the behavioral experiment, the feces and plasma samples of each mouse were collected for ELISA, Radioimmunoassay, 16S rRNA sequencing, and metagenomic sequencing.
Behavioral tests
CatWalk test
An automated gait analysis system was used to assess gait parameters. The apparatus comprises a glass walkway enclosed by sidewalls (130 cm × 20 cm), through which green light is introduced via total internal reflection. When a paw contacts the glass surface, light is scattered at the contact points, enabling visualization of footprints with a high-speed camera positioned beneath the walkway. Captured images were digitized in real time and transmitted to a computer via an Ethernet interface, with pixel intensity directly proportional to the locally reflected light. Prior to formal testing, all mice underwent a 5-day habituation and training regimen (three trials per day) until they could traverse the corridor unidirectionally without interruption. On the final test day, three successful runs per animal—defined as uninterrupted crossings with consistent paw placement and a run duration within the predefined minimum and maximum duration thresholds—were recorded and analyzed for spatiotemporal parameters. Runs falling outside these duration thresholds were automatically classified as non-compliant by the acquisition software and excluded from analysis. Data collection continued until three compliant runs were obtained for each animal.
Grip strength test
Grip strength was assessed using a grip strength measuring instrument. The device was placed horizontally on a stable bench, with the force sensor aligned along the horizontal plane. Prior to each testing session, the instrument was calibrated following the manufacturer’s instructions. A mouse was gently placed on the grip grid with its forelimbs positioned to grasp the bars. The tail was then pulled steadily and uniformly in the horizontal direction away from the grid until the animal released its grip. The maximum tensile force (N) generated immediately before release was automatically recorded by the instrument. Each mouse underwent three consecutive trials, with an inter-trial interval of 30 s, during which the animal was allowed to rest on the platform to minimize fatigue. The operator performing the measurements was blinded to the experimental group assignments. Place the grip strength tester horizontally to keep the mouse grip strength board moving horizontally. Press the measuring key, and the measuring light will be on. At this time, the mouse can be gently placed on the grip strength board, and the mouse’s tail can be gently pulled back (not jerked). After the mouse grasps the grip board, it will be pulled back evenly, causing the animal to loosen its claws. At this time, the instrument will automatically record the maximum grip strength of the mouse, accompanied by audio prompts, and measure it three times in a row. Finally, the experimental results will be measured three times.
Rotarod test
Motor coordination and balance were assessed using the rotarod apparatus. The protocol consisted of a habituation/training phase and a formal testing phase. During training, mice were placed on the rotating drum at a constant speed of 10 rpm for 3 min per session to familiarize them with the task. Twenty-four hours later, the formal test was conducted at a fixed speed of 15 rpm. The latency to fall (i.e., the time each animal remained on the rod) was recorded as the primary endpoint, with a cutoff time of 300 s to prevent muscle fatigue and ensure that inter-individual differences in balance capability were adequately captured. An animal was considered to have fallen when it either dropped off, actively grasped the rod and rotated passively for three consecutive revolutions, or clung to the rod without active stepping. Three consecutive trials were performed per mouse, with 30-min inter-trial intervals, and the final score for each animal was calculated as the mean latency across the three trials.
Nest-building test
After administration of QFY at 8:00 am, 6 pieces of soft paper for nesting were added to the mouse cage, and the nesting behavior of animals was observed at 6 h, 12 h, and 24 h, respectively. Nest quality was evaluated using the following four-point scoring system: 1 point, the pieces of paper were scattered around the cage without being bitten; 2 points, the pieces of paper were gathered to one side of the cage, but they were loose, and there was no formed nest, and there was no obvious bite or folding. 3 points, the pieces of paper were gathered and folded into a formed but flat nest, and there was no obvious bite. At 4 points, the pieces of paper were gathered and folded into a deep nest and were torn into small pieces. All mice were scored by a blind method.
Aging score test
An aging grade scale based on behavioral and cosmetic changes in mice was developed using the aging scale developed by Professors Toshio Takeda and Masanori Hosokawa21,22 at Kyoto University, Japan. Each index was categorized into five grades corresponding to a scores of 1–5, depending on the degree, with 5 being the most severe.
Enzyme-linked immunosorbent assay (ELISA)
Plasma concentrations of corticosterone (CORT), estradiol (E2), and testosterone (T) were determined using commercially available precoated enzyme-linked immunosorbent assay (ELISA) kits, following the manufacturer’s protocols. Optical densities were read at 450 nm using a full-wavelength microplate reader. All samples were assayed in duplicate, and the mean values were used for subsequent statistical analyses.
Radioimmunoassay
Concentrations of follicle-stimulating hormone (FSH) and luteinizing hormone (LH) in the plasma of the mice were measured with the commercial radioimmunoassay kit according to the manufacturer’s instructions.
Sample collection, DNA extraction, and PCR amplification
Fresh fecal samples (≥200 mg each) were collected immediately upon natural defecation from five mice per group: WT, 5xFAD, and QFY middle-dose-treated 5xFAD mice (n = 5 per group; 15 samples in total). Microbial genomic DNA was extracted from each specimen using a commercial DNA extraction kit according to the manufacturer’s instructions. DNA integrity was verified by agarose gel electrophoresis, and the purified DNA concentration was determined using a microvolume spectrophotometer. The V3–V4 hypervariable region of the bacterial 16S rRNA gene was amplified using a thermal cycler. All PCR reactions were performed in triplicate. The PCR amplification was performed as follows: initial denaturation at 95 °C for 3 min, followed by 27 cycles of denaturing at 95 °C for 30 s, annealing at 55 °C for 30 s and extension at 72 °C for 45 s, and single extension at 72 °C for 10 min, and end at 4 °C. Amplicons were resolved on 2% agarose gels, excised, and purified with a commercial gel extraction kit, followed by quantification using a Fluorometer.
16S rRNA sequencing and Processing of microbial diversity data
Purified amplicons were pooled at equimolar concentrations and subjected to paired-end sequencing on a next-generation sequencing platform, following the manufacturer’s standard protocols. Raw sequencing reads were demultiplexed, quality-trimmed using sequence quality-control software, and merged with paired-end read-merging software. Operational taxonomic units (OTUs) were clustered at a 97% sequence similarity threshold using sequence clustering software, with chimeric sequences identified and removed during clustering. Taxonomic assignment for each representative OTU sequence was performed using the microbial taxonomic classification software against the ribosomal RNA reference database, with a confidence cutoff of 70%.
Gene prediction, taxonomy, and functional annotation
To construct a non-redundant gene catalog, all predicted genes with nucleic acid sequences ≥100 bp were translated into amino acid sequences, and the gene prediction results were compiled per sample. The representative gene set was generated using sequence clustering software with thresholds of 90% sequence identity and 90% coverage. Quality-filtered reads were then aligned to this non-redundant catalog using sequence alignment software at 95% identity to estimate gene abundances in each sample. For functional annotation, the representative sequences were aligned to multiple public databases using protein alignment software with a unified e-value threshold of 1 × 10⁻5. Taxonomic assignment was performed against the NCBI NR database; functional categorization was conducted against the pathway annotation database, orthologous gene annotation database, carbohydrate-active enzyme database, and virulence factor database.
Statistical analysis
All data are presented as mean ± standard error of the mean (SEM). Statistical analyses were performed using statistical analysis software. Between-group comparisons were evaluated using an unpaired Student’s t-test. Multiple-group comparisons against a single control group were assessed by one-way analysis of variance (ANOVA) followed by Dunnett’s post hoc test. Spearman’s rank correlation coefficient was employed to examine associations among differentially abundant microbial genera, behavioral parameters, and circulating neuroendocrine hormone levels. A two-tailed P < 0.05 was considered statistically significant. FDR-adjusted q-values for all comparisons are available in Supplementary Table 1.
Wyniki
QFY improved frailty of 5xFAD mice
In this study, the CatWalk test, grip strength test, rotarod test, nest building test and aging score were performed to evaluate the effects of QFY on the frailty of 5xFAD mice.
Gait Walk test
After the treatment of QFY, CatWalk test was employed to collect the gait analysis parameters of mice. Compared with the WT, right hindlimb mean intensity (Figure 2A2, P < 0.01), right forelimb stride length (Figure 2A2, P < 0.01), right hindlimb stride length (Figure 2A1, P < 0.05), left forelimb stride length (Figure 2A1, P < 0.01; Figure 2A2, P < 0.05), left hindlimb stride length (Figure 2A1, P < 0.01; Figure 2A2, 2A3, P < 0.05), right forelimb stand (Figure 2A1, P < 0.05; Figure 2A3, P < 0.01), left forelimb and left hindlimb stand (Figure 2A3, P < 0.05), right forelimb stand index (Figure 2A3, P < 0.05), left forelimb stand index (Figure 2A1,2A3, P < 0.01), right hindlimb swing (Figure 2A1, Figure 2A3, P < 0.01; Figure 2A2, P < 0.05), right hindlimb step circle (Figure 2A3, P < 0.01), left hindlimb step circle (Figure 2A1, 2A2, 2A3, P < 0.05), right forelimb duty cycle (%) (Figure 2A1, P < 0.05) and right hindlimb body speed (Figure 2A2, P < 0.05) were significantly decreased in 5xFAD mice; right hindlimb swing speed (Figure 2A1, P < 0.01), left hindlimb swing speed (Figure 2A3, P < 0.01), right hindlimb duty cycle (%) (Figure 2A1, P < 0.01, Figure 2A2, P < 0.05), left hindlimb duty circle (%) (Figure 2A1, P < 0.05), right hindlimb body speed (Figure 2A3, P < 0.05) and left hindlimb body speed (Figure 2A3, P < 0.05) were significantly increased in 5xFAD mice. Donepezil could increase right hindlimb mean intensity (Figure 2A2, 2A3, P < 0.01), right forelimb stride length (Figure 2A2, P < 0.01) and decrease right hindlimb swing (Figure 2A3, P < 0.05) of 5xFAD mice significantly.
The treatment of QFY significantly increased right hindlimb mean intensity (Figure 2A1, P < 0.05 in 5.6 mg/kg QFY group; Figure 2A2, P < 0.01 in 2.8 mg/kg, 5.6 mg/kg and 11.2 mg/kg QFY group), right forelimb stride length (Figure 2A2, P < 0.05 in 2.8 mg/kg, 5.6 mg/kg and 11.2 mg/kg QFY group), left forelimb stride length (Figure 2A2, P < 0.05 in 11.2 mg/kg QFY group), left hindlimb stride length (Figure 2A1, P < 0.05 in 5.6 mg/kg and 11.2 mg/kg QFY group; Figure 2A2, P < 0.05 in 11.2 mg/kg QFY group), right forelimb stand index (Figure 2A1, P < 0.05 in 5.6 mg/kg QFY group), left hindlimb swing (Figure 2A1, Figure 2A2, P < 0.01 in 11.2 mg/kg QFY group), left hindlimb swing speed (Figure 2A2, P < 0.05 in 5.6 mg/kg QFY group), right forelimb (Figure 2A1, P < 0.05), right hindlimb (Figure 2A1, P < 0.05) and left forelimb (Figure 2A1, P < 0.01) body speed in 11.2 g/kg QFY group, right forelimb body speed variation (%) (Figure 2A1, P < 0.01 in 2.8 g/kg QFY group; Figure 2A2, P < 0.05 in 11.6 g/kg QFY group), right and left hindlimb body speed variation (%) (Figure 2A1, P < 0.01 in 2.8 g/kg QFY group), left forelimb body speed variation (%) (Figure 2A1, P < 0.01 in 2.8 g/kg QFY group) of 5xFAD mice. Moreover, right hindlimb swing (Figure 2A3, P < 0.05 in 11.2 g/kg QFY group), right hindlimb duty cycle (%) (Figure 2A2, P < 0.05 in 11.2 g/kg QFY group), left hindlimb duty cycle (%) (Figure 2A1, P < 0.05 in 11.2 g/kg QFY group) was significantly increased by QFY treatment. The above results show that QFY significantly improved the gait of 5xFAD mice, especially for male mice.
Grip strength
After QFY treatment for 182 days, the grip strength of the mice was detected using the grip strength experiment. The results showed that compared with the WT, the grip strength of the 5xFAD mice was significantly weakened (Figure 2B1, P < 0.01; Figure 2B2, P < 0.01); Compared with 5xFAD mice, donepezil can significantly enhance the grip strength of 5xFAD mice (Figure 2B1, P < 0.05; Figure 2B2, P < 0.01), and the grip strength of 5xFAD mice in 2.8 g/kg (Figure 2B1,B2,B3, P < 0.01), 5.6 g/kg (Figure 2B1,2B3, P < 0.01) and 11.2 g/kg (Figure 2B2, P < 0.01) QFY group is significantly enhanced. The results suggested that the grip strength of 5xFAD mice was significantly weakened, while low, medium, and high doses of QFY enhanced the grip strength of 5xFAD mice significantly.
Motor coordination ability
The rotarod test was conducted to detect motor coordination ability of mice after treatment of QFY. Compared with the WT group, the fall latency of the 5xFAD mice was significantly shortened (Figure 2C1, P < 0.05), while that of donepezil (Figure 2C1, P < 0.05) and 5.6 g/kg QFY (Figure 2C1, P < 0.05) was significantly prolonged compared with the 5xFAD mice. There were no differences between the sexes. The results showed that the motor coordination ability of 5xFAD mice was significantly impaired, and that donepezil and middle dose QFY were significantly heightened.
The degree of senescence
The aging score data showed that, compared with the WT group, the aging score of the 5xFAD mice increased significantly (Figure 2D1, P < 0.01; Figure 2D2, P < 0.01; Figure 2D3, P < 0.05). When compared with the 5xFAD mice, the aging score of donepezil group decreased significantly (Figure 2D1,2D2, P < 0.01), and the aging score of the QFY group decreased significantly (Figure 2D1,2D2, P < 0.01, P < 0.01 in 2.8 mg/kg QFY group; Figure 2D1,2D2, P < 0.01 and Figure 2D3, P < 0.05 in 5.6 mg/kg and 11.2 mg/kg QFY group). These results suggested that the 5xFAD mice showed obvious aging characteristics; both donepezil and QFY alleviated the aging degree of 5xFAD mice significantly.
Daily activity
We investigated daily activity of the mice by nest building test. The results showed that the nesting score of 5xFAD mice at 6 h (Figure 3A1, P < 0.001; Figure 3B1, P < 0.01) and 24 h (Figure 3A3,3B3, P < 0.01) was significantly decreased compared with the WT group. Donepezil significantly increased the 6 h (Figure 3B1, P < 0.05) and 12 h nesting scores of the 5xFAD mice (Figure 3A2, P < 0.05; 3B2, P < 0.01). The 6 h scores (Figure 3A1, P < 0.01; Figure 3B1,3C1, P < 0.05), 12 h score (Figure 3A2,3B2, P < 0.01), and 24 h score (Figure 3A3, P < 0.05) of the 2.8 g/kg QFY significantly increased. In 5.6 g/kg QFY group, the 6 h score (Figure 3A1, P < 0.01; 3B1, 3C1, P < 0.05), 12 h score (Figure 3A2, P < 0.001; 3B2, P < 0.01), and 24 h score (Figure 3A3, P < 0.05) were significantly increased compared to 5xFAD mice. Moreover, results of the present study showed that the 5xFAD mice in the QFY group have stronger nesting ability than before treatment (Figure 3D). These results indicated that the ability of daily activity in 5xFAD mice was impaired, and the administration of donepezil and the low-medium QFY significantly ameliorated this impairment.
The treatment of QFY modulates abnormal neuroendocrine in 5xFAD mice
To observe the effects of QFY on neuroendocrine, follicle stimulating hormone (FSH), luteinizing hormone (LH), estradiol (E2), testosterone (T), corticosterone (CORT) in the plasma of 5xFAD mice were detected by radioimmunoassay or ELISA analysis. In 5xFAD mice, the levels of E2 (Figure 4C1,4C2, P < 0.01), CORT (Figure 4E2, P < 0.05) were significantly increased compared to the WT mice. The contents of T were significantly decreased in female + male 5xFAD group (Figure 4D1, P < 0.05) and male 5xFAD group (Figure 4D2, P < 0.01), however, in female 5xFAD mice, its level was obviously increased (Figure 4D3, P < 0.05). QFY treatment could decrease E2 level (Figure 4C1, P < 0.05; 4C2, P < 0.01) in female +male group and male group of 5xFAD mice, while QFY increased its level significantly (Figure 4C3, P < 0.05). For T contents, QFY treatment increased its level significantly (Figure 4D2, P < 0.05). The above data suggested that the hormone level of 5xFAD mice was abnormal, and QFY regulated and restored the aberrant contents of FSH, E2, and T in 5xFAD mice.
The treatment of QFY restored gut microbiota imbalances in 5xFAD mice
Following 16S rRNA gene amplification and metagenomic shotgun sequencing of fecal gDNA extracts, a total of 650,948 high-quality sequences were obtained from the Illumina MiSeq platform, with the majority of reads (approximately 94%) ranging from 401 to 440 bp in length. After quality filtering and clustering, 594 OTUs were identified across all samples at a 97% similarity threshold. The depth and evenness of the sequencing libraries were validated using rarefaction curves, Shannon diversity curves, and rank-abundance distributions (Supplementary Figure 1), all of which indicated that the sequencing effort was sufficient to capture most microbial diversity and that species distributions were comparable across experimental groups.
The results by Principal Component Analysis (PCA) analysis showed that the gut microbiota of the WT group and 5xFAD mice administered with QFY were clustered together on the species level, while the gut microbiota of the 5xFAD mice group were distinct from the other two groups (Figure 5A1). Average PCA scores revealed that the average gut microbiota score of the 5xFAD group was significantly higher than that of the WT group (Figure 5A2, P < 0.05), while administration of QFY decreased this score (Figure 5A2). These results suggested that QFY facilitates advantageous changes in the structure of the gut microbial community.
LEfSe testing was used to further assess alterations in microbiota composition with QFY treatment. The structure and predominant microbiota in each group were also represented as a cladogram. Bacterial taxa were found to be changed between three groups at different levels of taxonomic classification starting at the phylum level (Figure 5B). In the WT group, three taxa were enriched including Prevotellaceae_UCG-001, lleibacterium and Adlercreutzia. In the 5xFAD group, six taxa were enriched (Mycoplasma, Allobaculum, norank_f_Lachnospiraceae, Helicobacter, bilophila and Rikenellaceae_RC9_gut_group). In QFY group, norank_f_Mitochondria, Coriobacteriaceae_UCG-002, norank_f_Ruminococcaceae and Enterorhabdus were enriched. The relative abundances of selected bacterial genera across the WT, 5xFAD, and QFY groups are summarized in Table 1.
Based on the obtained community abundance data, species across different microbial community groups were identified using rigorous statistical methods, and the significance of species abundance differences was evaluated to identify species that differed significantly between groups. Compared with WT controls, 5xFAD mice exhibited a significant decrease in the relative abundance of Adlercreutzia at the genus level (Figure 5C1, P < 0.05). At the species level, Bacteroides caecimuris was significantly increased, whereas Parabacteroides sp. was significantly decreased in the 5xFAD group (Figure 5C2,5C3, P < 0.05). Of note, QFY administration significantly alleviated these microbial alterations, suggesting a potential restorative effect on gut microbiota composition. Pearson correlation analysis revealed that the relative abundance of Adlercreutzia was significantly negatively correlated with the degree of senescence (Figure 5D1, r = -0.5757, P = 0.0247). Similarly, a significant negative correlation was observed between Adlercreutzia abundance and serum T level (Figure 5D2, r = -0.6764, P = 0.0056). These results suggest that higher Adlercreutzia abundance is associated with a lower senescence burden and lower T levels.
QFY intervention improves functional diversity of the gut microbiome in 5xFAD mice
Functional annotation of the gut microbial gene catalog was performed by querying against four public databases: the eggNOG (Evolutionary Genealogy of Genes: Non-supervised Orthologous Groups) database for orthologous protein classification, the KEGG (Kyoto Encyclopedia of Genes and Genomes) database for metabolic pathway mapping, the CAZy (Carbohydrate-Active enZYmes) database for carbohydrate-active enzyme identification, and the VFDB (Virulence Factor Database) for putative virulence factor detection.
Among the known functions, the dominant functions (relative abundance >1%) of the mouse intestinal flora in each group were mainly distributed among 20 functions, of which the top 5 functions were L (Replication, recombination and repair), M (Cell wall/membrane/envelope biogenesis), K (Transcription), G (Carbohydrate transport and metabolism), and about 40% of the unknown functions S (Figure 6A1). The results showed that compared with the WT group, the relative abundance of COG1109 (Phosphoglucosamine mutase) (Figure 6A2, P < 0.01) and COG0296 (Alpha-amylase) (Figure 6A3, P < 0.01) in 5xFAD group significantly decreased, and the administration of QFY significantly improved the abnormal relative abundance of these functions (Figure 6A2, P < 0.01; Figure 6A3, P < 0.05).
KEGG pathway annotation revealed that the functional profiles of the gut microbiota were primarily distributed across six major categories: metabolism, genetic information processing, environmental information processing, cellular processes, organismal systems, and human diseases (Figure 6B1). At KEGG level 3, the 5xFAD group exhibited a significant decrease in the relative abundance of the acarbose and validamycin biosynthesis pathway (Figure 6B2, P < 0.001) and a significant increase in the toluene degradation pathway (Figure 6B3, P < 0.01) compared with the WT group. Notably, QFY administration significantly elevated the abundance of acarbose and validamycin biosynthesis (Figure 6B2, P < 0.05) and reduced the toluene degradation pathway (Figure 6B3, P < 0.01), suggesting that QFY treatment partially restored the abnormal functional profiles associated with the 5xFAD model.
CAZy family annotation revealed that the six most abundant families across all samples were glycoside hydrolases, glycosyl transferases, carbohydrate esterases, carbohydrate-binding modules, auxiliary activities and polysaccharide lyases (Figure 6C1). At the family level, compared with WT mice, the 5xFAD group exhibited a significant decrease in the relative abundance of GH43_2 (Figure 6C2, P < 0.001) and a significant increase in the GH138 (Figure 6C3, P < 0.001). Notably, QFY treatment significantly reversed these alterations, as evidenced by the significant upregulation of GH43_2 (Figure 6C3, P < 0.05) and the significant downregulation of GH138 (Figure 6C3, P < 0.01). These results suggest that QFY treatment partially restored the disease-associated dysregulation of CAZy family abundance.
Based on the VFDB annotation, the functional distribution of virulence factors in the gut microbiota was characterized across all groups. At the category level, the seven most abundant virulence factor categories across all samples were antiphagocytosis, secretion system, adherence, iron uptake system, regulation, toxin, and serum resistance (Figure 6D1). At the individual virulence factor level, compared with WT mice, the 5xFAD group exhibited a significant decrease in the relative abundance of streptococcal plasmin receptor/GAPDH (CVF123) (Figure 6D2, P < 0.05) and capsular polysaccharide (CVF282) (Figure 6D3, P < 0.01). Notably, QFY administration significantly increased the relative abundance of both CVF123 and CVF282 (Figure 6D2,6D3, P < 0.05), suggesting that QFY treatment partially restored the virulence factor profile toward WT levels.
DATA AVAILABILITY:
The data that support the findings of this study are available from the corresponding author upon reasonable request due to file size limitations.

Figure 1: The workflow of animals and drug administration. Please click here to view a larger version of this figure.
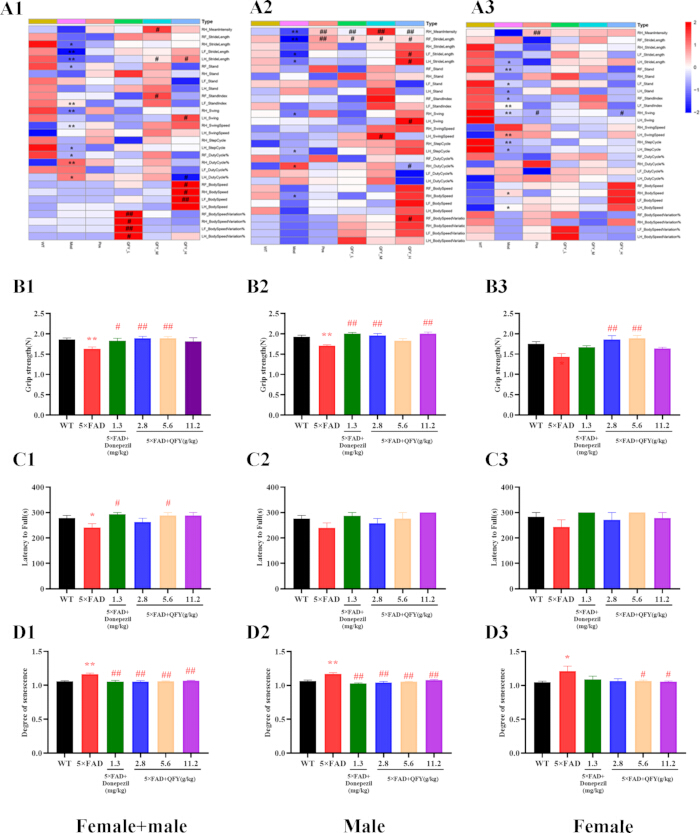
Figure 2: The treatment of Qi-Fu-Yin improved frailty of 5xFAD transgenic mice. (A1—A3) The gait in the Catwalk test. (B1—B3) Grip strength. (C1—C3) Latency to fall in the rotarod test. (D1—D3) Degree of senescence. The values are mean ± SEM; n = 3—13. *P < 0.05, **P < 0.01, vs WT, unpaired Student’s t test; #P < 0.05, ##P < 0.01, vs 5xFAD, one-way ANOVA analysis followed by Dunnett’s multiple comparisons test. Please click here to view a larger version of this figure.
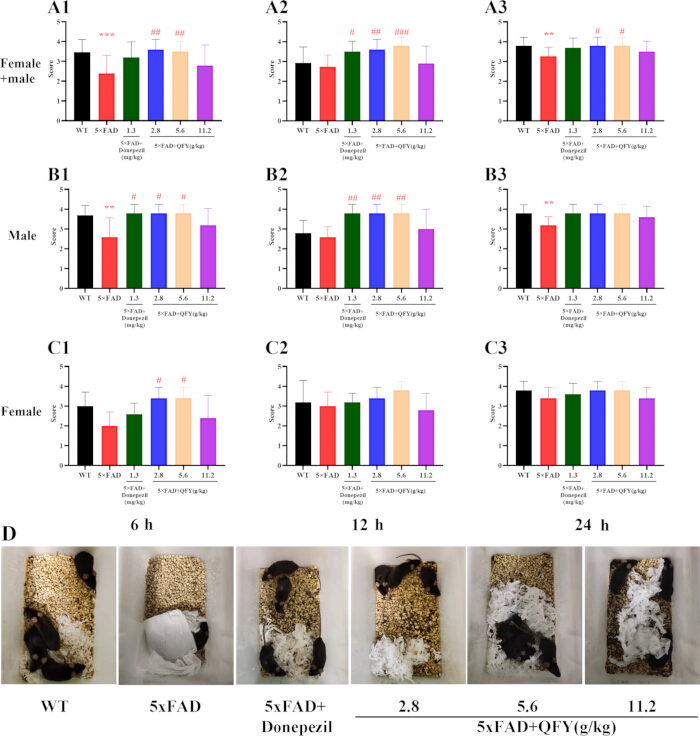
Figure 3: The treatment of QFY improved the daily activity of 5xFAD mice. The score of nest building test for 6 h (A1,B1,C1), 12 h (A2,B2,C2) and 24 h (A3,B3,C3). (D) The photos of mice in each group. The values are mean ± SEM; n = 3—13. *P < 0.05, **P < 0.01, vs WT, unpaired Student’s t test; #P < 0.05, ##P < 0.01, vs 5xFAD, one-way ANOVA analysis followed by Dunnett’s multiple comparisons test. Please click here to view a larger version of this figure.
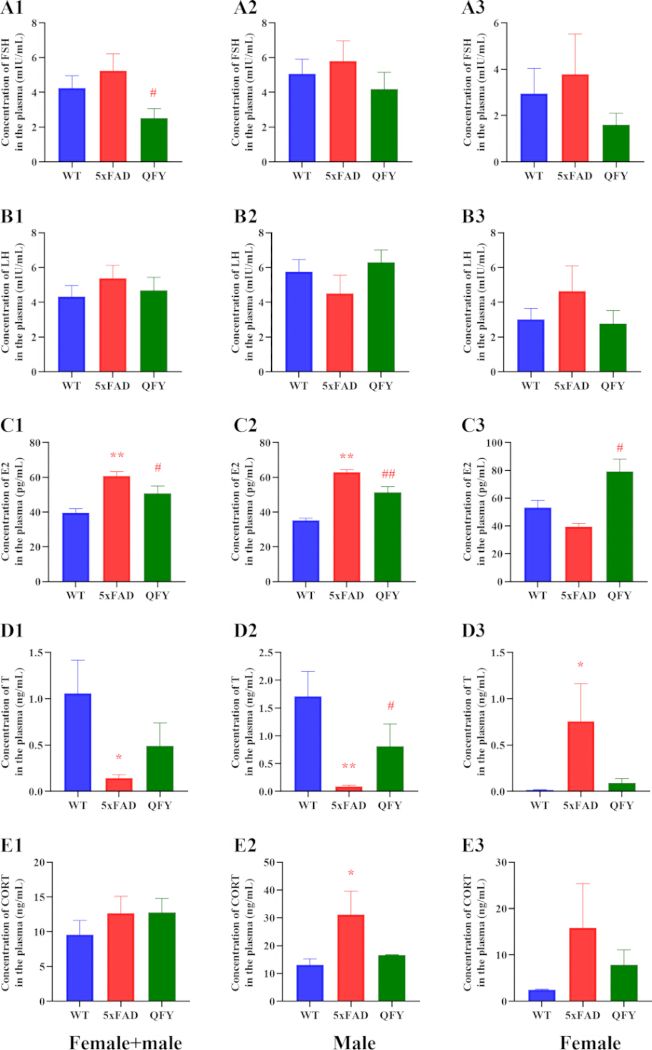
Figure 4: Effects of QFY on the level of neuroendocrine hormone in plasma of 5xFAD mice. The level of FSH (A1—A3), LH (B1—B3), E2 (C1—C3), T (D1—D3) and CORT (E1—E3) in the plasma. The values are mean ± SEM; n = 3-13. *P < 0.05, **P < 0.01, vs WT, unpaired Student’s t test; #P < 0.05, ##P < 0.01, vs 5xFAD by unpaired Student’s t test. Please click here to view a larger version of this figure.
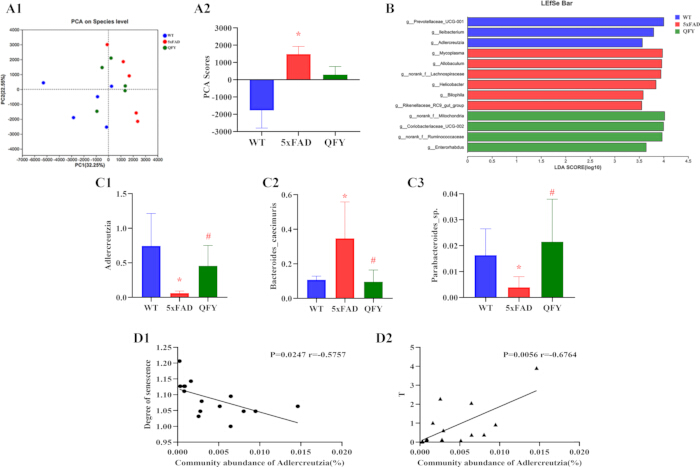
Figure 5: Effects of Qi-Fu-Yin on the abundance and diversity of gut microbiota. (A1) PCA on the Species level, the first two principal coordinates PC1 and PC2 are plotted. (A2) PCA scores according to the sample coordinates. (B) The most differentially abundant taxa in each group identified by linear discriminant analysis (LDA) scores generated from the Linear discriminant analysis effect size (LEfSe) analysis. (C1—C3) Relative abundance of Adlercreutzia, Bacteroides_caecimuris and Parabacteroides_sp. (D1—D3) Correlation between Degree of senescence or T and Adlercreutzia. The values are mean ± SEM; n = 5. *P < 0.05, vs WT, unpaired Student’s t test. Statistical significance indicators (*p < 0.05, **p < 0.01) are based on uncorrected pairwise comparisons. FDR-adjusted q-values for all comparisons are available in Supplementary Table 1. Please click here to view a larger version of this figure.
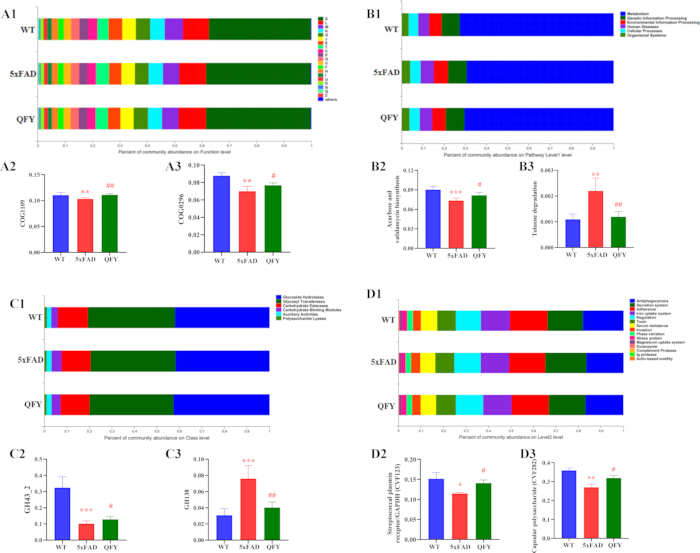
Figure 6: Effects of QFY on the metagenomic function of 5xFAD mice. (A1) Percent of community abundance on function level. (A2—A3) The relative abundance of COG1109 (Phosphoglucosamine mutase) and COG0296 (Alpha-amylase). A: RNA processing and modification; B: Chromatin structure and dynamics; C: Energy production and conversion; D: Cell cycle control, cell division, chromosome partitioning; E: Amino acid transport and metabolism; F: Nucleotide transport and metabolism; G: Carbohydrate transport and metabolism; H: Coenzyme transport and metabolism; I: Lipid transport and metabolism; J: Translation, ribosomal structure and biogenesis; K: Transcription; L: Replication, recombination and repair; M: Cell wall/membrane/envelope biogenesis; N: Cell motility; O: Post-translational modification, protein turnover, chaperones; P: Inorganic ion transport and metabolism; Q: Secondary metabolites biosynthesis, transport and catabolism; S: Function unknown; T: Signal transduction mechanisms; U: Intracellular trafficking, secretion, and vesicular transport; V: Defense mechanisms; W: Extracellular structures; Y: Nuclear structure; Z: Cytoskeleton. (B1) Percent of community abundance on Pathway level 1. (B2—B3) Acarbose and validamycin biosynthesis, Toluene degradation. (C1) Percent of community abundance on class level. (C2—C3) GH 43-2 and GH 138. (D1) Percent of community abundance on class level. (D2—D3) Streptococcal plasmin receptor/GAPDH and Capsular polysaccharide. The values are mean ± SEM; n = 5. *P < 0.05, **P < 0.01, ***P < 0.001 vs WT group, #P < 0.05, ##P < 0.01 vs 5xFAD group by unpaired Student’s-t test. Statistical significance indicators (*p < 0.05, **p < 0.01) are based on uncorrected pairwise comparisons. FDR-adjusted q-values for all comparisons are available in Supplementary Table 1. Please click here to view a larger version of this figure.
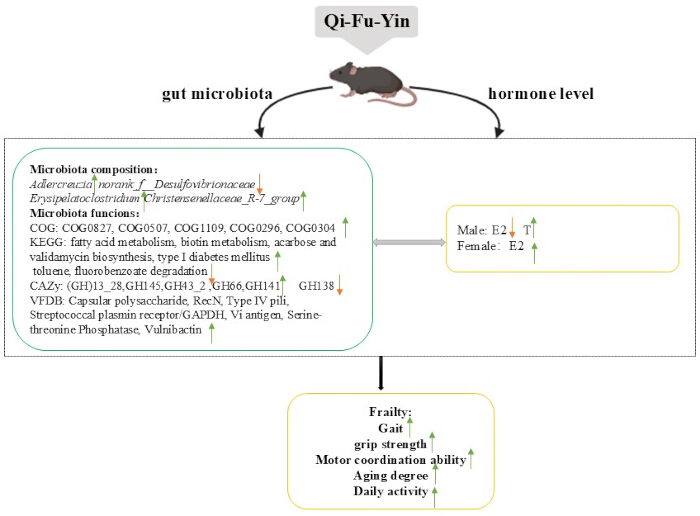
Figure 7: Effects of QFY on frailty of 5xFAD transgenic mice by regulating the crosstalk between neuroendocrine function and gut microbiota. Please click here to view a larger version of this figure.
| Taxonomic level | Species name | WT | 5xFAD | Qi-Fu-Yin |
| Proportion (Mean ± SEM) | Proportion (Mean ± SEM) | Proportion (Mean ± SEM) | ||
| Genus | Helicobacter | 0.4180 ± 0.3045 | 1.7940 ± 0.8635** | 1.4730 ± 1.1910 |
| Genus | Allobaculum | 0.1872 ± 0.0897 | 1.9320 ± 1.2820* | 1.7930 ± 0.6330 |
| Genus | Rikenellaceae_RC9_gut_group | 0.3093 ± 0.2316 | 1.0160 ± 0.2400** | 0.7394 ± 0.2243 |
| Genus | Parasutterella | 0.8497 ± 0.1855 | 0.3825 ± 0.2297** | 0.3868 ± 0.1958 |
| Genus | Adlercreutzia | 0.7441 ± 0.4686 | 0.0612 ± 0.0303** | 0.4571 ± 0.2938# |
| Genus | Rikenella | 0.1431 ± 0.0871 | 0.6184 ± 0.4236* | 0.4428 ± 0.1970 |
| Genus | Blautia | 0.0238 ± 0.0173 | 0.2105 ± 0.1116** | 0.1157 ± 0.1007 |
| Genus | Anaerotruncus | 0.0287 ± 0.0075 | 0.0956 ± 0.0402** | 0.1146 ± 0.0569 |
| Genus | norank_f__Eubacterium_coprostanoligenes_group | 0.0345 ± 0.0271 | 0.0021 ± 0.0032* | 0.0042 ± 0.0058 |
| Genus | norank_f__norank_o__norank_c__Clostridia | 0.0298 ± 0.0167 | 0.0066 ± 0.0105* | 0.0362 ± 0.0318 |
| Genus | unclassified_c__Bacilli | 0.0029 ± 0.0042 | 0.0194 ± 0.0081** | 0.0179 ± 0.0127 |
| Genus | Harryflintia | 0.0045 ± 0.0036 | 0.0172 ± 0.0098* | 0.0114 ± 0.0096 |
| Genus | norank_f__Desulfovibrionaceae | 0.3140 ± 0.1372 | 0.5861 ± 0.2259 | 0.2205 ± 0.0904## |
| Genus | Erysipelatoclostridium | 0.0434 ± 0.0323 | 0.0182 ± 0.0094 | 0.1362 ± 0.0700## |
| Genus | Christensenellaceae_R-7_group | 0.0081 ± 0.0084 | 0.0006 ± 0.0014 | 0.0198 ± 0.0160# |
Table 1: Relative abundance of selected bacterial genera in the gut microbiota of WT, 5xFAD, and QFY-treated 5xFAD mice. Data are presented as the mean ± SEM (n = 5 per group). Raw pairwise P-values were calculated using a two-tailed unpaired Student’s t-test. *P < 0.05 and **P < 0.01 versus the WT group; #P < 0.05 and ##P < 0.01 versus the 5xFAD group. WT, wild type; QFY, Qi-Fu-Yin; SEM, standard error of the mean.
Supplementary Figure 1: The number and diversity of gut microbiota of each group. (A) Alpha diversity analysis of species abundance. (B) Alpha diversity analysis of diversity. (C) Rank-Abundance curves of species and community evenness. Please click here to download this file.
Supplementary Table 1: Raw p-values and FDR-adjusted q-values for pairwise comparisons of species-level taxa and functional categories. Please click here to download this file.
Dyskusja
The present study systematically evaluated the therapeutic effects of QFY on frailty in 5xFAD mice. Our findings demonstrated that QFY not only ameliorated multiple behavioral and physiological frailty parameters but also was associated with concurrent modulation of neuroendocrine imbalances and restructuring of gut microbiota composition and functional potential. These results suggest that the anti-frailty effects of QFY may involve a gut–hormone–brain axis, offering a novel perspective on the multifaceted pharmacology of this traditional medicine. However, given the correlative nature of the data, the proposed mechanistic model remains speculative and requires functional validation. Frailty is characterized by the degradation of systemic physiological functions. It is possible to detect individuals susceptible to developing more severe forms of AD and to measure the outcomes of existing and anticipated AD treatments by assessing frailty status9. Numerous studies show that the characteristics of the frailty phenotype include reduced grip strength23, loss of endurance, decreased balance and mobility, unsteady gait, and more7. Previous studies have shown that 5xFAD mice at 11–13 months of age had reduced grip strength, impaired motor coordination, and gait impairment compared to WT mice24. At 9—10 months of age, 5xFAD mice performed worse in the rotarod test. At 12—13 months of age, 5xFAD mice were less mobile. At 15—16 months of age, 5xFAD mice exhibited impaired grip strength. The development of motor dysfunction was similar in male and female 5xFAD mice25. In this study, 5xFAD mice exhibited significant impairments in gait parameters, grip strength, rotarod performance, and nesting ability, along with elevated aging scores, collectively indicating a frailty-like phenotype. Notably, QFY treatment, particularly at medium and high doses, broadly reversed these deficits, improving stride length, swing speed, stand index, and body speed variations, which are critical indicators of neuromuscular coordination and locomotor efficiency. The efficacy of QFY was comparable or superior to donepezil, a standard acetylcholinesterase inhibitor, in several parameters, suggesting that QFY may exert its effects through mechanisms beyond cholinergic modulation.
The rotarod test results indicated that only the middle dose of QFY significantly prolonged fall latency, whereas the nest-building test showed that low and medium doses were more effective in restoring daily activity. This dose-dependent discrepancy may reflect differential sensitivity of motor and cognitive circuits to QFY components, or nonlinear pharmacokinetic properties. Notably, the middle dose used in this study corresponds to the clinically equivalent dose commonly prescribed for patients, which may explain its optimal efficacy in tasks requiring coordinated motor learning and balance, such as the rotarod test. Accumulating evidence indicates that gut microbiota dysbiosis contributes to aging-related frailty and neurodegeneration through the microbiota–gut–brain axis26. Studies conducted in a mouse model of muscle wasting demonstrated that age-related alterations in the gut microbiota can contribute to frailty through multiple mechanisms27. The severity of the frailty syndrome is negatively related with gut microbiota diversity28. Regarding gut microbiota alterations, multiple studies have demonstrated that 5xFAD mice exhibit significant gut dysbiosis compared to wild-type littermates. These changes include reduced abundance of short-chain fatty acid (SCFA)-producing bacteria such as Bifidobacteriaceae and Erysipelotrichaceae, and increased abundance of Lachnospiraceae29. Importantly, these microbial alterations correlate with neuroinflammation and cognitive deficits through the gut-brain axis30. In our study, 5xFAD mice exhibited a distinct gut microbial community structure compared to WT mice, characterized by decreased abundances of Adlercreutzia and Parabacteroides sp. and increased abundance of Bacteroides caecimuris. These alterations are consistent with previous reports of reduced anti-inflammatory and butyrate-producing taxa in AD models31. Intriguingly, QFY administration modulates the abundance of these key taxa, suggesting a prebiotic-like effect that rebalances the microbial ecosystem. The negative correlation between Adlercreutzia abundance and both senescence score and serum testosterone (T) levels is particularly noteworthy. Adlercreutzia is known to produce equol from daidzein, a phytoestrogen with neuroprotective and anti-aging properties32. QFY administration significantly restored the abundance of these key taxa.
The levels of FSH, LH, E2, T and Cort change with age33. Numerous studies have linked hormonal changes to the process of gradual aging34,35. Pawlikowski et al. suggest that elevated HPA hormone levels are an essential component of aging and are involved in the pathogenesis of several age-related diseases36. The 5xFAD mice displayed marked hormonal aberrations, including elevated E2 and CORT, and sexually dimorphic changes in T levels. Such neuroendocrine disruptions are characteristic of aging and AD, where hypothalamic–pituitary–gonadal (HPG) and hypothalamic–pituitary–adrenal (HPA) axis dysfunctions accelerate metabolic and cognitive decline37. QFY treatment effectively reduced E2 in males and total cohort, while increasing T in males, and paradoxically raised E2 in females. This sex-specific modulation suggests that QFY may act as an adaptogen, restoring hormonal homeostasis depending on the basal state. Elevated CORT, a marker of chronic stress, was observed in 5xFAD mice, though QFY did not significantly lower it in the pooled analysis. However, the trend toward normalization in individual groups warrants further investigation with larger sample sizes. Several studies have shown that significant fluctuations and changes in circulating T and E2 contribute along with other biological mechanisms to the appearance of frailty through a variety of basic ageing mechanisms at the cellular, tissue, organ and systemic levels38. Altered concentrations of sex hormones not only influence body composition but also increase the risk of developing frailty syndromes39. The progressive reduction of T levels also triggers a series of negative consequences: altered body protein maintenance, decreased fitness for exercise/fight40, diminished cognitive functioning41, lower incentive and eligibility for mating, and a growing number of metabolic disorders42. On the other hand, numerous studies have found that T administration to postmenopausal women improves sexual function43,44,45, but few studies have investigated the effects of T on body composition, muscle performance, and physical function in women. Huang et al. reported that T moderated the increase in strength in postmenopausal women46, suggesting that T has the potential to improve body composition and physical function in women. These results underscore the importance of considering sex as a biological variable in frailty research and therapeutic development.
A growing body of literature supports a bidirectional interplay between gut microbiota and host hormones47,48,49. Estrogen promotes the secretion of immunoglobulin A (IgA) to affect gut microbiota, and estrogen receptors also play an important role in maintaining gut microbiota homeostasis50. Androgen deficiency changes the composition of the gut microbiota51. In vitro, androgens may inhibit the growth of Lactobacillus genus52. Our Pearson correlation analysis revealed that Adlercreutzia abundance was negatively correlated with T levels, suggesting that microbial composition may influence androgen metabolism or reflect hormonal shifts. Conversely, sex hormones shape the gut microbiota composition, with T and E2 modulating immune responses and epithelial barrier function that affect microbial niches53. In our study, QFY-induced restoration of Adlercreutzia and other taxa likely contributed to the rebalancing of T and E2 levels, creating a virtuous cycle that reduces frailty.
Furthermore, the functional metagenomic analysis showed that QFY corrected the depletion of carbohydrate-active enzymes (e.g., GH43_2) and biosynthetic pathways (e.g., acarbose/validamycin), which are involved in energy harvest and microbial competition. These functions are tightly linked to hormone-sensitive metabolic processes, such as insulin sensitivity and adiposity, which are influenced by androgens and estrogens54. The restoration of virulence factors (e.g., CVF123 and CVF282) by QFY may also reflect a healthier microbial equilibrium, reducing pathogenic potential and systemic inflammation that could otherwise disrupt endocrine axes. The present findings have several potential translational implications for the clinical use of QFY in AD patients with frailty. First, the multi-target effects of QFY observed in this study—simultaneously improving physical frailty (grip strength, motor coordination, gait), daily activity (nesting), and aging-related phenotypes—suggest that QFY may be particularly suitable for AD patients presenting with frailty syndrome, a population often underrepresented in clinical trials. Second, the dose-dependent efficacy observed here, particularly the optimal effect of the clinically equivalent dose (5.6 g/kg), supports the current clinical dosing regimen and provides preclinical justification for its use. Third, the modulation of gut microbiota and neuroendocrine function by QFY suggests potential biomarkers (e.g., Adlercreutzia abundance, E2/T levels) that could be monitored in future clinical studies to assess treatment response.
Several limitations should be acknowledged. First, while our data reveals significant correlations between QFY-modulated gut microbiota (e.g., Adlercreutzia) and frailty-related phenotypes, these findings remain descriptive and correlative. We cannot establish a causal relationship between microbial restoration and frailty improvement based solely on 16S sequencing and hormone measurements, as no functional intervention experiments, such as fecal microbiota transplantation, microbial depletion by antibiotics, or targeted hormone receptor blockade, were performed to validate the proposed gut–hormone–brain axis. Second, although data were collected and presented separately for male and female mice, formal statistical interaction testing was not performed due to the sample size in each sex subgroup; the observed treatment effects were generally consistent across sexes, and the expected basal differences in sex hormones reflected normal physiological dimorphisms. Therefore, the mechanistic model discussed here is speculative and should be interpreted as hypothesis-generating rather than definitive. Future studies employing gnotobiotic models, pathway-specific inhibitors, and larger sample sizes, designed for sex-based interaction analyses, are warranted to dissect the causal links among QFY, gut microbiota, and host physiology. Overall, our study indicates that the anti-frailty effects of QFY in 5xFAD transgenic mice are associated with restoration of neuroendocrine imbalances and concurrent changes in gut microbial composition and function (Figure 7). These findings suggest that QFY may influence crosstalk between neuroendocrine function and the gut microbiota in 5xFAD mice.
Oświadczenia
The authors declare no competing interests.
Author Contributions:
Xiaorui Cheng designed and supervised the study, modified the manuscript. Tianyuan Ye wrote and modified the manuscript. Xiuzhao Yang supervised and carried out all the experiments and wrote the manuscript. Yun He, Junqi Zhao and Jing Wang contributed to conducting some of behavioral tests.
Podziękowania
This work was supported by National Natural Science Foundation of China General Program Grant (No.82374062), Key Research and Development Program of Tibet Autonomous Region Science and Technology Plan Project (XZ202601ZY0167), Shandong Provincial Natural Science Foundation (ZR2026MS1293), Shandong Province Traditional Chinese Medicine Science and Technology Project (M20251730) ,Central Government Guides Local Science and Technology Development Fund (No. YDZX2023137).
Materiały
| Nazwa | Firma | Numer katalogowy | Komentarze |
|---|---|---|---|
| 125I-LH RIA kit and 125I-FSH RIA kit | Beijing furuirunze biology technology | Used to measure plasma luteinizing hormone (LH) and follicle-stimulating hormone (FSH) by radioimmunoassay. | |
| 5xFAD mice | Jackson Laboratory | Stock No. 034840 | 5xFAD transgenic mouse model of Alzheimer’s disease. |
| ABI GeneAmp® 9700 thermal cycler | Applied Biosystems | Used for PCR amplification of the bacterial 16S rRNA V3–V4 region. | |
| AxyPrep DNA Gel Extraction Kit | Axygen Biosciences | Used to purify excised 16S rRNA amplicons from agarose gels. | |
| CatWalk XT system | Noldus Information Technolog | Used for automated gait analysis. | |
| Enzyme-linked immunosorbent assay (ELISA) kits | CUSABIO | CSB-E07969m, CSB-E05109m, and CSB-E05101m | Used to quantify plasma corticosterone (CORT), estradiol (E2), and testosterone (T) by ELISA. |
| E.Z.N.A.® Soil DNA Kit | Omega Bio-tek | Used to extract microbial genomic DNA from fecal samples. | |
| Full-wavelength microplate reader | Thermo Scientific | MT90126728 | Used to measure ELISA optical density at 450 nm. |
| Grip strength measuring instrument | Beijing Zhongshidichuang Technology Development Co., Ltd. | 1056049 | Used to measure mouse forelimb grip strength. |
| Illumina MiSeq PE300 or NovaSeq PE250 platform | Illumina | Used for paired-end sequencing. | |
| Mouse Rod Milling Fatigue Tester | Beijing Zhongshidichuang Technology Development Co., Ltd. | ZS-RDM | Rotarod apparatus used to evaluate motor coordination and balance. |
| NanoDrop 2000 spectrophotometer | Thermo Fisher Scientific | Used to assess DNA concentration and purity. | |
| One ten-millionth of an electronic balance | Ohaus Instruments (Changzhou) Co., Ltd. | EX225ZH/AD | Used for high-precision weighing of QFY materials and laboratory reagents. |
| Quantus™ Fluorometer | Promega | Used to quantify purified amplicons before sequencing. | |
| SuperMazeV3.0 Animal Behavior Video Analysis System | Shanghai Xinhuan Information Technology Co., Ltd. | Used for video-based recording and analysis of mouse behavioral activity. |
Bibliografia
- Zhang X, et al. Differential methylation of circRNA m6A in an APP/PS1 Alzheimer's disease mouse model. Mol Med Rep. 2023;27(2):55.
- Yang J, et al. Association of accelerated long-term forgetting and senescence-related blood-borne factors in asymptomatic individuals from families with autosomal dominant Alzheimer's disease. Alzheimers Res Ther. 2021;13(1):107.
- Varesi A, et al. Non-enzymatic antioxidants against Alzheimer's disease: prevention, diagnosis and therapy. Antioxidants (Basel). 2023;12(1):180.
- Panza F, et al. Different cognitive frailty models and health- and cognitive-related outcomes in older age: from epidemiology to prevention. J Alzheimers Dis. 2018;62(3):993-1012.
- Raudino F. Non-cognitive symptoms and related conditions in Alzheimer's disease: a literature review. Neurol Sci. 2013;34(8):1275-1282.
- Lobo A, et al. Non-cognitive psychopathological symptoms associated with incident mild cognitive impairment and dementia, Alzheimer's type. Neurotox Res. 2008;14(2-3):263-272.
- Lang PO, Michel JP, Zekry D. Frailty syndrome: a transitional state in a dynamic process. Gerontology. 2009;55(5):539-549.
- Lipsitz LA. Dynamic models for the study of frailty. Mech Ageing Dev. 2008;129(11):675-676.
- Todorovic S, et al. Frailty index and phenotype frailty score: sex- and age-related differences in 5xFAD transgenic mouse model of Alzheimer's disease. Mech Ageing Dev. 2020;185:111195.
- Wang G. Treating 33 cases of pulp-sea empty type Alzheimer's disease with acupuncture combined with Qifu decoction. Zhejiang Journal of Traditional Chinese Medicine. 2018;53:205.
- Wang JM. Treatment of 32 cases of senile dementia with Jiawei Qifuyin [Article in Chinese]. Liaoning Journal of Traditional Chinese Medicine. 2002;29:43.
- Wang L, et al. Is Qi Fu Yin effective in clinical treatment of dementia? A meta-analysis of 697 patients. Medicine (Baltimore). 2021;100(5):e24526.
- Wang SY, et al. Qifu-Yin attenuates AGEs-induced Alzheimer-like pathophysiological changes through the RAGE/NF-κB pathway. Chin J Nat Med. 2014;12(12):920-928.
- Liu JP, Wang Q, Hu Z, Wang S, Ma S. Effect of Qifu Yin on the AGEs/RAGE/NF-κB pathway in an Alzheimer's disease rat model. Pharmacology and Clinics of Chinese Materia Medica. 2015;31:9-11.
- Xing GH, Lin CR, Zhang XJ, Niu YC, Li XY. Protective effect of Qifu Yin on neuronal apoptosis in rats with Alzheimer's disease induced by beta-amyloid hippocampus. Chinese Journal of Experimental Traditional Medical Formulae. 2010;16:138-141.
- Xiao QY, et al. Effects of Qi-Fu-Yin on aging of APP/PS1 transgenic mice by regulating the intestinal microbiome. Front Cell Infect Microbiol. 2022;12:1048513.
- Yang X, et al. Qi-fu-yin attenuated cognitive disorders in 5xFAD mice of Alzheimer's disease animal model by regulating immunity. Front Neurol. 2023;14:1183764.
- Li H, et al. Identification of chemical components of Qi-Fu-Yin and its prototype components and metabolites in rat plasma and cerebrospinal fluid via UPLC-Q-TOF-MS. Evid Based Complement Alternat Med. 2021;2021:1995766.
- Oakley H, et al. Intraneuronal beta-amyloid aggregates, neurodegeneration, and neuron loss in transgenic mice with five familial Alzheimer's disease mutations: potential factors in amyloid plaque formation. J Neurosci. 2006;26(40):10129-10140.
- Yu X, et al. Pinostilbene inhibits lung epithelial-mesenchymal transition and delays pulmonary fibrosis by modulating the PI3K/Akt pathway. Front Pharmacol. 2025;16:1614546.
- Takeda T, et al. A new murine model of accelerated senescence. Mech Ageing Dev. 1981;17(2):183-194.
- Hosokawa M, et al. Grading score system: a method for evaluation of the degree of senescence in senescence-accelerated mouse (SAM). Mech Ageing Dev. 1984;26(1):91-102.
- Zheng Z, et al. Physical frailty, genetic predisposition, and incident Parkinson disease. JAMA Neurol. 2023;80(5):455-461.
- O'Leary TP, et al. Motor function deficits in the 12-month-old female 5xFAD mouse model of Alzheimer's disease. Behav Brain Res. 2018;337:256-263.
- O'Leary TP, et al. Age-related deterioration of motor function in male and female 5xFAD mice from 3 to 16 months of age. Genes Brain Behav. 2020;19(3):e12538.
- Cryan JF, et al. The microbiota-gut-brain axis. Physiol Rev. 2019;99(4):1877-2013.
- Ticinesi A, et al. Aging gut microbiota at the cross-road between nutrition, physical frailty, and sarcopenia: is there a gut-muscle axis? Nutrients. 2017;9(12):1303.
- Maffei VJ, et al. Biological aging and the human gut microbiota. J Gerontol A Biol Sci Med Sci. 2017;72(11):1474-1482.
- Gu X, et al. Intestinal endogenous metabolites affect neuroinflammation in 5xFAD mice by mediating the "gut-brain" axis and the intervention with Chinese medicine. Alzheimers Res Ther. 2024;16(1):222.
- Wyatt-Johnson SK, et al. The MR1/MAIT cell axis impacts the gut-brain axis through both cognition and microbial community structure in 5xFAD mice. Alzheimers Dement. 2025;21(7):e70493.
- Zhuang ZQ, et al. Gut microbiota is altered in patients with Alzheimer's disease. J Alzheimers Dis. 2018;63(4):1337-1346.
- Mayo B, Vázquez L, Flórez AB. Equol: a bacterial metabolite from the daidzein isoflavone and its presumed beneficial health effects. Nutrients. 2019;11(9):2231.
- Dhindsa SS, Irwig MS, Wyne K. Gonadopenia and aging in men. Endocr Pract. 2018;24(4):375-385.
- Tosato M, et al. The aging process and potential interventions to extend life expectancy. Clin Interv Aging. 2007;2(3):401-412.
- Weinert BT, Timiras PS. Invited review: theories of aging. J Appl Physiol (1985). 2003;95(4):1706-1716.
- Pawlikowski M, Winczyk K. Possible role of gonadotropin excess in age-related diseases-return to the old hypothesis in the light of current data. Neuro Endocrinol Lett. 2020;41(3):118-122.
- Peng X, et al. Frailty and testosterone level in older adults: a systematic review and meta-analysis. Eur Geriatr Med. 2022;13(3):663-673.
- García-Sánchez J, Mafla-España MA, Torregrosa MD, Cauli O. Androstenedione and follicle-stimulating hormone concentration predict the progression of frailty syndrome at one-year follow-up in patients with localized breast cancer treated with aromatase inhibitors. Biomedicines. 2022;10(7):1634.
- Eichholzer M, et al. Serum sex steroid hormones and frailty in older American men of the Third National Health and Nutrition Examination Survey (NHANES III). Aging Male. 2012;15(4):208-215.
- Chasland LC, et al. Testosterone and exercise: effects on fitness, body composition, and strength in middle-to-older-aged men with low-normal serum testosterone levels. Am J Physiol Heart Circ Physiol. 2021;320(5):H1985-H1998.
- Hua JT, Hildreth KL, Pelak VS. Effects of testosterone therapy on cognitive function in aging: a systematic review. Cogn Behav Neurol. 2016;29(3):122-138.
- Borras C, et al. Direct antioxidant and protective effect of estradiol on isolated mitochondria. Biochim Biophys Acta. 2010;1802(1):205-211.
- Shifren JL, et al. Transdermal testosterone treatment in women with impaired sexual function after oophorectomy. N Engl J Med. 2000;343(10):682-688.
- Davis SR, et al. Testosterone for low libido in postmenopausal women not taking estrogen. N Engl J Med. 2008;359(19):2005-2017.
- Shifren JL, et al. Testosterone patch for the treatment of hypoactive sexual desire disorder in naturally menopausal women: results from the INTIMATE NM1 Study. Menopause. 2006;13(5):770-779.
- Huang G, et al. Testosterone dose-response relationships in hysterectomized women with or without oophorectomy: effects on sexual function, body composition, muscle performance and physical function in a randomized trial. Menopause. 2014;21(6):612-623.
- Markle JG, et al. Sex differences in the gut microbiome drive hormone-dependent regulation of autoimmunity. Science. 2013;339(6123):1084-1088.
- Bolnick DI, et al. Individual diet has sex-dependent effects on vertebrate gut microbiota. Nat Commun. 2014;5:4500.
- Elderman M, et al. The effect of age on the intestinal mucus thickness, microbiota composition and immunity in relation to sex in mice. PLoS One. 2017;12(9):e0184274.
- Pace F, Watnick PI. The interplay of sex steroids, the immune response, and the intestinal microbiota. Trends Microbiol. 2021;29(9):849-859.
- Harada N, et al. Hypogonadism alters cecal and fecal microbiota in male mice. Gut Microbes. 2016;7(6):533-539.
- Mu Q, et al. Control of lupus nephritis by changes of gut microbiota. Microbiome. 2017;5(1):73.
- Gomez A, et al. Loss of sex- and age-driven differences in the gut microbiome characterize arthritis-susceptible 0401 mice but not arthritis-resistant 0402 mice. PLoS One. 2012;7(4):e36095.
- Tremaroli V, Backhed F. Functional interactions between the gut microbiota and host metabolism. Nature. 2012;489(7415):242-249.