This protocol combines in situ heavy-water (D₂O) labeling with single-cell Raman spectroscopy to detect and quantify metabolically active bacteria directly in native soil.
Artykuł metodologiczny
Single-Cell Detection and Quantification of Metabolically Active Bacteria in Soil Using Heavy-Water Labeling and Raman Microspectroscopy
W tym artykule
Podsumowanie
Streszczenie
Only microorganisms that are metabolically active during a defined observation window contribute directly to ongoing soil processes, yet this active fraction is difficult to quantify. Cultivation excludes uncultured taxa, deoxyribonucleic acid (DNA)-based methods primarily describe community membership and functional potential, and bulk assays obscure cell-to-cell variation. This protocol combines heavy-water (D₂O) labeling with single-cell Raman microspectroscopy, here termed Raman-deuterium isotope probing (Raman-DIP), to detect and quantify bacterial anabolic activity during labeling in soil. Matched soil samples are incubated under identical conditions with H₂O or D₂O. Microbial cells are then recovered by Nycodenz density separation, deposited on aluminum-coated slides, and analyzed individually. Deuterium incorporation into newly synthesized biomass produces a carbon-deuterium (C-D) band at 2,040–2,300 cm⁻¹. A cell is classified as detectably active when its C-D ratio exceeds a threshold derived from the matched H₂O control, and the active-cell fraction is calculated for each biological replicate. The method retains soil-matrix effects during labeling, does not require cultivation or a fluorescent activity probe, and reveals physiological heterogeneity that is lost in community-averaged measurements. Because D₂O supplies an isotopic label rather than an exogenous organic substrate, it can label diverse anabolic processes while limiting selection for a particular carbon source. The workflow is therefore suited to standardized comparisons of bacterial activity across soils and environmental treatments. It reports anabolic incorporation during the labeling interval rather than overall viability; nonlabeled cells should not automatically be interpreted as dead.
Wprowadzenie
Soil microbial communities contain cells spanning a continuum of physiological states, from rapidly growing to maintenance-active, dormant, damaged, and dead1. The cells that synthesize new biomass during a defined period constitute an operationally measurable active fraction and are the most immediate contributors to ongoing carbon, nitrogen, and phosphorus transformations2. Their activity can change rapidly with moisture, temperature, nutrient availability, plant inputs, and disturbance3,4,5,6. Quantifying this fraction is therefore essential for linking community composition to realized soil processes. DNA from dormant or dead cells and extracellular relic DNA, however, can cause measurements of community membership to diverge from current cellular activity7.
Available methods answer related but different questions. Cultivation-based measurements recover only organisms that grow under the selected laboratory conditions8. Quantitative polymerase chain reaction (PCR) and metagenomic sequencing identify genes and taxa, but do not independently establish whether the detected cells are synthesizing biomass at the time of sampling7. Community-level respiration, adenosine triphosphate (ATP), and enzyme assays quantify aggregate activity but cannot show whether the signal arises from most cells or from a small, highly active subpopulation9. Single-cell approaches, such as bioorthogonal noncanonical amino acid tagging coupled with fluorescence-activated cell sorting (BONCAT-FACS) can identify translationally active cells, but they require uptake of a noncanonical amino acid followed by click labeling10. A complementary method that uses a broadly available tracer and an intrinsic single-cell readout is therefore valuable for measuring the active fraction and resolving physiological heterogeneity in soil.
Single-cell Raman microspectroscopy records a biochemical fingerprint generated by the inelastic scattering of light from molecular bonds within an individual cell. Stable-isotope incorporation shifts defined spectral features and converts this fingerprint into a functional readout11. Raman-DIP has been applied across diverse microbial systems, including environmental samples, antimicrobial-response assays, drought-responsive soil microbiomes, and Raman-activated cell-sorting workflows12,13,14,15,16,17. During incubation with D₂O, bacteria that synthesize new cellular material incorporate deuterium into proteins, lipids, nucleic acids, and other biomolecules18. The resulting carbon-deuterium bonds generate a C-D band at 2,040–2,300 cm⁻1 within the Raman-silent region11,18. Normalizing this signal to the carbon-hydrogen (C-H) region provides a single-cell C-D ratio that reflects the integrated extent of D₂O-derived isotope incorporation into newly synthesized biomass during the labeling interval; it does not resolve the contributions of individual biosynthetic pathways. Because D₂O contributes an isotope of water rather than a specific organic carbon substrate, Raman-DIP can detect activity in both autotrophic and heterotrophic microorganisms while reducing substrate-selection bias19.
In this workflow, isotope labeling occurs in the soil matrix before cells are recovered for Raman analysis. This design retains the effects of soil mineralogy, organic matter, moisture, and nutrient availability during the labeling interval while avoiding the cultivation step, which can select for a small subset of the community. The principal strengths are a direct readout of realized anabolic activity, single-cell resolution, quantification of the active-cell fraction, and compatibility with downstream function-targeted cell recovery on dedicated Raman-activated sorting platforms. The method is applicable to standardized comparisons among soil types, management practices, environmental gradients, and experimental treatments. Selective nutrient or stress conditions can also be introduced to identify responsive functional populations, provided that the condition, D₂O fraction, and labeling time are independently validated. Raman-DIP does not by itself provide taxonomic identity, an absolute metabolic rate, or a universal measure of viability; these questions require complementary total-cell counts, cell sorting, sequencing, or other orthogonal measurements19.
Protokół
CAUTION: Treat all soil samples as potentially containing opportunistic microorganisms. Follow institutional biosafety procedures, wear appropriate personal protective equipment, and disinfect or dispose of all soil suspensions and consumables in accordance with local regulations.
1. Prepare soil samples and matched labeling solutions
- Collect fresh soil in sterile containers. Remove visible roots and stones, and pass the soil through a 2 mm sieve.
- Record the time between soil collection and labeling, the initial gravimetric water content, and the soil temperature at the sampling site.
- Dispense an amount equivalent to 1.00 g of dry soil into each sterile incubation vessel. Prepare at least three independently incubated biological replicates for each labeling condition.
- Calculate the volume of liquid required to reach the predefined gravimetric water content. Keep the final water content identical between the H₂O and D₂O conditions. For the reference setup using air-dried soil, add 200 µL of liquid to 1.00 g of dry soil to achieve an approximately 20% gravimetric water content.
- Prepare equal-volume H₂O and D₂O labeling solutions. For the H₂O control, use 200 µL of sterile water. For the D₂O condition, mix 100 µL of D₂O with 100 µL of sterile water to obtain a 50% (v/v) D₂O solution in the added liquid.
NOTE: Use fresh soil when the objective is to characterize activity close to the sampled condition, and account for the initial pore water when calculating the final D₂O fraction and moisture content. Air-dried soil may be used for standardized experiments; interpret the measured activity in the context of drying and subsequent moisture adjustment.
2. Label bacterial anabolic activity with D₂O
- Distribute the predetermined volume of H₂O or D₂O labeling solution evenly over the surface of each soil sample.
- Mix each sample gently to distribute the added liquid uniformly without compacting the soil.
- Seal the incubation vessels and incubate the samples for 24 h at 28 °C for the reference workflow.
- At the end of the labeling interval, proceed immediately to cell extraction. Process all samples consistently.
NOTE: Use 28 °C for 24 h as the standardized reference condition for this workflow. Adjust and validate the incubation conditions when the experimental context differs substantially from the reference condition.
3. Recover microbial cells from soil
- Add 5 mL of 0.02% (v/v) Tween 20 in phosphate-buffered saline (PBS) to each labeled sample containing the equivalent of 1.00 g of dry soil.
- Vortex each suspension vigorously for 30 min to detach microbial cells from the soil particles.
- Transfer the entire soil suspension to a high-speed centrifuge tube.
- Carefully underlay the suspension with 5 mL of 0.8 g/mL Nycodenz solution. Maintain a sharp interface and avoid mixing the layers.
- Centrifuge the layered sample at 8,000 × g for 60 min at 4 °C using minimal braking.
- Carefully collect the middle, cell-containing layer using a sterile pipette and transfer it to a clean tube without disturbing the soil pellet.
- Wash the recovered cell fraction three times with sterile deionized water. Centrifuge and resuspend the pellet during each wash.
- After the final wash, resuspend the cell pellet in a validated and recorded volume of sterile deionized water.
4. Prepare slides for single-cell Raman measurement
- Place a clean aluminum-coated microscope slide on a dust-free, level surface.
- Pipette 2 µL of the washed cell suspension onto the slide.
- Allow the spotted suspension to air-dry completely at room temperature in a dust-free environment.
- Before spectral acquisition, identify fields containing spatially separated, intact cells with typical bacterial size and morphology and minimal mineral debris.
NOTE: Dilute suspensions that contain overlapping cells. Reduce the final resuspension volume when too few cells are present, and apply the same adjustment criterion across matched samples.
5. Acquire Raman spectra from individual cells
- Switch on the confocal Raman microscope and allow the optical and laser systems to stabilize according to the manufacturer's instructions.
- Calibrate the Raman-shift axis using the silicon band at 520.6 cm⁻1.
- Configure the instrument with a 532 nm neodymium-doped yttrium aluminum garnet (Nd: YAG) laser, a 300 grooves/mm grating, and a 100× air objective with a numerical aperture of 0.90.
- Set the acquisition window to 600–3,200 cm⁻1 and the integration time to 15 s per cell. Set and report the laser power at the sample, and keep the laser power, integration time, grating, objective, and all other acquisition parameters constant across matched samples.
- Acquire a background spectrum from a cell-free region of the aluminum-coated slide using the same acquisition settings.
- Focus the laser on the center of an intact, isolated cell and acquire one Raman spectrum from the cell.
- Exclude a spectrum only for a predefined technical reason, such as a dominant mineral signal, cell aggregation, excessive fluorescence, laser damage, or incomplete acquisition. Do not exclude a cell because its C-D ratio is unexpectedly high or low.
- Select cells without reference to their apparent Raman signal and sample systematically across the entire dried spot. Acquire comparable numbers of spectra from each biological replicate. Analyze at least 100 cells per replicate as a starting point; for heterogeneous samples, continue acquisition until the estimated active-cell fraction and C-D-ratio distribution stabilize, or apply a distribution-convergence method to assess sampling sufficiency14.
NOTE: Acquire spectra only from intact cells with typical bacterial size and morphology. Exclude obvious yeast-like cells, fungal hyphae, cell aggregates, and other morphologically non-bacterial structures.
6. Calculate the active-cell fraction
- Remove cosmic-ray spikes and apply identical baseline-correction parameters to all spectra.
- Integrate the baseline-corrected intensity from 2,040–2,300 cm⁻1 to obtain Area_C-D.
- Integrate the baseline-corrected intensity from 2,800–3,100 cm⁻1 to obtain Area_C-H.
- Calculate the C-D ratio for each cell using the C-H band as the internal spectral reference:
C-D ratio = Area_C-D / (Area_C-D + Area_C-H) - For each soil and analytical batch, calculate the mean + 3 SD for each matched H₂O-control biological replicate. Use the mean of these replicate-derived values as the operational D-labeling threshold.
- Classify a D₂O-exposed cell as detectably active during the labeling interval when its C-D ratio exceeds the operational threshold defined for the corresponding soil and analytical batch.
- Calculate the active-cell fraction as follows:
Active-cell fraction (%) = 100 × (number of above-threshold cells / total number of technically valid Raman-measured cells)
Report the active-cell fraction for each biological replicate before calculating the group-level summary.
NOTE: Treat the mean + 3 SD criterion as a conservative operational threshold above the H₂O-control background rather than as a universal biological activity cutoff. For replicate experiments conducted using the same soil and analytical conditions, summarize the H₂O-derived threshold estimates as a mean operational threshold. When soil matrices differ substantially in physicochemical properties, or when analytical conditions change, determine thresholds separately for each soil or analytical batch rather than applying a single numerical cutoff across matrices.
7. Analyze biological replication and report the data
- Treat independently labeled soil samples as biological replicates and individual cells as nested measurements within each replicate.
- Plot the single-cell C-D-ratio distribution and calculate the active-cell fraction separately for each biological replicate before summarizing the replicate-level estimates.
- For each sample, report the numbers of spectra acquired, excluded, and retained; the threshold value; the final D₂O fraction; the labeling time and temperature; and the predefined technical exclusion criteria.
NOTE: Do not remove a spectrum solely because its C-D ratio is unusually high or low. Retain biologically plausible values and exclude spectra only for predefined technical reasons.
Wyniki
To demonstrate single-cell detection and quantification of active soil bacteria, matched aliquots of the same soil were labeled with H₂O or D₂O for 24 h. Three independent biological replicates were analyzed, with 100 technically valid cells measured per condition in each replicate. Microbial cells were separated from the soil matrix and analyzed individually by Raman microspectroscopy. Representative spectra and the resulting single-cell C-D ratio distributions are shown in Figure 1.
Representative spectra contained characteristic cellular bands in the fingerprint region and a strong C-H band at 2,800–3,100 cm⁻1 (Figure 1A). Cells that incorporated deuterium during D₂O exposure exhibited a distinct C-D band at 2,040–2,300 cm⁻1, reflecting the synthesis of new cellular biomass. Cells without a detectable C-D band were classified as inactive under the predefined labeling conditions; however, this classification does not indicate that these cells were dead.
Threshold estimates calculated as the mean + 3 SD for the three matched H₂O-control biological replicates were 0.103, 0.106, and 0.095, yielding a mean operational threshold of 0.101 ± 0.006 (mean ± SD). Because all three biological replicates were derived from the same soil and analyzed under identical conditions, the mean threshold of 0.101 was used for classification. Using this threshold, 15%, 20%, and 19% of the D₂O-exposed cells were classified as active in biological replicates 1–3, respectively, yielding a mean active-cell fraction of 18.0 ± 2.6% (mean ± SD, n = 3 biological replicates). Figure 1B shows biological replicate 1 as a representative example, in which 15 of 100 D₂O-exposed cells exceeded the operational threshold. Thus, the reported active-cell fraction of 18.0% represents the mean across three biological replicates, rather than 18 active cells among 100 cells in a single sample.
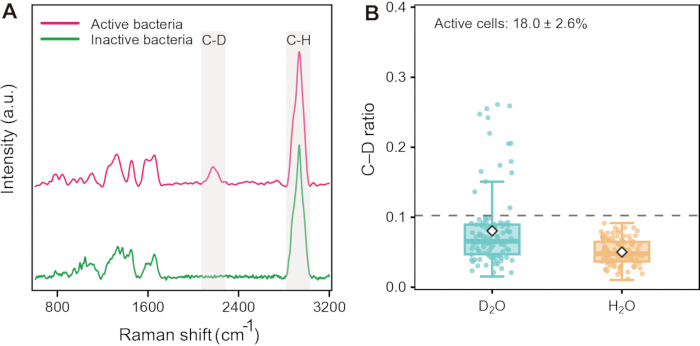
Figure 1: Single-cell detection and quantification of metabolically active bacteria in soil by Raman-DIP. (A) Representative Raman spectra of D₂O-exposed soil bacterial cells with and without detectable anabolic labeling. Shaded regions indicate the C-D band at 2,040–2,300 cm⁻1 and the C-H band at 2,800–3,100 cm⁻1. Raman intensity is expressed in arbitrary units (a.u.). Spectra are vertically offset for clarity. (B) Single-cell C-D ratios for the matched H₂O and D₂O conditions. Three independent biological replicates were analyzed, with 100 technically valid cells measured per condition in each replicate (300 H₂O-control cells and 300 D₂O-exposed cells in total). Panel B shows one representative biological replicate (replicate 1), comprising 100 H₂O-control cells and 100 D₂O-exposed cells. The C-D ratio was calculated as Area_C-D / (Area_C-D + Area_C-H). Each point represents one technically valid cell; boxes indicate the interquartile ranges, center lines indicate the medians, and white diamonds indicate the means calculated from the 100 cells shown for each condition. The gray line indicates the operational D-labeling threshold for this soil (C-D ratio = 0.101), calculated as the mean of the three H₂O-control replicate threshold estimates, with each replicate threshold defined as the mean + 3 SD. D₂O-exposed cells with C-D ratios above this threshold were classified as detectably active. In the representative replicate shown, 15 of 100 D₂O-exposed cells (15%) exceeded the threshold. Please click here to view a larger version of this figure.
| Soil type | Soil water content | D₂O proportion | Labeling time and temperature | C–D criteria | Reference |
| Beech-forest soil, Austria | Native moisture restored after 50% pre-drying | 50% (v/v) | 13 d / 23 °C | C–D ratio > 2.75% | Eichorst et al., 201518 |
| Grassland soil, Xiamen, China | N/A | 50% (v/v) | 24 h / 37 °C | — | Li et al., 201915 |
| Five arable soils, Wonju, South Korea | N/A | 40% (v/v) | 48 h / 5 °C | — | No et al., 202216 |
| Pristine and farmland soils, China | 20% (v/w soil) | 50% (v/v) | 24 h / 27 °C | — | Li et al., 202224 |
| Paddy, fluvo-aquic and red soils, China | 20% (v/w soil) | 50% (v/v) | 24 h / 37 °C | C–D ratio > 10% | Li et al., 202323 |
| Red, black and fluvo-aquic long-term field soils, China | 20% (v/w soil) | 50% (v/v) | 16 h / 27 °C | C–D ratio > 8% | Li et al., 202422 |
Table 1: Representative Raman–D₂O labeling conditions across contrasting soil types.
Dyskusja
Reliable measurement of the active-cell fraction depends on four linked controls. First, standardize the dry-weight equivalent, final moisture content, D₂O exposure, temperature, and labeling time across matched samples. Second, distribute the labeling solution uniformly to ensure comparable isotope availability among cells. Third, recover cells consistently from the Nycodenz interface while minimizing mineral carryover and taxon-dependent loss. Fourth, acquire and preprocess all spectra using fixed settings and define activity relative to a matched H₂O control. These controls are essential because the method measures deuterium incorporation relative to the technical background rather than simply detecting the presence of a cell.
Weak or absent C-D labeling can result from low initial activity, insufficient D₂O exposure, an unsuitable observation window, isotope inhibition, or poor optical focus18. Evaluate one factor at a time while retaining paired H₂O and D₂O controls. Address excessive fluorescence or dominant mineral peaks by improving density separation, adding or optimizing wash steps, and selecting cleaner regions of the dried spot rather than selectively excluding inconvenient spectra. If cells overlap, dilute the suspension before spotting; if cells are sparse, reduce the final resuspension volume. Revalidate labeling and recovery whenever the soil type, moisture content, temperature, or storage history changes.
The primary interpretive constraint of Raman-DIP is that it measures anabolic isotope incorporation during the defined labeling interval. A cell below the threshold may be dormant, maintenance-active without sufficient biomass synthesis, inhibited by the experimental conditions, or dead. Conversely, the C-D ratio is an integrated relative incorporation index and should not be interpreted as a universal metabolic rate across taxa. Because proteins, lipids, nucleic acids, and other biomolecular pools differ in synthesis and turnover during the observation window, their contributions to the integrated C-D signal are not necessarily equal. Raman-DIP does not deconvolute these pool-specific contributions; therefore, the C-D ratio is best interpreted as a composite isotope-incorporation phenotype rather than an equal-weighted measure of individual anabolic pathways. Water participates broadly in cellular biosynthesis, and Berry et al. showed that D₂O-derived deuterium is incorporated into newly synthesized biomass across phylogenetically and physiologically diverse bacteria and archaea17. Water-derived hydrogen/deuterium (H/D) can enter reductive biosynthesis through cofactors such as reduced nicotinamide adenine dinucleotide (phosphate) [NAD(P)H], whereas fixed-cell controls showed that abiotic H-D exchange does not measurably contribute to the C-D region18. Thus, detectable C-D labeling provides evidence of ongoing biological biosynthesis during the labeling interval, although the magnitude of labeling can vary with cellular physiology and should not be interpreted as an absolute metabolic rate. Nycodenz density-gradient centrifugation reduces particle interference and enables recovery of a broad bacterial fraction. Published evaluations across contrasting soils found that abundant bacterial phyla were retained, although some community-composition shifts can occur during extraction19,20. Using the same standardized recovery procedure across matched samples, therefore, supports consistent comparison of recovered-cell activity. Because soil microbial communities can exhibit substantial cell-to-cell physiological heterogeneity, single-cell measurements require sufficient sampling to represent the underlying population21. The required number of spectra, therefore, depends on community heterogeneity and should be justified using convergence or an equivalent sampling-sufficiency analysis22.
The practical value of this workflow lies in combining a broadly applicable stable-isotope tracer with a fluorescence-free, single-cell optical readout. Compared with cultivation-based approaches, the workflow includes cells that do not grow on routine media. Compared with DNA-based profiling, it reports a realized phenotype rather than genetic potential7. Compared with bulk activity assays, it reveals whether activity is broadly distributed across cells or concentrated within a subpopulation. Raman acquisition can also be non-destructive under controlled conditions, enabling function-targeted sorting and downstream identification on compatible platforms23. These strengths make Raman-DIP particularly useful when physiological heterogeneity, rather than only community-average activity, is the biological question11.
The protocol can be applied to comparisons among soils, management practices, environmental gradients, and controlled perturbations. Previous applications have demonstrated Raman–D₂O-based analysis in contrasting soil systems and experimental contexts24. Published soil-related Raman–D₂O studies span contrasting soil matrices and have used different moisture conditions, D₂O proportions, labeling times, temperatures, and C-D criteria (Table 1). Table 1 provides a compact practical guide by summarizing soil type, soil water content, D₂O proportion, labeling time and temperature, and concise non-normalized C-D criteria, where applicable, without implying universal operating limits. Because C-D calculations and normalization schemes differ among studies, numerical criteria are not directly interchangeable. Within a given soil and analytical batch, summarize H₂O-derived threshold estimates from biological replicates as a mean operational threshold. When soils differ substantially in physicochemical properties or analytical conditions change, determine thresholds separately rather than transferring a single numerical cutoff across matrices. Therefore, regard the present 28 °C, 24 h workflow as a standardized reference condition rather than a universal optimum.
Oświadczenia
The authors declare no competing interests. Generative AI was used solely for language refinement during manuscript revision. The authors reviewed and approved the final content.
Podziękowania
This work was supported by the Natural Science Foundation of Fujian Province (2024J011016).
Materiały
| Nazwa | Firma | Numer katalogowy | Komentarze |
|---|---|---|---|
| Aluminum-coated slides | HOOKE Instruments Ltd. | BS-QT-027 | Low-background Raman substrate |
| 100× objective | Olympus | 1-U2B235 | Single-cell Raman acquisition |
| 532 nm Nd:YAG laser | HORIBA | 1400-532-00 | Raman excitation source |
| Confocal Raman microscope, LabRAM Odyssey | HORIBA | 12048 | 532 nm excitation; 300 grooves/mm grating |
| Heavy water (D2O), 99 atom % D | Sigma-Aldrich | E090001 | Add 200 μL 50% D2O per 1 g soil |
| High-speed centrifuge | HERMLE Labortechnik GmbH | 311.00 V05 | Capable of 8,000 × *g* for 60 min |
| Labspec5 | HORIBA | #1300083712 | Cosmic-ray removal, baseline correction, and band integration |
| Nycodenz, ≥98% | Aladdin | I47910 | Prepare 0.8 g/mL solution |
| Phosphate-buffered saline (PBS) | Prepared in-house / Sinopharm reagents | ES-8004 | Used for cell detachment |
| Tween 20 | Sinopharm Chemical Reagent Co. | T6335 | Prepare 0.02% (v/v) in PBS |
| Vortex mixer | Scientific Industries | SI-0256 | Vigorous vortexing for 30 min |
Bibliografia
- Piton G, et al. Life history strategies of soil bacterial communities across global terrestrial biomes. Nat Microbiol. 2023;8(11):2093–2102.
- Jansson JK, et al. Soil microbiome engineering for sustainability in a changing environment. Nat Biotechnol. 2023;41(12):1716–1728.
- Wang X, Xia K, Yang X, Tang C. Growth strategy of microbes on mixed carbon sources. Nat Commun. 2019;10(1):1279.
- Xiong C, et al. Plant developmental stage drives the differentiation in ecological role of the maize microbiome. Microbiome. 2021;9(1):171.
- Naylor D, DeGraaf S, Purdom E, Coleman-Derr D. Drought and host selection influence bacterial community dynamics in the grass root microbiome. ISME J. 2017;11(12):2691–2704.
- Metze D, et al. Soil warming increases the number of growing bacterial taxa but not their growth rates. Sci Adv. 2024;10(8):eadk6295.
- Carini P, et al. Relic DNA is abundant in soil and obscures estimates of soil microbial diversity. Nat Microbiol. 2017;2:16242.
- Bodor A, et al. Challenges of unculturable bacteria: environmental perspectives. Rev Environ Sci Biotechnol. 2020;19(1):1–22.
- Blagodatskaya E, et al. Active microorganisms in soil: critical review of estimation criteria and approaches. Soil Biol Biochem. 2013;67:192–211.
- Couradeau E, et al. Probing the active fraction of soil microbiomes using BONCAT-FACS. Nat Commun. 2019;10(1):2770.
- Tao Y, et al. Metabolic-activity-based assessment of antimicrobial effects by D₂O-labeled single-cell Raman microspectroscopy. Anal Chem. 2017;89(7):4108–4115.
- Xu J, et al. Raman deuterium isotope probing reveals microbial metabolism at the single-cell level. Anal Chem. 2017;89(24):13305–13312.
- Song Y, et al. Raman-deuterium isotope probing for in situ identification of antimicrobial resistant bacteria in Thames River. Sci Rep. 2017;7(1):16648.
- Lee KS, et al. An automated Raman-based platform for the sorting of live cells by functional properties. Nat Microbiol. 2019;4(6):1035–1048.
- Li HZ, et al. D₂O-isotope-labeling approach to probing phosphate-solubilizing bacteria in complex soil communities by single-cell Raman spectroscopy. Anal Chem. 2019;91(3):2239–2246.
- No JH, et al. Raman-deuterium isotope probing and metagenomics reveal the drought tolerance of the soil microbiome and its promotion of plant growth. mSystems. 2022;7(1):e0124921.
- Berry D, et al. Tracking heavy water (D₂O) incorporation for identifying and sorting active microbial cells. Proc Natl Acad Sci U S A. 2015;112(2):E194–E203.
- Eichorst SA, et al. Advancements in the application of NanoSIMS and Raman microspectroscopy to investigate the activity of microbial cells in soils. FEMS Microbiol Ecol. 2015;91(10):fiv106.
- Barra Caracciolo A, Grenni P, Cupo C, Rossetti S. In situ analysis of native microbial communities in complex samples with high particulate loads. FEMS Microbiol Lett. 2005;253(1):55–58.
- Ouyang Y, et al. Direct cell extraction from fresh and stored soil samples: impact on microbial viability and community compositions. Soil Biol Biochem. 2021;155:108178.
- Li G, et al. Machine learning-based determination of sampling depth for complex environmental systems: case study with single-cell Raman spectroscopy data in EBPR systems. Environ Sci Technol. 2022;56(18):13473–13484.
- Li HZ, et al. Single-cell exploration of active phosphate-solubilizing bacteria across diverse soil matrices for sustainable phosphorus management. Nat Food. 2024;5(8):673–683.
- Li HZ, et al. Single-cell Raman and functional gene analyses reveal microbial P solubilization in agriculture waste-modified soils. mLife. 2023;2(2):190–200.
- Li HZ, et al. Active antibiotic resistome in soils unraveled by single-cell isotope probing and targeted metagenomics. Proc Natl Acad Sci U S A. 2022;119(40):e2201473119.
Przedruki i uprawnienia
Ten artykuł został opublikowany
Film wkrótce dostępny