Este protocolo descreve a geração e caracterização fenotípica de um modelo de camundongo C57BL/6N-Cracdem1(c.538-83 to c.3352+255 del) utilizando a tecnologia CRISPR/Cas9 para estudar o papel do CRACD na remodelação cardíaca após infarto do miocárdio.
Artigo de método
Geração e Caracterização Fenotípica de um Modelo de Camundongo Deficiente em Cracd Modificado por CRISPR/Cas9 para Estudos de Remodelamento Pós-Infarto do Miocárdio
Neste artigo
Resumo
Resumo
Myocardial infarction (MI) remains a major cause of morbidity and mortality worldwide. This protocol describes a method for generating and characterizing a Cracd-deficient mouse line on the C57BL/6N background using CRISPR/Cas9 technology. Zygotes were co-injected with Cas9 mRNA, a gRNA construct, and a donor template designed to generate a 3153-bp genomic deletion. The edited allele was confirmed by PCR genotyping and Sanger sequencing. To assess the functional role of CRACD in post-MI remodeling, Cracd-deficient and wild-type (WT, C57BL/6N) mice underwent MI induced by permanent ligation of the left anterior descending coronary artery. On postoperative day 7, cardiac function and left ventricular wall motion were assessed using transthoracic echocardiography and speckle-tracking strain imaging, followed by histopathological evaluation with H&E and Masson's trichrome staining. Representative results showed that Cracd-deficient mice exhibited reduced ventricular dilation and preserved systolic function compared to WT controls. This protocol provides a reliable experimental platform for mechanistic studies of CRACD in cardiac pathophysiology.
Introdução
O infarto do miocárdio (IM) continua sendo uma das principais causas de morbidade e mortalidade no mundo, contribuindo significativamente para a sobrecarga da saúde cardiovascular global.1O prognóstico a longo prazo após infarto do miocárdio é determinado principalmente pelo processo de remodelação do ventrículo esquerdo (VE).2, que envolve dilatação ventricular, afinamento da parede e fibrose intersticial3,4, que são fatores-chave na progressão para insuficiência cardíaca (IC). A incidência global de IC resultante da remodelação cardíaca pós-infarto do miocárdio agrava ainda mais o ônus da doença cardiovascular5Apesar dessas observações clínicas bem estabelecidas, faltam estudos sistemáticos que utilizem modelos in vivo sensíveis e reprodutíveis para avaliar o papel de genes específicos no remodelamento pós-IM. Atualmente, nenhum protocolo combina um modelo de nocaute engenharizado por CRISPR/Cas9 com imagem avançada de deformação para avaliar um regulador do citoesqueleto como o CRACD. Assim, é urgentemente necessária uma metodologia que permita manipulação genética precisa e fenotipagem cardíaca de alta resolução.
A proteína reguladora da inibição da polimerização da actina (CRACD), também conhecida como KIAA1211, é um regulador da polimerização da actina predominantemente localizado no citosol que desempenha um papel crítico na dinâmica do citoesqueleto6. Ela regula positivamente a polimerização da actina ao se ligar às proteínas de capeamento da actina (CAPZA1, CAPZA2, CAPZB) e impedir que estas se liguem às extremidades pontiagudas dos filamentos de actina7. Em tecidos epiteliais, a CRACD desempenha um papel essencial na manutenção da morfologia celular e na transdução de sinais, preservando a integridade do citoesqueleto de actina8,9. Em células tumorais, sua desregulação está associada ao aumento da metástase e proliferação celular6,10. O papel da CRACD no coração ainda não foi completamente compreendido. Estudos de transcriptoma cardíaco e intervenções experimentais mostram que a expressão do gene Cracd responde ao estresse patológico e pode regular genes relacionados à dinâmica citoesquelética durante o remodelamento ventricular9,11. Além disso, sua proteína inibidora, CapZ, está fortemente associada à patologia cardíaca: a fosforilação da CapZ regula o crescimento dos miofilamentos durante a hipertrofia induzida pela fenilefrina12. Nossa pesquisa inicial indica que a diminuição moderada da CRACD confere proteção contra danos miocárdicos e preserva a contratilidade dos miofilamentos após isquemia aguda13. Esses achados levantam a possibilidade de que a CRACD desempenhe um papel no remodelamento ventricular maladaptativo após infarto do miocárdio (MI). No entanto, estudos sistemáticos in vivo de perda de função, que testem se a deficiência de Cracd modula o remodelamento pós-MI, ainda são escassos, principalmente devido à ausência de um protocolo validado, passo a passo, para gerar e fenotipar um camundongo deficiente em Cracd sob estresse isquêmico.
Várias abordagens existem para gerar camundongos knockout constitutivos. A recombinação homóloga tradicional em células-tronco embrionárias (ES) é precisa, mas cara e demorada (12–18 meses), além de limitada a certas linhagens de camundongos14. A mutagênese com ENU (N-etil-N-nitrosoureia) produz mutações pontuais aleatórias, exigindo retrocruzamentos extensivos e sequenciamento15. Em contraste, o CRISPR/Cas9 oferece vantagens práticas distintas para este estudo: (i) a injeção direta em zigotos reduz o tempo para 4–6 meses; (ii) permite a deleção de um grande fragmento genômico (3153 pb) para assegurar a perda completa da função; (iii) funciona diretamente na linhagem C57BL/6N, sem necessidade de conversão de linhagem; e (iv) evita a utilização de um marcador selecionável, minimizando interferências transcricionais não intencionais. Portanto, o CRISPR/Cas9 é a escolha mais eficiente para gerar uma linhagem deficiente em Cracd, adequada para fenotipagem cardiovascular de rotina. Essa tecnologia tem sido amplamente utilizada para realizar estudos precisos in vivo de perda de função16,17.
A imagem de deformação por rastreamento de speckle é uma técnica de pós-processamento que acompanha o movimento de speckles acústicos naturais no miocárdio quadro a quadro, permitindo o cálculo de parâmetros de deformação miocárdica, como deformação (mudança fracional no comprimento) e taxa de deformação (velocidade de deformação)18. Diferentemente da ecocardiografia em modo M convencional ou bidimensional, que fornece índices funcionais globais (fração de ejeção, encurtamento fracional, diâmetro interno do ventrículo esquerdo) e é relativamente insensível a anormalidades regionais do movimento da parede, a imagem de deformação pode quantificar a função contrátil segmentar. Isso é particularmente importante no período inicial após o infarto, quando a hipercinesia compensatória de segmentos não infartados pode preservar a fração de ejeção global apesar de disfunção regional significativa. O rastreamento de speckle oferece várias vantagens sobre os pontos finais padrão: fornece deformação segmentar e taxa de deformação, deslocamento e velocidade, detectando assim alterações subclínicas sutis19; pode identificar dessincronia e déficits contráteis precoces antes que ocorra remodelação irreversível; e investiga diretamente o subendocárdio, a camada mais vulnerável à isquemia20. Neste estudo, CRACD é um regulador do citoesqueleto que pode influenciar a contratilidade das miofibras em nível microscópico. Medidas baseadas na cavidade convencional podem facilmente deixar passar esses efeitos mecânicos locais. Assim, a integração da análise por rastreamento de speckle neste protocolo aumenta a capacidade de detectar efeitos protetores precoces da deficiência de Cracd. Portanto, integrar o rastreamento de speckle neste protocolo fornece uma ferramenta sensível e quantitativa para avaliar a remodelação pós-infarto, especialmente durante a primeira semana após o IAM, quando ocorrem dilatação precoce e disfunção contrátil21,22.
Este protocolo foi desenvolvido para pesquisadores que investigam o impacto funcional da deleção de um gene específico no remodelamento agudo (7 dias) pós-IM, utilizando uma combinação de camundongos knockout constitutivos e imagens de alta resolução. É adequado para estudos geradores de hipóteses em que a perda global do gene-alvo é aceitável e o principal desfecho são as alterações estruturais e funcionais sistólicas precoces. No entanto, várias limitações devem ser consideradas. Primeiro, o camundongo deficiente em Cracd é um knockout global; portanto, os efeitos cardioprotetores observados não podem ser atribuídos exclusivamente à perda de CRACD nos cardiomiócitos, já que contribuições sistêmicas também podem desempenhar um papel. Estudos futuros utilizando estratégias de knockout condicional serão necessários para obter deleção específica do coração. Segundo, o protocolo concentra-se em um único ponto temporal (dia 7) e não aborda o remodelamento crônico nem a progressão da IC. Estudos longitudinais além da fase aguda serão necessários. Terceiro, a análise por rastreamento de speckle exige imagens de alta qualidade (bordas endocárdicas bem definidas) e software dedicado, os quais podem não estar disponíveis em todas as instalações centrais. Apesar dessas limitações, o protocolo fornece uma plataforma robusta e reprodutível para a caracterização funcional inicial de genes envolvidos no remodelamento cardíaco pós-IM.
Este estudo teve como objetivo utilizar o sistema CRISPR/Cas9 para gerar e validar um modelo de camundongo deficiente em Cracd (C57BL/6N-Cracdem1 (c.538-83 a c.3352+255 del)) para investigar o impacto da deficiência de Cracd no remodelamento cardíaco pós-IM e no movimento da parede ventricular. O infarto do miocárdio (IM) foi induzido em camundongos selvagens (WT, C57BL/6N) e em camundongos deficientes em Cracd, sendo realizadas avaliações abrangentes uma semana após o IM. As avaliações incluíram parâmetros ecocardiográficos convencionais, análise de deformação por rastreamento de padrão aleatório (speckle-tracking) e avaliação histopatológica. Concentramo-nos especificamente na fase inicial após o IM (dia 7) para captar os eventos iniciais de remodelamento e determinar se a deficiência de Cracd afeta a dilatação ventricular e a função sistólica durante a fase aguda do IM. Os resultados devem fornecer informações valiosas sobre o papel do CRACD na modulação do remodelamento cardíaco adverso após o infarto do miocárdio.
Protocolo
All animal experiments were approved by the Institutional Animal Care and Use Committee of the Guangdong Institute of Biotechnology (Approval No. IACUC2025179). The study utilized 20 SPF Cracd-deficient and 20 age- and weight-matched WT mice. All mice were 10–12 weeks old and weighed 20–25 g. All male animals were housed in an AAALAC-accredited facility (License No. SYXK (Yue) 2016-0122) at the Guangdong Institute of Biotechnology (Guangdong Laboratory Animals Monitoring Institute). The housing environment was maintained at 22–25 °C with 50–70% relative humidity under a 12 h light/12 h dark cycle.
1. Generation of Cracd-deficient mice using CRISPR/Cas9
- Use CRISPR/Cas9 gene editing technology to generate Cracd-deficient mice on a C57BL/6N background. Delete the genomic sequence from c.538-83 to c.3352+255 (partial intron 5 to intron 6) of Cracd by homology-directed repair.
NOTE: The mouse Cracd gene (NCBI RefSeq: NM_001163793.1; Ensembl: ENSMUSG00000036377) is located on chromosome 5 and contains 9 exons, with the ATG start codon in exon 2 and the TAA stop codon in exon 9. - Design the sequence of gRNA targeting vector and donor oligonucleotide (with targeting sequence flanked by 120 bp homologous sequences combined on both sides).
- Log in to the NCBI website, select the Primer-BLAST function, and design PCR primers for genotyping.
- Paste the NCBI reference sequence number of Cracd (NM_001163793.1) into the PCR template field, specify the exon range for amplification, and click “Get Primers” to retrieve multiple pairs of candidate primers for PCR-based detection of the deletion and wild-type alleles.
- Design single-guide RNAs (gRNAs) to target sites flanking the intended deletion interval in the Cracd gene.
- Select four gRNA sequences (20 nt upstream of the PAM) using online CRISPR design tools.
- To minimize potential off-target effects, score the candidate gRNAs with CRISPRater and select the two optimal sequences (including the NGG PAM).
NOTE: Example selected sequences:
gRNA-A1: CGGCGCTCTTAACATCCAGAGGG (score: 0.71)
gRNA-A2: CCCTTCAGTCTGGGTAGTAGAGG (score: 0.71)
Accept gRNAs with a CRISPRater score ≥ 0.5. For in vitro validation, accept gRNAs with > 50% cleavage efficiency in a Cas9/gRNA target efficiency detection kit.
- Design a single-stranded donor oligonucleotide to promote efficient joining of the intended breakpoints. Example donor sequence: TTAACCATCAACGGGCCGCTGCAAGGGCTGCTGT
GTCTATA CTCAGGACCACCTGCCCTCTAGAGGCAGGAAGGT
AGAGTTCCAAGCTCTGCTGTGCTAGGTTAAATGCAACTTAACATC. - Co-inject Cas9 mRNA, gRNA and donor oligonucleotide into fertilized eggs to generate Cracd-deficient mice. Prepare Cas9 mRNA and gRNA by in vitro transcription.
- Preparation of gRNA.
- Transcribe gRNAs in vitro from DNA templates using the MEGAshortscript™ T7 transcription kit (see Table of Materials) following the manufacturer's protocol.
- Purify the transcribed gRNAs using an RNA purification kit (see Table of Materials) and elute them in RNase-free water.
- Assess gRNA cleavage activity using an in vitro Cas9/gRNA target efficiency detection kit (see Table of Materials).
- Perform all RNA preparation steps on ice using RNase‑free consumables (pipette tips, tubes, water). Keep RNA samples on ice at all times to prevent degradation.
- To perform the cleavage assay: mix the transcribed gRNA (25 ng/µL) with recombinant Cas9 protein (50 ng/µL) and a PCR-amplified DNA fragment containing the target sequence (50 ng).
- Incubate the reaction at 37 °C for 30 min.
- Run the products on a 2% agarose gel to visualize uncleaved and cleaved bands.
- Calculate cleavage efficiency as the ratio of cleaved band intensity to total (cleaved + uncleaved) band intensity.
- Accept gRNAs with > 50% cleavage efficiency.
- Preparation of Cas9 mRNA.
- Thaw the reagents from the T7 ARCA mRNA Kit (see Table of Materials).
- At room temperature, combine 10 µL of 2× ARCA/NTP mix, 1 µL of template DNA, 2 µL of T7 RNA polymerase mix, and nuclease-free water to 20 µL.
- Mix thoroughly, pulse-spin in a microfuge (5 s at 5000 × g), and incubate at 37 °C for 30 min.
- Remove the template DNA by adding 2 µL of DNase I (1 U/µL), mix well, and incubate at 37 °C for 15 min to obtain Cas9 mRNA. Optionally add 1 µL of RNase inhibitor (40 U/µL) (see Table of Materials) to the reaction to prevent RNA degradation.
- Perform all steps on ice with RNase‑free consumables. Keep the Cas9 mRNA on ice until use.
- Superovulate 4-week-old C57BL/6N female mice by intraperitoneal injection of 5 IU of pregnant mare serum gonadotropin (PMSG), followed 48 h later by 5 IU of human chorionic gonadotropin (hCG).
CAUTION: PMSG and hCG are hormones that may cause skin sensitization. Wear gloves and dispose of needles in a sharps container. - Approximately 14–18 h after hCG injection, euthanize the C57BL/6N female mice and one 8–12-week-old C57BL/6N male mouse by cervical dislocation. Collect oocytes from the oviducts of the females and sperm from the cauda epididymis of the male.
CAUTION: Euthanasia must be performed in accordance with institutional guidelines. Cervical dislocation should only be performed by trained personnel. - Capacitate the sperm in capacitation medium (see Table of Materials).
- Add a small volume of the sperm suspension to the oocytes for in vitro fertilization and co-culture for 3–4 h at 37 °C to obtain fertilized zygotes.
- Dilute the transcribed gRNA and Cas9 mRNA with RNase-free water to working concentrations (typically 25 ng/µL for gRNA and 50 ng/µL for Cas9 mRNA) and donor oligonucleotide at 10 ng/µL.
- Microinject 1–2 pL of the mixture into the cytoplasm of fertilized zygotes using a microinjection system (see Table of Materials).
- Identify healthy zygotes by the presence of two distinct pronuclei and an intact polar body under a stereomicroscope.
- Transplant 300 healthy fertilized zygotes into the oviducts of pseudopregnant female mice that have been mated with vasectomized males.
NOTE: This results in the generation of 2 positive founder mice (F0). - Use RNase‑free water and ice‑cold conditions during dilution to maintain RNA integrity.
- Identify F0 mice by PCR genotyping of tail biopsies (see section 1.6).
- Breed F0 founders with WT mice to generate F1 heterozygous offspring, to obtain germline transmission of the deletion.
- Intercross heterozygous F1 mice to produce F2 homozygous Cracd-deficient mice.
- Preparation of gRNA.
- Genotype by Polymerase Chain Reaction (PCR)
NOTE: The following protocol uses a commercial TIANamp Genomic DNA Kit (see Table of Materials). Buffer GL is the lysis buffer, Buffer GB is the binding buffer, and Buffer WA and Buffer WB are wash buffers.- Place approximately 2–5 mm of mouse tail tissue in a microcentrifuge tube containing 180 µL of Buffer GL, 20 µL of Proteinase K (20 mg/mL stock solution), and 10 µL of RNase A (10 mg/mL stock solution).
- Incubate the sample at 56 °C overnight to digest the tissue.
- Centrifuge the tube at 13800 × g for 2 min at room temperature to pellet tissue debris and transfer the supernatant to a new tube.
- Add 200 µL of Buffer GB and 200 µL of 100% ethanol to the supernatant, mix thoroughly, and apply the mixture to a spin column placed in a collection tube.
- Centrifuge at 13800 × g for 2 min at room temperature and discard the flow-through.
- Add 500 µL of Buffer WA to the column, centrifuge at 13800 × g for 1 min at room temperature and discard the flow-through.
- Carefully add 700 µL of Buffer WB (wash buffer containing ethanol, pre-mixed with 100% ethanol) to the spin column, centrifuge at 13800 × g for 1 min at room temperature and discard the flow-through.
- Apply Buffer WB to the inner wall of the column to wash residual salts.
- Repeat step 1.6.5 once, then transfer the column into a new collection tube and centrifuge at 13800 × g for 2 min at room temperature to dry the membrane and remove residual ethanol.
- Place the column into a new 1.5 mL microcentrifuge tube. Add 50–200 µL of sterilized water or elution buffer (preheated to 65 °C) to the center of the membrane, incubate for 5 min.
- Centrifuge the column at 13800 × g for 2 min at room temperature to elute the DNA.
- To increase DNA yield, either reapply the flow-through to the membrane or add an additional 50–200 µL of sterilized water, incubate for 5 min.
- Perform a final centrifugation at 13800 × g for 2 min.
NOTE: Expect DNA yield of 50–200 ng/µL from tail tissue; A260/A280 ratio of 1.8–2.0 indicates pure DNA.
- Place approximately 2–5 mm of mouse tail tissue in a microcentrifuge tube containing 180 µL of Buffer GL, 20 µL of Proteinase K (20 mg/mL stock solution), and 10 µL of RNase A (10 mg/mL stock solution).
- Genotyping by multiplex PCR using three primers in a single reaction.
- Design three primers to distinguish WT, heterozygous, and homozygous genotypes in one PCR reaction: Forward primer F1 (5’-CAGAAGTCATAGCAGCAAGGCAG-3’, binds upstream of the deletion), Forward primer F2 (5’-GAGGGAATTGAGAGGGAGCC-3’, binds within the deleted region, present only in the WT allele), and Reverse primer R1 (5’-GCCAATTTAGCTGCTTCAAATGTTC-3’, common reverse primer downstream of the deletion).
NOTE: The targeted allele generates a 421 bp amplicon (F1 + R1) only when the deletion is present; the WT allele generates a 357 bp amplicon (F2 + R1) only when the intact allele is present. - Set up the PCR reaction in a 25 µL total volume containing 50–100 ng genomic DNA, 0.2 µM of each primer (F1, F2, and R1), 200 µM dNTPs, 1.5 mM MgCl₂, and 1 U Taq DNA polymerase (see Table of Materials).
- Use the following thermocycling program: initial denaturation at 95 °C for 3 min; 35 cycles of denaturation at 95 °C for 15 s, annealing at 60°C for 15 s, and extension at 72 °C for 25 s; and a final extension at 72 °C for 5 min.
- Separate the PCR products by 1–2% agarose gel electrophoresis (120 V, 30 min) in 1× TAE buffer.
- Genotype interpretation based on band pattern: WT shows only a 357 bp band (F2+R1); Heterozygous shows both 421 bp (F1+R1) and 357 bp (F2+R1) bands; Homozygous shows only a 421 bp band (F1+R1).
- Design three primers to distinguish WT, heterozygous, and homozygous genotypes in one PCR reaction: Forward primer F1 (5’-CAGAAGTCATAGCAGCAAGGCAG-3’, binds upstream of the deletion), Forward primer F2 (5’-GAGGGAATTGAGAGGGAGCC-3’, binds within the deleted region, present only in the WT allele), and Reverse primer R1 (5’-GCCAATTTAGCTGCTTCAAATGTTC-3’, common reverse primer downstream of the deletion).
2. Myocardial infarction model establishment
- Anesthetize the mice via inhalation of 3% isoflurane (delivered in 100% oxygen at 1 L/min), place them in a supine position on a surgical platform, and confirm deep anesthesia by the absence of pedal withdrawal reflex.
CAUTION: Isoflurane is a volatile anesthetic. Use only in a well-ventilated area or under a fume hood to avoid inhalation. - Perform orotracheal intubation using a 20-gauge intravenous catheter sheath. Apply ophthalmic ointment to both eyes to prevent corneal drying during surgery.
- Connect the tube to a mechanical ventilator upon successful intubation to maintain ventilation and anesthesia with 2% isoflurane.
NOTE: Successful intubation is confirmed by visible chest movements synchronized with the ventilator.
- Connect the tube to a mechanical ventilator upon successful intubation to maintain ventilation and anesthesia with 2% isoflurane.
- Remove hair from the anterior chest with depilatory cream. Disinfect the surgical area by applying povidone-iodine and 70% alcohol in a circular motion for multiple times, starting from the center and moving outward.
- After fully exposing the skin, make a 1–1.5 cm incision in the left chest wall between the 2nd and 3rd intercostal spaces to open the thoracic cavity.
- Incise the pericardium to fully expose the heart.
CAUTION: Surgical procedures must be performed under sterile conditions. Use appropriate personal protective equipment (PPE), including gloves and a surgical mask.
- Using the inferior border of the left auricle as a landmark, pass a 7–0 atraumatic suture needle beneath the left anterior descending coronary artery (LAD) approximately 2–3 mm distal to its origin.
- Pass the needle to a depth of approximately 0.5–1 mm and tighten the ligature slowly to avoid myocardial tearing.
- Confirm successful occlusion by observing pallor (whitening) of the left ventricular anterior wall distal to the ligation site within 30 s.
- In sham-operated controls, open the chest and pass the suture beneath the coronary artery without tying the knot.
- After establishing the model, sequentially suture the ribs (4-0 absorbable suture, simple interrupted pattern) and skin (4-0 absorbable suture, continuous pattern) to close the thoracic cavity. Remove the endotracheal tube once the mouse resumes stable spontaneous breathing.
- Place mice on a heating pad (37 °C) until fully conscious.
- Administer postoperative analgesia (e.g., buprenorphine 0.05–0.1 mg/kg, subcutaneously, every 12 h for 48 h) according to institutional IACUC guidelines and closely monitor the postoperative health status for several days.
NOTE: Monitor for signs of distress (hunched posture, ruffled fur, reduced mobility, weight loss > 20%).
- Administer postoperative analgesia (e.g., buprenorphine 0.05–0.1 mg/kg, subcutaneously, every 12 h for 48 h) according to institutional IACUC guidelines and closely monitor the postoperative health status for several days.
- Mortality and exclusion criteria.
- Record the number of mice that die within the first 7 days after MI surgery.
NOTE: In a typical cohort, expect a mortality rate of approximately 10–20% by postoperative day 7, with no significant difference between WT and Cracd‑deficient mice. Common causes of death include extensive infarction leading to acute heart failure, surgical bleeding, or pneumothorax. Exclude any mouse with persistent arrhythmia (heart rate < 350 bpm) or signs of severe distress (e.g., hunched posture, ruffled fur, weight loss > 20%) from subsequent echocardiographic and histological analyses. For sham‑operated mice, mortality should be < 5%.
- Record the number of mice that die within the first 7 days after MI surgery.
3. Echocardiographic assessment
- Animal Preparation and Anesthesia
- Power on the high-resolution small animal ultrasound imaging system (see Table of Materials) and its integrated heated stage.
- Ensure that the appropriate high-frequency transducer is securely connected to the mounting apparatus following the manufacturer’s instructions. Set the temperature of the heated stage to 37 °C and allow it to stabilize.
- Place mice in an induction chamber and anesthetize them with 3% isoflurane in oxygen (1–2 L/min) until the pedal withdrawal reflex is absent. Transfer anesthetized mice to the heated platform in a supine position.
- Maintain anesthesia with 1–1.5% isoflurane delivered via a nose cone, adjusting to maintain heart rate between 450–550 beats per min.
- Apply ophthalmic ointment to both eyes to prevent corneal drying.
- Shave the thoracic region, evenly apply depilatory cream for no longer than 3 min, then remove the depilatory cream thoroughly with wet gauze.
- Rinse the skin gently with warm saline if necessary and dry the area. Attach surface ECG electrodes to the limbs using electrode gel at the contact sites and secure them with tape.
NOTE: Confirm stable ECG and heart rate within 450–550 bpm before proceeding to ultrasound imaging.
- Power on the high-resolution small animal ultrasound imaging system (see Table of Materials) and its integrated heated stage.
- Conventional Echocardiography Image Acquisition
- Position the mouse in a horizontal, supine posture on the heated stage, with a slight leftward tilt if needed to optimize cardiac imaging.
- Apply a generous amount of pre-warmed ultrasound coupling gel to the hairless left precordial region, avoiding air bubbles.
- Place the transducer gently on the chest wall at the left parasternal position. Adjust its orientation so that the index mark points toward the mouse’s right shoulder and fine-tune the angle and pressure to optimize image quality.
- Switch to B-mode (two-dimensional) imaging, adjust depth, focus zone, and frame rate to obtain a clear parasternal long-axis view of the left ventricle. Acceptable image quality requires clear visualization of the endocardial border with no dropouts.
- Once the heart rate stabilizes (450–550 bpm), acquire three separate parasternal long-axis B-mode cine loops, each containing at least 3–5 consecutive cardiac cycles.
- Save each loop by pressing “Cine Store”, and store representative still frames using “Frame Store”.
- From the long‑axis view, rotate the transducer 90° clockwise to obtain a short‑axis view at the mid‑papillary level.
- Acquire three separate short‑axis B‑mode cine loops (each with ≥ 3–5 cycles).
- Activate M‑mode, position the cursor perpendicular to the interventricular septum and posterior wall, and record three separate M‑mode tracings.
NOTE: Acceptable M‑mode tracings require clear endocardial borders throughout the cardiac cycle.
- Use the VevoLab 3.2.0 software (see Table of Materials) to measure the following parameters from M‑mode tracings according to the American Society of Echocardiography leading‑edge method: interventricular septum thickness at diastole and systole (IVSd, IVSs), left ventricular internal diameter at diastole and systole (LVIDd, LVIDs), and left ventricular posterior wall thickness at diastole and systole (LVPWd, LVPWs).
- Calculate left ventricular ejection fraction (EF) and fractional shortening (FS) using the Teichholz formula: EF (%) = [(LV Vold - LV Vols) / LV Vold] × 100, LV Vold = ((7 / (2.4 + LVIDd)) × LVIDd3), LV Vol;s = ((7 / (2.4 + LVIDs)) × LVIDs3), FS (%) = [(LVIDd – LVIDs) / LVIDd] × 100.
NOTE: For each mouse, measurements were averaged from three consecutive cardiac cycles per M‑mode recording, and the average was taken across three separate recordings, resulting in a total of 9 measurements per parameter per mouse.
- Calculate left ventricular ejection fraction (EF) and fractional shortening (FS) using the Teichholz formula: EF (%) = [(LV Vold - LV Vols) / LV Vold] × 100, LV Vold = ((7 / (2.4 + LVIDd)) × LVIDd3), LV Vol;s = ((7 / (2.4 + LVIDs)) × LVIDs3), FS (%) = [(LVIDd – LVIDs) / LVIDd] × 100.
- Position the mouse in a horizontal, supine posture on the heated stage, with a slight leftward tilt if needed to optimize cardiac imaging.
- Speckle-Tracking Strain Analysis
- Perform speckle-tracking analysis using the dedicated analysis software (VevoStrain module within VevoLab 3.2.0).
- Open a clear parasternal long-axis B-mode cine loop, select "Vevo Strain" to enter the strain analysis mode, retain only complete cardiac cycles, and choose "Long Axis".
- Manually trace the endocardial border at the end‑diastolic frame. After the endocardial border is drawn, the software automatically generates an epicardial border (adjust as needed). Then start the strain analysis and activate the "toggle contour/vector/orbit line/B mode" function to visualize the motion trajectory.
- Assess tracking quality via the colour‑coded mesh: it should appear green, closely follow the endocardial and epicardial borders without jerking, and move synchronously with myocardial contraction/relaxation. If not, manually refine the borders and re‑analyze.
- Activate "Time‑to‑peak analysis" to divide the left ventricle into six segments (basal anterior, mid anterior, apical anterior, apical posterior, mid posterior, basal posterior), with each colour representing an individual segment. Once satisfactory tracking is achieved, export data for wall motion parameters: velocity (cm/s), displacement (cm), strain (%), strain rate (1/s) for both longitudinal and radial.
NOTE: If tracking quality remains poor after three acquisition attempts (e.g., erratic strain curves, or inability to visualise clear motion trajectories), exclude the mouse from strain analysis.
- Perform speckle-tracking analysis using the dedicated analysis software (VevoStrain module within VevoLab 3.2.0).
4. Histopathological analysis
- After echocardiography, administer a lethal dose of isoflurane to deeply anesthetized mice and apply a secondary physical method (e.g., cervical dislocation) according to institutional guidelines.
- Open the thoracic cavity, rapidly harvest the hearts and rinse the hearts gently in cold phosphate-buffered saline (PBS).
CAUTION: Euthanasia must be performed according to institutionally approved protocols.
- Open the thoracic cavity, rapidly harvest the hearts and rinse the hearts gently in cold phosphate-buffered saline (PBS).
- Trim the hearts, remove the great vessels and cut transversely from apex to base into 2–3 slices (approximately 2–3 mm thick).
- Immerse the tissue slices in 4% paraformaldehyde in PBS and fix them at 4 °C for 12–24 h.
NOTE: Use a volume ratio of fixative to tissue of at least 10:1.
CAUTION: Paraformaldehyde is toxic and a suspected carcinogen. Handle in a fume hood and wear appropriate PPE (gloves, lab coat, safety goggles). Dispose of paraformaldehyde waste as hazardous chemical waste according to institutional guidelines.
- Immerse the tissue slices in 4% paraformaldehyde in PBS and fix them at 4 °C for 12–24 h.
- Dehydrate tissue through a graded ethanol series (50%, 70%, 80%, 95%, 100% ethanol, each for 1 h), clear them in xylene (2 changes, 30 min each), embed them in paraffin, and section them at 4–5 µm thickness using a microtome.
NOTE: Sections should be free of folds and tears.
CAUTION: Xylene is flammable and toxic. Use only in a fume hood and avoid skin contact. Collect xylene waste in a designated container and dispose of as hazardous chemical waste. - Deparaffinize the sections in xylene (2 changes, 5–10 min each), rehydrate them through descending ethanol series (100%, 95%, 80%, 70%, each for 3 min) to water.
- Stain them using standard Hematoxylin and Eosin (H&E) (see Table of Materials) and Masson’s trichrome protocols (see Table of Materials).
CAUTION: Xylene is toxic. Use only in a fume hood and avoid skin contact. Dispose of xylene waste as hazardous material.
- Stain them using standard Hematoxylin and Eosin (H&E) (see Table of Materials) and Masson’s trichrome protocols (see Table of Materials).
- Examine the stained sections under a light microscope (see Table of Materials).
- For quantitative analysis, capture digital images at 4×, 20×, and 40× magnification using a digital camera attached to the microscope. Measure infarct size and fibrotic area using ImageJ.
NOTE: Infarct size (%) = (infarct area / total LV area) × 100; collagen content (%) = (blue-stained area / total myocardial area) × 100.
- For quantitative analysis, capture digital images at 4×, 20×, and 40× magnification using a digital camera attached to the microscope. Measure infarct size and fibrotic area using ImageJ.
Resultados
Generation of Cracd-deficient mice
A heritable mouse model carrying a targeted deficiency in the Cracd gene was generated using CRISPR/Cas9-mediated genome editing (Figure 1A, Figure 1B). To distinguish WT, heterozygous, and homozygous genotypes, a multiplex PCR was performed using three primers (F1, F2, R1) in a single reaction. Mice homozygous for the deletion (Cracd‑deficient) displayed only the 421 bp band, WT mice showed only the 357 bp band (Figure 1C). Sanger sequencing of genomic DNA from Cracd-deficient mice confirmed the predicted deletion in the target gene compared to WT controls (Figure 1D). Western blot analysis further demonstrated a marked reduction in CRACD protein levels in cardiac tissues from Cracd-deficient mice compared with WT controls (Figure 1E). Together, these data confirm the successful establishment of the Cracd-deficient mouse line.
Echocardiography
Echocardiographic assessment on postoperative day 7 revealed pronounced pathological cardiac remodeling in WT mice after MI (WT-MI) compared with sham-operated controls (Figure 2A). The WT-MI group showed thinning of the interventricular septum (Figure 2B, C), significant left ventricular (LV) dilation as reflected by increased LVIDd (Figure 2D) and LVIDs (Figure 2E), and thinning of the posterior wall (Figure 2F, G). These structural alterations were associated with a pronounced decline in global systolic function, as demonstrated by significantly reduced EF (Figure 2H) and FS (Figure 2I). In contrast, Cracd-deficient mice displayed a cardioprotective phenotype following MI. LV dilation was significantly attenuated, with notably smaller LVIDd and LVIDs compared with the WT-MI group. Furthermore, these mice exhibited improved systolic thickening of the posterior wall and maintained significantly higher EF and FS values. These findings indicate that Cracd deficiency effectively attenuates post-infarction LV dilation and preserves global systolic function.
Speckle-tracking strain analysis
Left ventricular myocardial motion and deformation were further evaluated by speckle‑tracking echocardiography using only parasternal long‑axis views (Figure 3A). To ensure data reliability, we defined pragmatic criteria for acceptable output based on the capabilities of the VevoStrain software. Acceptable strain analysis required: (i) a clear parasternal long‑axis view with endocardial borders visible throughout the cardiac cycle; (ii) a stable heart rate between 450–550 bpm during acquisition; (iii) after automatic tracking, the colour‑coded mesh (activated via “toggle contour/vector/orbit line/B mode”) had to closely follow the endocardial and epicardial borders without jerking or losing contact; and (iv) strain curves had to be smooth, show consistent waveforms across segments, and lack sudden spikes or arrhythmic interruptions. Suboptimal output—most commonly erratic strain curves or inability to visualise clear motion trajectories—led to manual adjustment of endocardial or epicardial contours and re‑analysis. If quality remained poor after three attempts, the mouse was excluded. Using these criteria, we obtained reliable strain data in WT‑MI mice and Cracd‑deficient MI mice.
Compared with the sham group, WT-MI mice exhibited significantly reduced radial velocity (Figure 3B) and longitudinal velocity (Figure 3C), as well as radial displacement (Figure 3D) and longitudinal displacement (Figure 3E), indicating impaired global myocardial motion. The absolute values of radial strain (Figure 3F), radial strain rate (Figure 3G), longitudinal strain (Figure 3H), and longitudinal strain rate (Figure 3I) were also markedly decreased, reflecting severely compromised regional myocardial deformation and function. In contrast, Cracd-deficient mice showed significant improvement in these parameters. Compared with the WT-MI group, they displayed better recovery of radial and longitudinal displacements. Furthermore, radial velocity, radial strain, and radial strain rate were maintained at higher levels, while longitudinal strain and longitudinal strain rate were significantly improved. These results suggest that Cracd deficiency not only preserves global systolic function but also enhances regional LV myocardial deformation after MI.
The speckle‑tracking imaging analysis also included visualization of segmental strain distribution and cardiac motion trajectories. Parasternal long‑axis B‑mode images with segmented six regions (BA, MA, AA, AP, MP, BP) and color gradient mapping are displayed in Figure 4A. Cardiac motion trajectories, time‑to‑peak curves for radial and longitudinal strain, parametric distribution maps of strain synchrony, and three‑dimensional reconstructions are presented in Figure 4B. These data further support the functional improvements observed in Cracd‑deficient mice.
Histological examination
To assess the protective effect of Cracd deficiency against MI, histopathological examination was performed on heart sections from WT and Cracd-deficient mice at 7 days post-MI using H&E and Masson's trichrome staining. Whole‑heart longitudinal sections are shown in Figure 5A, with quantitative analysis of infarct size and collagen content presented in Figure 5B and Figure 5C, respectively. High‑magnification views of the infarct zone, border zone, and remote zone are displayed in Figure 5D. In WT-MI hearts, H&E staining showed pronounced left ventricular wall thinning and a well-demarcated infarct zone. Within the infarct region, extensive inflammatory cell infiltration, myocardial necrosis, and marked fibrosis with scar formation were observed. In the border zone, inflammatory infiltration, myocardial necrosis, fibrosis and cardiomyocyte hypertrophy were evident, while the remote zone displayed prominent hypertrophic changes. Corresponding Masson's trichrome staining further demonstrated extensive interstitial fibrosis within both the infarct and border zones of WT hearts following MI. In contrast, Cracd-deficient mice exhibited substantially attenuated pathological alterations, including reduced wall thinning, diminished inflammatory infiltration and myocardial necrosis, less pronounced cardiomyocyte hypertrophy, and markedly decreased interstitial fibrosis compared with WT-MI hearts. These histological findings indicate that Cracd deficiency mitigates post-infarction myocardial damage and adverse remodeling.
Successful protocol execution should yield: (i) a well‑demarcated infarct zone with extensive collagen deposition in WT-MI hearts; (ii) clear cellular morphology without staining artifacts; and (iii) significantly attenuated pathology in Cracd‑deficient MI hearts. Although infarct size may vary with ligation precision, the genotype‑dependent difference is a reliable indicator of successful performance.
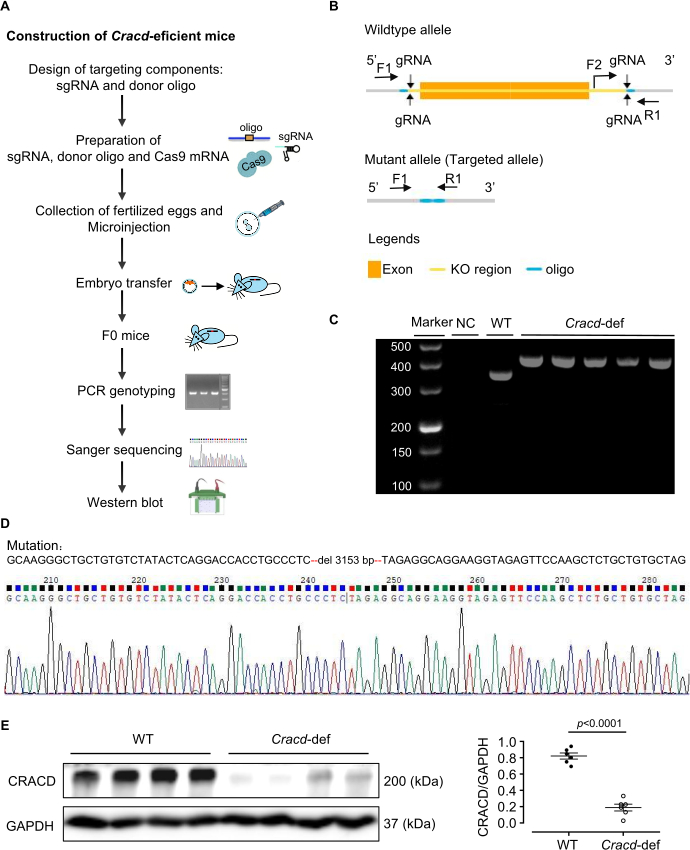
Figure 1: Generation of Cracd-deficient mice. (A) Construction of Cracd-deficient mice. (B) Schematic of the Cracd gene modification strategy. (C) PCR genotyping of tail genomic DNA. WT mice show a single 357 bp band, while homozygous (Cracd‑deficient) mice show a single 421 bp band. (D) Sanger sequencing of genomic DNA confirmed the predicted deletion in the Cracd locus of deficient mice compared to WT controls. (E) Western blot analysis showed significantly reduced CRACD protein levels in the hearts of Cracd-deficient mice compared to WT controls. n = 6 mice per group. Data are presented as mean ± SEM. Statistical significance was calculated with a two-tailed unpaired Student's t-test. Please click here to view a larger version of this figure.
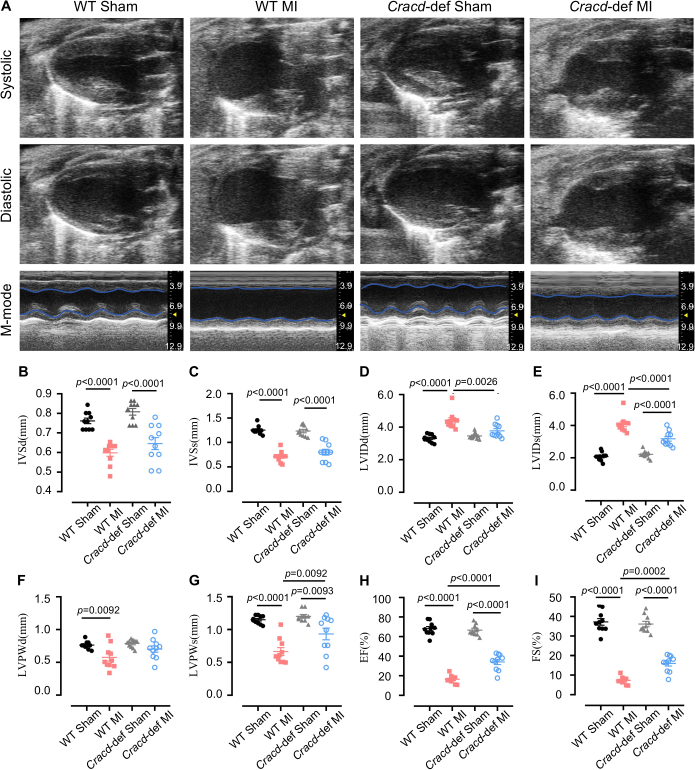
Figure 2: Echocardiographic assessment of cardiac function. (A) Representative B-mode and M-mode echocardiographic images of mouse hearts at diastole and systole. Quantitative analysis of (B) interventricular septum thickness at diastole (IVSd) and (C) systole (IVSs), (D) left ventricular internal diameter at diastole (LVIDd) and (E) systole (LVIDs), (F) left ventricular posterior wall thickness at diastole (LVPWd) and (G) systole (LVPWs), (H) ejection fraction (EF), and (I) fractional shortening (FS). n = 10 mice per group. Data are presented as mean ± SEM. Statistical significance was determined by one-way ANOVA followed by Tukey's multiple comparisons test. Please click here to view a larger version of this figure.
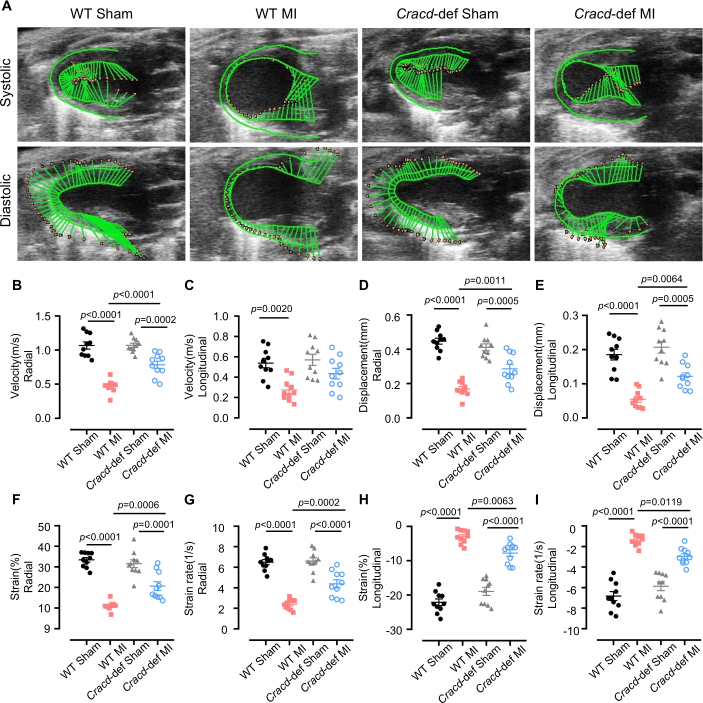
Figure 3: Speckle-tracking strain analysis. (A) Representative images of left ventricular wall motion and deformation at diastole and systole. Quantitative analyses of the following parameters: (B) radial velocity, (C) longitudinal velocity, (D) radial displacement, (E) longitudinal displacement, (F) radial strain, (G) radial strain rate, (H) longitudinal strain, and (I) longitudinal strain rate. n = 10 mice per group. Data are presented as mean ± SEM. Statistical significance was determined by one-way ANOVA followed by Tukey's multiple comparisons test. Please click here to view a larger version of this figure.
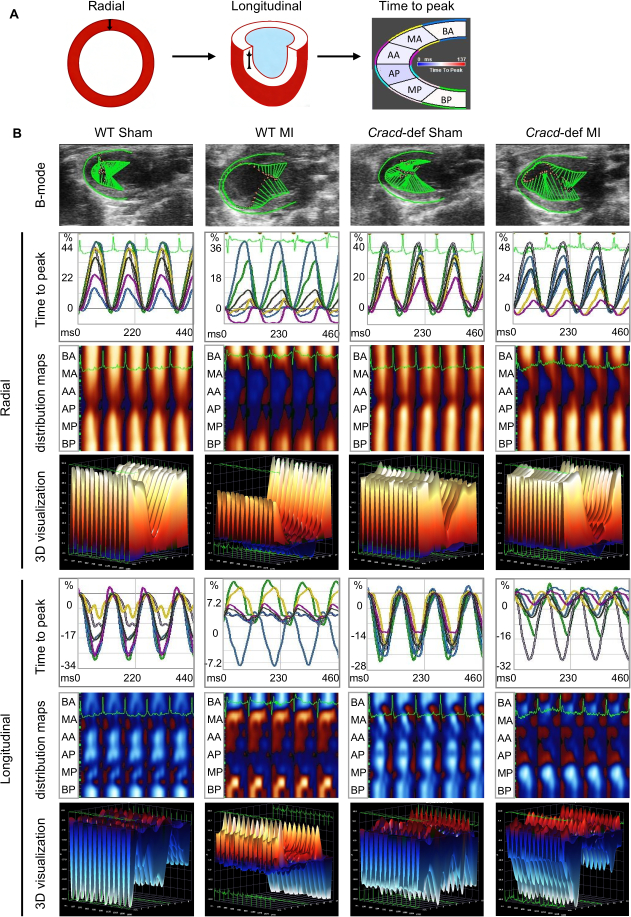
Figure 4: Speckle-tracking imaging in WT-Sham, WT-MI, Cracd-deficient Sham, and Cracd-deficient MI groups at 7 days post-MI. (A) Parasternal long‑axis B‑mode images. Left ventricular wall was segmented into six regions: BA (basal anterior), MA (mid anterior), AA (apical anterior), AP (apical posterior), MP (mid posterior), and BP (basal posterior). Color gradient from blue to red represents increasing strain magnitude. (B) Cardiac motion trajectories; time-to-peak curves for radial and longitudinal strain values along with corresponding peak times. Parametric distribution maps of strain synchrony (blue/red indicate direction: radial – away from/toward center; longitudinal – away from/toward apex). White dots = highest velocity regions, black dots = lowest velocity. Three-dimensional reconstructions (X: time, Y: spatial position, Z: strain magnitude). Please click here to view a larger version of this figure.
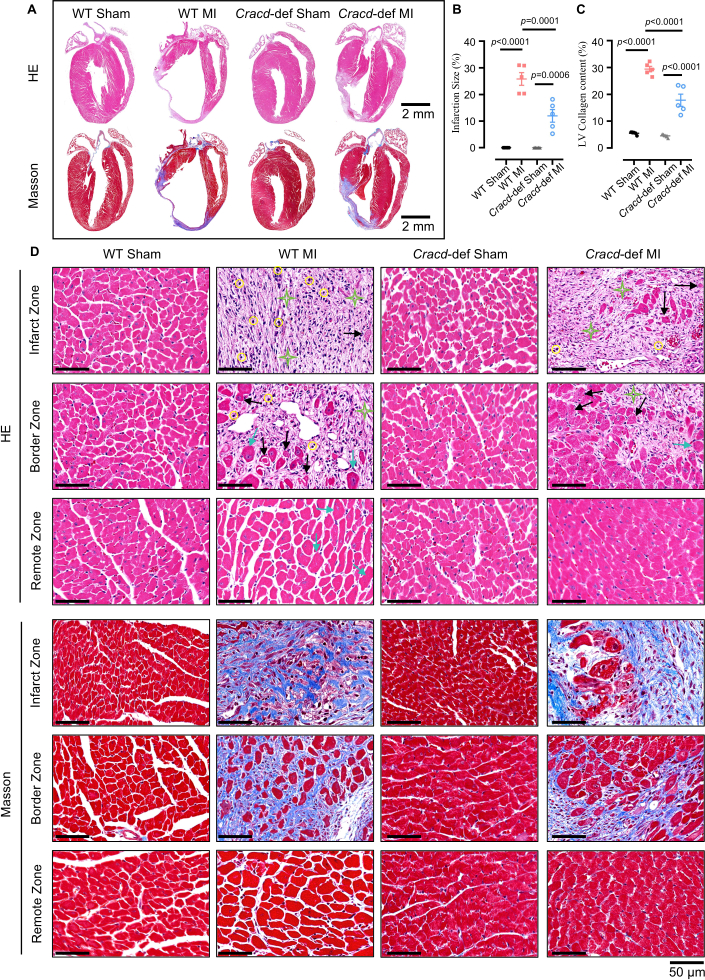
Figure 5: Histopathological analysis of cardiac remodeling after MI. (A) Whole-heart longitudinal sections with H&E and Masson's trichrome staining. Scale bars: 2 mm. (B) Quantitative analysis of infarct size and (C) collagen content. (D) High‑magnification views of infarct zone (IZ), border zone (BZ), and remote zone (RZ). H&E: yellow circles = inflammatory infiltration; black arrows = myocardial necrosis; green stars = fibrosis; blue arrows = hypertrophy. Masson’s trichrome: blue indicates collagen deposition. Scale bar: 50 μm. n = 5 mice per group. Data are presented as mean ± SEM. Statistical significance was determined by one-way ANOVA followed by Tukey's multiple comparisons test. Please click here to view a larger version of this figure.
Discussão
Neste estudo, geramos um camundongo deficiente em Cracd projetado com CRISPR/Cas9 e estabelecemos um fluxo de trabalho para fenotipá-lo após IAM utilizando ecocardiografia convencional, imagem de deformação por rastreamento de speckle e histologia. O protocolo gerou animais knockout com perda confirmada da proteína CRACD. Camundongos deficientes em Cracd apresentaram menor dilatação ventricular, melhor FE e fibrose reduzida em comparação aos controles WT após IAM, confirmando a utilidade do modelo para o estudo do remodelamento cardíaco.
O sucesso deste modelo depende de várias etapas críticas. O planejamento do gRNA e sua validação in vitro afetam diretamente a eficiência da edição em zigotos23. Utilizamos o CRISPick ou o Benchling para selecionar gRNAs com pontuações CRISPRater ≥ 0,5 e, em seguida, testamos a eficiência de clivagem com um ensaio in vitro de Cas9/gRNA. Apenas gRNAs que atinjam clivagem > 50% são microinjetados. A ligadura adequada da ADA também é igualmente crucial: o fio 7‑0 deve passar a 2–3 mm da origem da ADA com uma profundidade de 0,5–1 mm para evitar perfurar o ventrículo direito (muito profundo) ou não obstruir o vaso (muito superficial); o embranquecimento imediato da parede anterior confirma a obstrução. O controle da frequência cardíaca durante a ecocardiografia também é essencial24; manter a frequência entre 450–550 bpm mediante ajuste da concentração de isoflurano (geralmente 1–2%) melhora a reprodutibilidade das medidas convencionais e de deformação. Por fim, para a análise de rastreamento de padrão de ruído (speckle-tracking), a avaliação visual da malha codificada por cores é essencial25. A malha deve seguir os limites do miocárdio sem movimentos abruptos; caso contrário, é necessária correção manual; se a qualidade permanecer insatisfatória após três tentativas, o camundongo é excluído.
Mesmo quando o protocolo é seguido meticulosamente, certas dificuldades técnicas podem surgir. A solução sistemática de problemas pode resolver a maioria delas. Taxas baixas de transmissão germinativa (abaixo de 10%) geralmente indicam má integração do oligonucleotídeo doador ou atividade fraca do gRNA26. Consequentemente, aumentar o oligo doador para 20 ng/µL, estender os braços de homologia para 120–200 pb e reavaliar a clivagem do gRNA (> 50%) pode melhorar a transmissão. Alta mortalidade pós-IM (acima de 30%) frequentemente resulta de pneumotórax, hemorragia e grande infarto27. Assim, manter os camundongos com oxigênio contínuo até despertarem e usar uma placa aquecida para manter a temperatura corporal reduz significativamente as taxas de mortalidade. Se a parede anterior não ficar pálida após a ligadura, provavelmente a artéria descendente anterior (ADA) foi mal identificada ou o ponto está muito superficial. Nesse caso, relocar a ADA (um vaso diagonal vermelho brilhante) e passar novamente a agulha a uma profundidade de 0,5–1 mm, às vezes com auxílio de um microscópio estereoscópico, resolve esse problema. Para qualidade ruim no rastreamento de speckle, baixa taxa de quadros, bordas desfocadas ou artefatos de movimento são as causas mais comuns28. Assim sendo, aumentar a taxa de quadros, ajustar com precisão o ganho, corrigir manualmente o traçado endocárdico e descartar ciclos com arritmias ajudam a resolver o problema.
Além dessas considerações operacionais, o método apresenta limitações claras. O knockout de Cracd é global, de modo que CRACD está ausente em todos os tecidos. Consequentemente, a proteção observada não pode ser atribuída exclusivamente aos cardiomiócitos, já que contribuições sistêmicas também podem desempenhar um papel. Seria necessário um knockout condicional para separar os papéis específicos a cada tipo celular. Outra limitação é o único ponto temporal no dia 7; não se observa nada sobre remodelação crônica. Portanto, pontos temporais posteriores (4 ou 8 semanas) devem ser adicionados para estudos de longo prazo. A reprodutibilidade também é afetada pela dependência da qualidade da imagem: nem todo sistema de ultrassom consegue fornecer bordas endocárdicas nítidas, e a experiência do operador é relevante. Assim, recomenda-se que uma pessoa profissionalmente treinada realize todas as cirurgias e medições.
Diante dessas limitações, é útil comparar nossa abordagem com estratégias alternativas para estudar a função gênica no remodelamento pós-IM. A manipulação genética mediada por AAV e oligonucleotídeos antisense (ASOs) são duas alternativas comuns29,30. O AAV9 pode promover superexpressão ou silenciamento transitórios e específicos para o coração sem a necessidade de cruzamento, mas suas limitações de empacotamento (~4,7 kb), eficiência variável de transdução e efeitos fora do alvo são desvantagens31. Em contraste, nosso modelo de interrupção por CRISPR/Cas9 oferece perda permanente e completa da função, o que é vantajoso para estudos de longo prazo. Os ASOs proporcionam silenciamento reversível e dependente de dose, com início rápido, tornando-os adequados para intervenções agudas; no entanto, exigem administração repetida e não possuem especificidade tecidual32. Portanto, a interrupção constitutiva descrita aqui é a mais indicada para descobertas iniciais e fenotipagem crônica.
Por fim, o protocolo pode ser ampliado para além do CRACD. O mesmo fluxo de trabalho — geração de camundongos knockout por CRISPR/Cas9 combinada com ecocardiografia, imagem de deformação e histologia — pode avaliar qualquer gene candidato no remodelamento pós-IM. A estrutura de fenotipagem também se adapta a outros modelos de doenças cardiovasculares, como constrição aórtica transversa (sobrecarga de pressão) ou lesão por isquemia-reperfusão. Além disso, as amostras de tecido obtidas com este protocolo podem ser utilizadas em análises de multi-ômicas (transcriptômica, proteômica, metabolômica) para revelar mecanismos moleculares. O modelo deficiente em Cracd pode servir como uma ferramenta para testes de fármacos: compostos suspeitos de agir por meio da via CRACD podem ser avaliados. Assim, este protocolo fornece uma plataforma adaptável a uma ampla gama de estudos mecanísticos e translacionais na pesquisa cardiovascular.
Divulgações
Os autores declaram que não possuem interesses concorrentes.
Agradecimentos
Este trabalho foi apoiado pela Fundação Básica e Aplicada de Guangdong para Pesquisa (2023A1515011278), pelo Projeto Autofinanciado do Instituto de Pesquisa em Biotecnologia da Província de Guangdong (GDBRI-ZL202602) e pelo Programa de Intercâmbio e Cooperação Acadêmica China-Canadá sobre Modelos e Patogênese de Doenças Cardiovasculares (MS202500058).
Materiais
| Nome | Empresa | Número de catálogo | Comentários |
|---|---|---|---|
| ACRISPR/Cas9 | |||
| Solução de Cloreto de Trizma | Sigma-Aldrich, USA | T2663 | Utilizada para preparar o tampão de extração de DNA |
| Protease K | Sigma-Aldrich, USA | 539480 | Utilizada para digestão da cauda de camundongo |
| Green Taq Mix | Vazyme, China | P131 | Utilizada para amplificação por PCR |
| Agarose | BioFroxx, Germany | 1110GR500 | Utilizada para eletroforese em gel de DNA em concentração de 1–2% |
| Marcador de DNA | Thermo Scientific, USA | SM0242 | Utilizado como escada de DNA para determinação do tamanho dos produtos de PCR |
| Kit TIANamp de DNA Genômico | Tiangen Biotech, China | DP304 | Utilizado para extração de DNA genômico a partir de tecido da cauda de camundongo |
| Kit de transcrição MEGAshortscript™ T7 | Thermo Scientific, USA | AM1354 | Utilizado para transcrição in vitro de gRNA |
| Kit de purificação de RNA | Zymo Research, USA | R1016 | Utilizado para purificação do gRNA transcrito |
| Kit de Triagem de sgRNA BeyoCRISPR™ | Beyotime, China | D8412S | Utilizado para avaliação in vitro da atividade de clivagem do gRNA |
| Inibidor de RNase | NEB, USA | M0314 | Utilizado para prevenir a degradação do RNA durante a transcrição in vitro |
| TaKaRa Taq | Takara Bio, Japan | R001A | Utilizado para genotipagem por PCR do DNA da cauda de camundongo |
| Meio de Pré-incubação de Espermatozoides FERTIUP® para Camundongos: PM | Cosmo Bio, Japan | KYD-002-EX | Utilizado para capacitação espermática antes da fertilização in vitro |
| Kit T7 ARCA mRNA | NEB, USA | E2060 | Utilizado para transcrição in vitro de mRNA de Cas9 |
| Gonadotrofina de Soro de Égua Preñada | MCE, USA | 9002-70-4 | Utilizada para superovulação, administrada por injeção intraperitoneal |
| Gonadotrofina Coriônica Humana | ProSpec, Israel | HOR-250 | Utilizada para indução da ovulação, administrada por injeção intraperitoneal |
| Água livre de RNase | Aladdin, China | R665526 | Utilizada para dissolução de RNA e preparação de reações de PCR |
| Primer | Sangon Biotech, China | / | Utilizados para genotipagem |
| Cirurgia | |||
| Isóflurano | RWD Life Science, China | R510-22-10 | Utilizado para indução e manutenção da anestesia durante a cirurgia |
| Creme depilatório | Veet, France | 1000207 | Aplicado na região torácica para remoção de pelos antes da cirurgia e ultrassonografia |
| Sutura 7-0 | Lingqiao, China | LQ7022380206 | Utilizada para ligadura permanente da artéria coronária descendente anterior esquerda (LAD) |
| Sutura 4-0 | Lingqiao, China | LQ4022380412 | Utilizada para fechamento da incisão cutânea após a cirurgia |
| Ventilador anestésico | Harvard Apparatus, USA | Tabletop | Utilizado para administração de isóflurano e suporte respiratório |
| Ventilador para pequenos animais | Taimeng, China | HX-101E | Utilizado para fornecer ventilação com pressão positiva durante cirurgia torácica aberta |
| Almofada aquecida com temperatura constante | TigerGene, USA | TG-TP-GS | Utilizada para manter a temperatura corporal do camundongo durante a cirurgia e recuperação |
| Retrador de costelas | Shenzhen Huayon Biotech, China | LN-18-4101 | Utilizado para separar as costelas e expor o coração para ligadura da LAD |
| Tesoura | Shenzhen Huayon Biotech, China | 18-0551 | Utilizada para fazer incisões na pele e cortar tecidos |
| Microsscópio estereoscópico | Nikon, Japan | SMZ 745 | Utilizado para fornecer uma visão ampliada durante a cirurgia de ligadura da artéria LAD |
| Porta-agulha microscópico | Shenzhen Huayon Biotech, China | 18-2211 | Utilizado para manipular a agulha fina de sutura 7-0 sob o microscópio |
| Produtos químicos e reagentes | |||
| Agentes acoplantes ultrassônicos | Tianjin Jinya Technology Development, China | TM-100 | Aplicados no tórax para ecocardiografia, garantem contato adequado da sonda |
| Paraformaldeído | Sigma-Aldrich, USA | V900894 | Utilizado para fixação do tecido cardíaco após a coleta |
| Xilol | Macklin, China | 1330-20-7 | Utilizado para remoção de parafina e clareamento do tecido antes da coloração |
| Hematoxilina | Sigma-Aldrich, USA | H3136 | Corante nuclear, utilizado na coloração HE |
| Eosina | Sigma-Aldrich, USA | E4009 | Corante citoplasmático, utilizado na coloração HE |
| Ponceau S | Sigma-Aldrich, USA | P3504 | Utilizado na coloração de Masson para coloração do citoplasma |
| Ácido fosfomolíbdico | Sigma-Aldrich, USA | 221856 | Utilizado na coloração de Masson como mordente e para diferenciação |
| Solução de azul de anilina | Sigma-Aldrich, USA | 415049 | Utilizada na coloração de Masson para coloração de fibras colágenas (azul) |
| Anticorpo CRACD | Absea, China | KC-35356 | Anticorpo primário para detecção da proteína CRACD por Western Blot, diluição 1:2000 |
| Anticorpo GAPDH | CST, USA | 2118S | Anticorpo de controle de carga para Western Blot, diluição 1:5000 |
| Etanol | Macklin, China | 64-17-5 | Utilizado para desidratação e preparação de reagentes (concentrações de 70%, 80%, 95%, 100%) |
| Equipamentos de laboratório | |||
| Centrifuga Sorvall™ Legend™ Micro 17 | Thermo Scientific, USA | 75002541 | Utilizada para preparação rotineira de amostras |
| Ciclador térmico de PCR | Bio-Rad Laboratories, USA | 1861096 | Utilizado para amplificação de DNA |
| Sistema de microinjeção | Eppendorf, Germany | 5193000020 | Utilizado para microinjeção de reagentes CRISPR/Cas9 em zigotos |
| Sistema de imagem Vevo 2100 | VisualSonics, Canada | Vevo2100 | Sistema de imagem de alta frequência para avaliação não invasiva da função e estrutura cardíaca após infarto |
| Microsscópio óptico | Leica, Germany | DM2500 | Utilizado para observar cortes cardíacos corados com HE e Masson |
| Software de análise | |||
| ImageJ | National Institutes of Health, USA | / | Utilizado para análise de imagens, incluindo medição de área, quantificação de sinal e processamento de imagens histológicas (colorações HE e Masson) |
| VevoLab 3.2.0 / VevoStrain | VisualSonics, Canada | / | Software VevoLab para análise da função cardíaca; módulo VevoStrain utilizado para análise de deformação miocárdica para avaliação do desempenho cardíaco após infarto |
| GraphPad Prism 8 | GraphPad Software, USA | / | Utilizado para análise estatística e preparação de gráficos |
Referências
- Fauconnier, J., Meli, A. C., Thireau, J., Roberge, S., Shan, J., et al. Ryanodine receptor leak mediated by caspase-8 activation leads to left ventricular injury after myocardial ischemia-reperfusion. Proc Natl Acad Sci U S A. 108 (32), 13258-13263 (2011).
- Cohn, J. N., Ferrari, R., Sharpe, N. Cardiac remodeling-concepts and clinical implications: a consensus paper from an international forum on cardiac remodeling. J Am Coll Cardiol. , (2000).
- Liu, D., Tian, X., Liu, Y., Song, H., Cheng, X., et al. CREG ameliorates the phenotypic switching of cardiac fibroblasts after myocardial infarction via modulation of CDC42. Cell Death Dis. 12 (4), (2021).
- Contessotto, P., Pandit, A. Therapies to prevent post-infarction remodelling: from repair to regeneration. Biomaterials. 275, (2021).
- Zhu, R., Sun, H., Yu, K., Zhong, Y., Shi, H., et al. Interleukin-37 and dendritic cells treated with interleukin-37 plus troponin I ameliorate cardiac remodeling after myocardial infarction. J Am Heart Assoc. 5 (12), (2016).
- Chang, Y., Zhang, J., Huo, X., Qu, X., Xia, C., et al. Substrate rigidity dictates colorectal tumorigenic cell stemness and metastasis via CRAD-dependent mechanotransduction. Cell Rep. 38 (7), (2022).
- Seo, Y., Jang, J., Ko, K. P., Zou, G., Huang, Y., et al. Actin dysregulation induces immune evasion via oxidative stress-activated PD-L1 in gastric cancer. bioRxiv. , (2024).
- Kim, B., Zhang, S., Huang, Y., Ko, K. P., Jung, Y. S., et al. CRACD loss induces neuroendocrine cell plasticity of lung adenocarcinoma. Cell Rep. 43 (6), (2024).
- Jung, Y. S., Wang, W., Jun, S., Zhang, J., Srivastava, M., et al. Deregulation of CRAD-controlled cytoskeleton initiates mucinous colorectal cancer via β-catenin. Nat Cell Biol. 20 (11), 1303-1314 (2018).
- Liu, Z., Cao, H., Shi, Y., Yang, R. KIAA1211 plays an oncogenic role in human non-small cell lung cancer. J Cancer. 10 (26), 6747-6753 (2019).
- Snider, P. L., Snider, E., Simmons, O., Lilly, B., Conway, S. J. Analysis of uncharacterized mKiaa1211 expression during mouse development and cardiovascular morphogenesis. J Cardiovasc Dev Dis. 6 (2), (2019).
- Lin, Y. H., Warren, C. M., Li, J., McKinsey, T. A., Russell, B. Myofibril growth during cardiac hypertrophy is regulated through dual phosphorylation and acetylation of the actin capping protein CapZ. Cell Signal. 28 (8), 1015-1024 (2016).
- Yang, F. H., Pyle, W. G. Reduced cardiac CapZ protein protects hearts against acute ischemia-reperfusion injury and enhances preconditioning. J Mol Cell Cardiol. 52 (3), 761-772 (2012).
- Tong, C., Huang, G., Ashton, C., Wu, H., Yan, H., et al. Rapid and cost-effective gene targeting in rat embryonic stem cells by TALENs. J Genet Genomics. 39 (6), 275-280 (2012).
- Cordes, S. P. N-ethyl-N-nitrosourea mutagenesis: boarding the mouse mutant express. Microbiol Mol Biol Rev. 69 (3), 426-439 (2005).
- Cong, L., Ran, F. A., Cox, D., Lin, S., Barretto, R., et al. Multiplex genome engineering using CRISPR/Cas systems. Science. 339 (6121), 819-823 (2013).
- Kanke, K. L., Rayner, R. E., Bozik, J., Abel, E., Venugopalan, A., et al. Single-stranded DNA with internal base modifications mediates highly efficient knock-in in primary cells using CRISPR-Cas9. Nucleic Acids Res. 52 (22), 13561-13576 (2024).
- Mihos, C. G., Liu, J. E., Anderson, K. M., Pernetz, M. A., O'Driscoll, J. M., et al. Speckle-tracking strain echocardiography for the assessment of left ventricular structure and function: a scientific statement from the American Heart Association. Circulation. 152 (10), (2025).
- Garg, P. K., Biggs, M. L., Kizer, J. R., Shah, S. J., Psaty, B., et al. Glucose dysregulation and subclinical cardiac dysfunction in older adults: the Cardiovascular Health Study. Cardiovasc Diabetol. 21 (1), (2022).
- Asanuma, T., Fukuta, Y., Masuda, K., Hioki, A., Iwasaki, M., et al. Assessment of myocardial ischemic memory using speckle tracking echocardiography. JACC Cardiovasc Imaging. 5 (1), 1-11 (2012).
- Chong, S. Y., Zharkova, O., Yatim, S. M. J. M., Wang, X., Lim, X. C., et al. Tissue factor cytoplasmic domain exacerbates post-infarct left ventricular remodeling via orchestrating cardiac inflammation and angiogenesis. Theranostics. 11 (19), 9243-9261 (2021).
- Hung, C. L., Verma, A., Uno, H., Shin, S. H., Bourgoun, M., et al. Longitudinal and circumferential strain rate, left ventricular remodeling, and prognosis after myocardial infarction. J Am Coll Cardiol. 56 (22), 1812-1822 (2010).
- Labuhn, M., Adams, F. F., Ng, M., Knoess, S., Schambach, A., et al. Refined sgRNA efficacy prediction improves large- and small-scale CRISPR-Cas9 applications. Nucleic Acids Res. 46 (3), 1375-1385 (2018).
- Wu, J., Bu, L., Gong, H., Jiang, G., Li, L., et al. Effects of heart rate and anesthetic timing on high-resolution echocardiographic assessment under isoflurane anesthesia in mice. J Ultrasound Med. 29 (12), (2010).
- Voigt, J. U., Pedrizzetti, G., Lysyansky, P., Marwick, T. H., Houle, H., et al. Definitions for a common standard for 2D speckle tracking echocardiography: consensus document of the EACVI/ASE/Industry Task Force to standardize deformation imaging. J Am Soc Echocardiogr. 28 (2), 183-193 (2015).
- Port, F., Chen, H. M., Lee, T., Bullock, S. L. Optimized CRISPR/Cas tools for efficient germline and somatic genome engineering in Drosophila. Proc Natl Acad Sci U S A. 111 (29), (2014).
- Gao, E., Lei, Y. H., Shang, X., Huang, Z. M., Zuo, L., et al. A novel and efficient model of coronary artery ligation and myocardial infarction in the mouse. Circ Res. 107 (12), 1445-1453 (2010).
- Rösner, A., Barbosa, D., Aarsæther, E., Kjønås, D., Schirmer, H., et al. The influence of frame rate on two-dimensional speckle-tracking strain measurements: a study on silico-simulated models and images recorded in patients. Eur Heart J Cardiovasc Imaging. 16 (10), 1137-1147 (2015).
- Argiro, A., Bui, Q., Hong, K. N., Ammirati, E., Olivotto, I., et al. Applications of gene therapy in cardiomyopathies. JACC Heart Fail. 12 (2), 248-260 (2024).
- Micheletti, R., Plaisance, I., Abraham, B. J., Sarre, A., Ting, C. C., et al. The long noncoding RNA Wisper controls cardiac fibrosis and remodeling. Sci Transl Med. 9 (395), (2017).
- Wu, Z., Yang, H., Colosi, P. Effect of genome size on AAV vector packaging. Mol Ther. 18 (1), 80-86 (2010).
- Juliano, R. L. The delivery of therapeutic oligonucleotides. Nucleic Acids Res. 44 (14), 6518-6548 (2016).
Reimpressões e permissões
