Este protocolo descreve métodos para gerar peixes-zebra transgênicos com múltiplos transgenes, imagens de células imunológicas associadas a tumores em peixes-zebra larvais e adultos, e quantificação da frequência de células imunológicas dentro do microambiente tumoral.
Artigo de método
Imagem e Quantificação de Células Imunes no Microambiente Tumoral Utilizando um Modelo de Neuroblastoma em Zebrafish
* These authors contributed equally
Neste artigo
Resumo
Resumo
O recrutamento de células imunes para o microambiente tumoral (MAT) é um componente importante da regulação imune e da progressão tumoral. O estudo das relações espaciais e temporais entre células imunes e tumorais in vivo pode fornecer informações sobre as interações no interior do MAT. No entanto, a visualização e quantificação dessas interações em organismos intactos permanece desafiadora com abordagens convencionais de imagem e histológicas. O peixe-zebra constitui um modelo valioso para a pesquisa do câncer devido à sua manipulabilidade genética, desenvolvimento rápido e transparência óptica nas fases iniciais do desenvolvimento, permitindo a visualização de células marcadas com fluorescência in vivo. Aqui, apresentamos um protocolo para gerar, identificar, imagiar e quantificar células imunes e tumorais diferencialmente marcadas com marcadores fluorescentes em um modelo de peixe-zebra de neuroblastoma. O protocolo inclui o cruzamento e triagem de peixes-zebra transgênicos compostos, a imagiologia in vivo de larvas, o preparo e imagiologia de peixes adultos portadores de tumor, e a quantificação de células imunes ao redor e dentro das regiões tumorais. Utilizando linhagens transgênicas repórter, CD4+ células imunes e MYCNcélulas de neuroblastoma podem ser visualizadas e analisadas em diferentes estágios de desenvolvimento. O fluxo de trabalho permite a avaliação da localização das células imunes em relação aos tumores tanto em peixes larvais quanto adultos e pode ser utilizado para comparar a abundância de células imunes entre os estágios da doença. Este protocolo fornece uma abordagem reprodutível para o imageamento e quantificação de células imunes dentro do microambiente tumoral (TME) in vivo usando peixe-zebra e pode facilitar estudos das interações imune-tumor em outros modelos de câncer.
Introdução
O microambiente tumoral (MAT) é um ecossistema composto por células tumorais, imunes, fibroblastos e vasculares1. O MAT desempenha um papel essencial na progressão do câncer, na resposta terapêutica e na imunidade antitumoral. Dentro do MAT, as células imunes são reguladoras-chave do destino tumoral, participando tanto das respostas antitumorais quanto da indução de imunossupressão2. Compreender o recrutamento, a distribuição e a função das células imunes dentro do MAT é fundamental para elucidar os mecanismos pelos quais os tumores escapam da vigilância imunológica. No entanto, abordagens convencionais para o estudo do MAT, como histologia de ponto final, citometria de fluxo e sequenciamento de célula única, fornecem apenas instantâneos estáticos e muitas vezes exigem a desestruturação do tecido, resultando na perda de informações espaciais e de interações entre células3,4,5,6,7. Além disso, esses métodos têm limitações quanto à capacidade de visualizar e quantificar células imunes dentro do MAT, especialmente nos estágios iniciais do desenvolvimento tumoral.
O peixe-zebra (Danio rerio) é um modelo poderoso para pesquisa em câncer devido ao seu baixo custo, desenvolvimento rápido, transparência relativa e alta conservação genética8,9. Essas vantagens fornecem um sistema experimental reprodutível e escalável que permite tamanhos grandes de amostra e triagem eficiente por microscopia em um curto espaço de tempo10. Importante, o peixe-zebra compartilha uma significativa conservação imunológica com os seres humanos, incluindo componentes-chave dos sistemas imunológicos inato e adaptativo, tornando os achados relevantes para doenças humanas11. Essas propriedades são particularmente úteis para o estudo de cânceres pediátricos, como o neuroblastoma8. Consequentemente, diversas linhagens de peixe-zebra com repórteres imunológicos e modelos de câncer foram desenvolvidas11. Assim, o peixe-zebra atua como um modelo in vivo valioso para estudar as interações entre células tumorais e imunológicas, oferecendo insights sobre como a regulação imunológica molda o desenvolvimento tumoral, especialmente nas fases iniciais.
Estudos anteriores que investigaram o MEV em peixes-zebra basearam-se fortemente em modelos de xenoenxertos tumorais combinados com imagens de ponto final para avaliar a localização de células imunes dentro dos tumores12,13,14,15,16,17. Embora esses métodos forneçam informações úteis, eles são limitados pela dependência de imagens bidimensionais, que não conseguem capturar completamente a organização tridimensional do MEV e as relações espaciais entre células tumorais e imunes durante o desenvolvimento14. Além disso, os modelos de xenoenxerto tumoral envolvem o transplante artificial de células tumorais humanas e podem não recapitular plenamente o início natural do tumor18. Esses modelos também são geralmente de curto prazo e não conseguem capturar completamente a progressão tumoral ou as alterações nas relações espaciais entre células tumorais e imunes durante o desenvolvimento14,19. Além disso, essa abordagem fornece uma representação limitada da organização espacial, do contexto desenvolvimental e da relevância fisiológica do comportamento das células imunes dentro do MEV. Recentemente, nós e outros pesquisadores temos aplicado peixes-zebra transgênicos compostos, nos quais células tumorais e imunes são marcadas diferencialmente com marcadores fluorescentes, para visualizar células imunes associadas a tumores20,21. Esses peixes transgênicos compostos permitem o estudo do MEV ao longo do desenvolvimento do animal e do tumor, facilitando investigações sobre as interações entre o sistema imune e o tumor in vivo.
Aqui, apresentamos um método que utiliza microscopia confocal para estudar células imunes dentro do microambiente tumoral (TME) de um modelo de neuroblastoma em peixe-zebra. Nesta abordagem, utilizamos linhagens de peixe-zebra com repórteres que marcam células imunes e uma linhagem geneticamente modificada de peixe-zebra que superexpressa o oncogene humano MYCN sob o promotor da dopamina-β-hidroxilase (dβh), resultando no desenvolvimento de neuroblastoma semelhante à doença humana20. Neste modelo transgênico composto, células tumorais e imunes são marcadas diferencialmente com EGFP e mCherry, respectivamente. O promotor dβh é ativo em células da linhagem simpaticoadrenal e tem sido usado em múltiplos modelos de neuroblastoma em peixe-zebra22,23,24,25. Além disso, utilizamos um promotor Cd4 que induz a fluorescência de mCherry para visualizar células CD4+15. A aquisição de imagens confocais com pilhas Z foi aplicada para visualizar o TME em três dimensões em diferentes estágios do desenvolvimento tumoral, permitindo a avaliação das relações espaciais entre células tumorais e imunes em tecido intacto. Este método permite a análise da organização das células imunes em relação às células tumorais durante diferentes estágios do desenvolvimento tumoral.
Protocolo
All animal procedures were approved by the Institutional Animal Care and Use Committee (IACUC) at Boston University Chobanian & Avedisian School of Medicine under protocol PROTO202100001. The overall workflow for generation of compound transgenic zebrafish, larval imaging, adult tissue preparation, and image analysis is summarized in Figure 1.
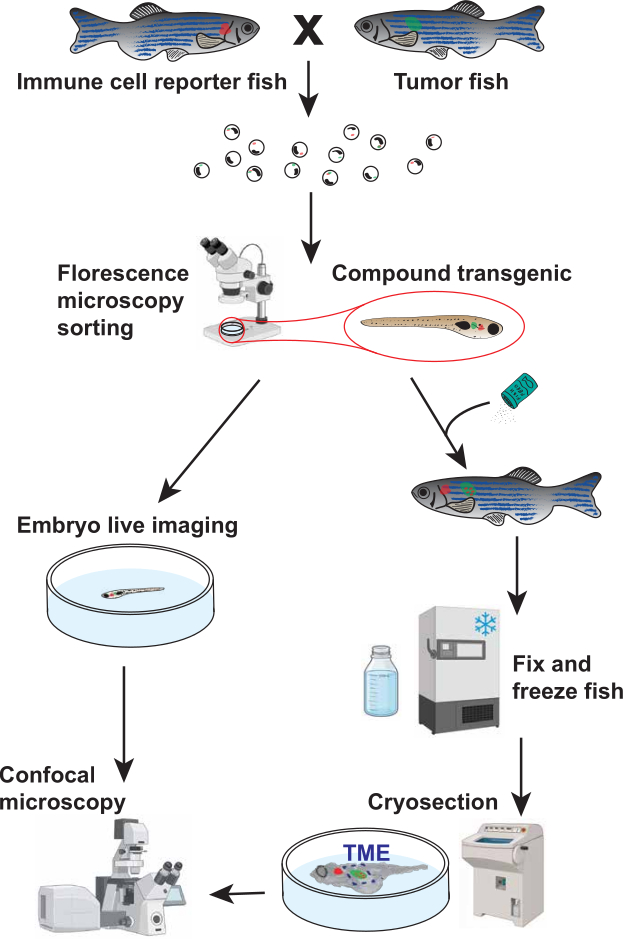
Figure 1. Workflow for visualization and quantification of immune cells within the zebrafish tumor microenvironment (TME). Schematic overview of the experimental workflow. Immune-reporter zebrafish were crossed with tumor-prone zebrafish to generate compound transgenic offspring expressing fluorescent markers in both immune cells (red) and tumor cells (green). Embryos were screened by fluorescence microscopy to identify compound transgenic fish. Selected fish were either subjected to live confocal imaging during larval development (<21 days post-fertilization [dpf]) or processed by fixation, cryosectioning, and confocal imaging for fish older than 21 dpf. This workflow enables visualization and quantification of immune cells associated with the TME across multiple developmental stages. Part of the illustration was created using BioRender. Please click here to view a larger version of this figure.
1. Generation of Compound Transgenic Zebrafish Lines Through Breeding
- Select adult immune-reporter fish and tumor fish that are at least 3 months old for natural breeding.
NOTE: For the representative results, Tg(cd4-1:mCherry) heterozygous fish were crossed with Tg(dβh:MYCN; dβh:EGFP) heterozygous fish to differentially label immune cells and tumor cells15,23. - On the evening before breeding, fill a two-chamber mating tank two-thirds full with fish water.
- Place a grated top insert into the mating chamber. Use dividers to separate one male from one or two females.
- Leave the dividers in place overnight. Add artificial plants or other enrichment items to simulate natural breeding conditions.
NOTE: A 1:2 male-to-female ratio increases the likelihood of successful spawning when breeding tumor male fish with immune-reporter fish. Do not breed two males with one female, as competition between males may occur. - On the following morning, remove the dividers after the facility lights turn on.
- Tilt the grated top chamber slightly using the divider as a wedge to create a shallow water area. Allow the fish to spawn for at least 1 h.
- Collect eggs from the bottom of the mating chamber by pouring the water through a fine-mesh net.
- Transfer the eggs to a sterile Petri dish containing fish water at a density no greater than 1 egg per 50 mm2 (approximately 200 eggs per 100 mm dish).
- Remove dead and unfertilized eggs.
NOTE: Healthy fertilized eggs are translucent and round. Remove cloudy, white, unfertilized, or deformed eggs. - Double-check the fish to avoid mixing sexes or cross-contaminating transgenic tanks.
- Return the males and females to their respective tanks.
- Place the embryos in a 28.5°C incubator overnight. Do not exceed the embryo density specified in Step 1.8.
- Bleach the embryos on the following morning to remove contaminants.
- Prepare a working bleach solution consisting of 100 µL bleach in 200 mL system water. Prepare a neutralization solution consisting of 0.5 g sodium thiosulfate in 150–200 mL system water.
- Sort and transfer viable embryos into a mesh-net well insert. Submerge the insert in the bleach solution for 5 min.
- Transfer the insert directly into the sodium thiosulfate solution. Incubate for 2 min to neutralize residual bleach.
- Rinse the embryos in a final bath of fresh system water. Use a squirt bottle to gently transfer the embryos into clean petri dishes containing fresh system water.
- Return the embryos to the incubator after bleaching.
- Transfer larvae at 5–7 days post-fertilization (dpf) or later to a larger tank containing 5 ppt rotifer water for rearing.
- Prepare 5 ppt rotifer water by mixing 1 part stock rotifer water (15 ppt) with 2 parts zebrafish system water.
- Verify that the final salinity is 5 ppt using a conductivity meter before transferring the larvae.
NOTE: Sorting EGFP+ MYCN larvae at 3–5 dpf facilitates identification of tumor-prone fish before rearing. Sorting MYCN embryos at this stage avoids false-negative identification because EGFP expression in neural crest cells may decrease later in development due to MYCN-induced apoptosis.
2. Screening Zebrafish for Fluorescent Markers
- Prepare a 0.4% (w/v) tricaine stock solution using system water.
- Transfer the fish to a clean petri dish containing only enough system water to cover the bottom.
- Add the tricaine stock solution to achieve a final concentration of approximately 0.005% (50 mg/L) for fish younger than 14 dpf or 0.012% (120 mg/L) for fish older than 14 dpf. Confirm adequate anesthesia by observing little to no voluntary movement.
- Remove excess water from the dish once the fish are anesthetized and no longer capable of swimming while maintaining visible opercular or cardiac movement.
- Screen the fish for fluorescence. Identify green or red fluorescence in the expected region (e.g., the interrenal gland region in MYCN fish).
- Separate the fish into groups using a stiff-bristled sorting tool.
NOTE: Sort tumor-prone fish as early as possible because MYCN-induced apoptosis during later developmental stages may result in false-negative identification. Sort immune-reporter fish immediately before imaging at the larval stage or between 2 and 4 months of age for adult studies. This approach minimizes handling-associated stress and maximizes survival. - Transfer positive and negative fish to separate tanks containing system water for continued rearing.
NOTE: Step 3 describes handling and imaging of larvae younger than 21 dpf. Steps 4–6 describe fixation, tissue preparation, imaging, and image analysis of older fish.
3. Larval Live-Mounting and Imaging
- Place sorted larvae in a 100 mm petri dish containing tricaine fish water (see Step 2.3 for age-appropriate concentrations).
- Transfer the sedated larvae to a glass-bottom imaging dish.
- Use only enough solution to cover the larva and maintain sedation.
- Prepare 1%–1.5% low-melting agarose in fish water. Heat the agarose solution until fully dissolved.
- Allow the agarose to cool for 1–2 min. Maintain the agarose at 30°C using a heat block to prevent solidification prior to mounting.
- Position each larva laterally in the imaging dish.
- Apply approximately 30–200 µL of agarose over the larva to immobilize it. Use larger volumes for larger larvae and smaller volumes for smaller larvae.
- Once the agarose has solidified, add approximately 100 µL of 0.005% tricaine solution over the agarose.
- Image the larvae using a confocal microscope.
- Use a standard laser-scanning confocal microscope with a resonant scanner. Use a 40× objective with a numerical aperture greater than 1.10.
- Set the pinhole to 1.0 Airy unit (AU) for all imaging channels.
- Use a 488 nm laser for EGFP excitation and a 594 nm laser for mCherry excitation. Keep laser output below 25 mW to minimize photobleaching and phototoxicity. Adjust detector gain and laser power using a range indicator lookup table (LUT) to avoid pixel saturation and black clipping. Do not exceed a detector gain of 800 V because higher voltages introduce excessive noise.
- Use a voxel size of 0.42 × 0.42 × 6.0 µm (x, y, z) at a resolution of 1024 × 1024 pixels and a Z-step interval of 6.0 µm. Acquire optical sections continuously through the full volume of interest, typically spanning 90–120 µm in total imaging depth. Use highly sensitive photodetectors operating in 16-bit acquisition mode.
- Acquire images using unidirectional line scanning at a resonant scan frequency of 33.3 kHz (approximately 1.58 µs pixel dwell time). Use 2× or 4× averaging to reduce motion artifacts while limiting laser exposure.
NOTE: Optimize tricaine exposure to maintain larval survival during imaging. After imaging, add fish water until the imaging dish is approximately half full.
- Add fresh fish water to the imaging dish immediately after imaging.
- Gently remove the larva from the agarose using a stiff-bristled stick and transfer the larva to a dish containing clean fish water for recovery.
- Return the fish to its original tank once normal swimming behavior resumes.
NOTE: For fish older than 21 dpf, the skin overlying the tumor must be removed by cryosectioning to enable high-resolution confocal imaging.
4. Fish Fixation and Cryosectioning
- Euthanize fish in accordance with approved institutional animal care guidelines.
- Make a ventral incision extending from the anal pore to the pectoral girdle to expose the abdominal cavity and facilitate fixative penetration into internal tissues.
- Transfer the fish using forceps into a 1.5 mL tube containing 4% paraformaldehyde (PFA) in phosphate-buffered saline (PBS) or a volume of fixative at least 10-fold greater than the tissue volume.
NOTE: Avoid handling the region containing the tumor to preserve tissue integrity. - Place the samples on a nutating rocker set to gentle continuous agitation (30 rpm) and incubate overnight for at least 12 h at 4°C.
CAUTION: PFA is hazardous, toxic, and potentially carcinogenic. Wear appropriate personal protective equipment, including gloves and eye protection. Perform all procedures involving PFA in a fume hood and avoid inhalation of vapors. - Remove the PFA and wash the samples at least four times with 1.5 mL of 1× PBS. Gently invert the tube two to three times during each wash.
- Transfer the fish to 30% sucrose prepared in PBS.
- Incubate the fish in a cold room overnight until the specimen sinks to the bottom of an upright tube (approximately 12 h), indicating adequate sucrose penetration.
- Remove excess sucrose solution by gently blotting the fish on a laboratory tissue.
- Transfer the fish to storage tubes.
- Store the samples at −80°C until imaging.
NOTE: Process samples within 3 months to minimize fluorescent protein degradation and signal loss. - Transport the fixed fish to the cryostat room on dry ice.
- Place the fish flat in a plastic mold with one sagittal side facing downward.
- Add Optimal Cutting Temperature (OCT) compound until the fish is fully covered.
- Freeze the mold at −20°C or in the cryostat until the OCT turns white.
NOTE: Position the fish as flat as possible before freezing to facilitate consistent sectioning. - Cryosection the zebrafish in the sagittal plane to remove the skin for subsequent whole-mount imaging.
- Cool the cryostat chuck.
- Apply room-temperature OCT to the chuck.
- Press the OCT fish block firmly into the OCT layer.
- Freeze the chuck and block until the newly applied OCT turns white.
- Mount the chuck in the cryostat.
- Cryosection the block at a thickness of 14 µm until the blade reaches the specimen.
NOTE: Specimen shifting may occur during freezing, causing the fish to sit higher in the block than expected. Entry into the specimen is indicated by the appearance of translucent tissue replacing the opaque OCT background. - Reduce the section thickness to 7 µm.
- Continue sectioning for one additional cut.
NOTE: This procedure removes the skin while preserving a uniform sagittal profile across the specimen. - Confirm the endpoint by identifying skin in the collected sections.
NOTE: Skin appearance in sections provides a more reliable indicator than eye morphology. Perform this procedure only when the skin obscures imaging of the tumor microenvironment.
- Warm the chuck gently with your hands.
- Remove the OCT block from the chuck using forceps. Avoid disturbing the cut surface of the specimen.
- Trim excess OCT surrounding the fish while the OCT remains frozen.
- Remove the fish from the OCT block using forceps once the OCT softens to a viscous consistency.
5. Mounting and Imaging of Fish with Skin Removed
- Place the fish in a glass-bottom dish with the sectioned sagittal side facing the glass surface.
NOTE: Maintain the orientation of the fish during handling. Identifying the sectioned side may become difficult after the fish is removed from the OCT block. - Prepare 1%–1.5% low-melting agarose.
- Apply approximately 30–50 µL of agarose to the dorsal and ventral sides of the fish to secure the sample.
NOTE: Avoid placing agarose beneath the fish because it can reduce image quality. Use only the minimum amount of agarose required for stabilization. - Keep the sample on ice during transport. Image the sample within 2 h of mounting.
- Transport the sample to the confocal microscopy facility.
- Image the sample using confocal microscopy.
- Use a standard laser-scanning confocal microscope with a resonant scanner. A two-photon microscope may be used when autofluorescence limits image quality. Use a corrected 20× objective lens with a numerical aperture of at least 0.80.
- Set the pinhole to 1.0 Airy unit (AU) for all imaging channels.
- Use a 488 nm laser for EGFP excitation and a 594 nm laser for mCherry excitation. Keep laser output below 25 mW. Adjust detector gain and laser power using a range indicator lookup table (LUT) to avoid pixel saturation and black clipping. Do not exceed a detector gain of 800 V because higher voltages introduce excessive noise.
- Configure image acquisition parameters as follows.
- Use a voxel size of 0.42 × 0.42 × 6.0 µm (x, y, z) at a resolution of 1024 × 1024 pixels and a Z-step interval of 6.0 µm.
- Acquire spectral image stacks through the full volume of interest, typically spanning a total Z-stack acquisition range of 90–120 µm (15–20 optical sections).
- Initiate image acquisition in the fluid space immediately above the tissue surface and continue through the full target imaging depth to ensure complete coverage of the specimen.
- Acquire images using highly sensitive photodetectors operating in 16-bit acquisition mode.
- Acquire images using unidirectional line scanning at a resonant scan frequency of 33.3 kHz (approximately 1.58 µs pixel dwell time) with 8× line averaging.
6. Image Analysis and Quantification
- Image visualization using Fiji (version 1.54p).
- Open the confocal z-stack images.
- Merge colors to see channel overlay by selecting Image > Color > Merge Channels.
- Generate a projection of the full z-range containing the imaging region by selecting Image > Stacks > Z Project. Enter the slice range of interest, as well as Max Intensity projection type. This will display the 2D projection of the image.
NOTE: For larval fish, it is feasible to capture the whole TME by confocal microscopy. Therefore, we recommend the volumetric normalization and quantification method for the TME analysis. For older fish, it is impossible to capture the whole TME by confocal microscopy; therefore, we recommend applying the area-based normalization and quantification method. Based on our analysis and quantification of the larval fish, both methods can provide reliable biological results.
- Volumetric normalization and quantification of the TME in the larval fish.
- Quantifying tumor volume using MATLAB R2022b (download the package from the Matlab website) and Bio-Formats package (download from the openmicroscopy website).
- The user runs a script that performs the following tasks:
- Prompt the user to select a .CZI file from their computer.
- Read the image and extract the data from the channel containing the tumor region.
- Identify the region for each slice that is the tumor region through a threshold of fluorescence (can be through user input or machine learning), keeping the same threshold for all analyzed images for consistency.
- Outline the tumor region and display the image with the tumor region outlined in a collage of all slices for user verification.
- Calculate the area of the tumor region per slice in pixels and convert to mm2 using the scale of the image and imaging settings.
- Multiply the area of the tumor region by the depth (stored in the file’s metadata) to get the volume of each slice.
- Sum the calculated values of each slice to obtain the total volume of the imaged tumor and its surrounding region in voxels or mm3.
- Scale both volume measurements by multiplying by 104 for tumor volume and 106 for the surrounding region. This will create a more reasonable cell number:volume ratio during normalization.
- Quantifying cell number.
- Open the confocal z-stack images.
- Merge colors to see channel overlay by selecting Image > Color > Merge Channels.
- Generate a 3D view of the full z-range containing the imaging region by selecting Image > Stacks > 3D Project. Select Brightest Point as the projection method and other settings to the desired values.
- Due to the small number of cells, manually count and tabulate the cells, separating cells located within the tumor boundary from those located outside the tumor boundary.
NOTE: Cells on the boundary of the tumor region are counted as being outside.
- Normalization.
- For infiltrating cells inside the tumor region, divide the number of cells by the scaled tumor volume. For the cells outside the tumor region, divide the number of cells outside the tumor volume by the scaled volume of the full image minus the tumor volume.
- Generate a table that includes the following headings: “fish identification”, “tumor volume”, “# of cells inside tumor region”, “# of cells outside tumor region”, “normalized cells inside”, “normalized cells outside”.
- Area-based normalization and quantification of the TME.
- Define the tumor region of interest (ROI) using the Rectangle or Freehand selection tool to outline the tumor.
- Add the ROI to the ROI Manager by pressing T or by selecting Analyze > Tools > ROI Manager > Add.
- Measure the ROI area using Analyze > Measure.
- Confirm that Area is selected under Set Measurements before recording measurements.
- Save the ROI in the ROI Manager.
- Apply the same ROI to all images using ROI Manager > More > Multi-Measure.
- Do not resize the ROI between images.
- Manually count cells within the ROI. If cells are more, count cells using the Cell Counter plugin by selecting Plugins > Analyze > Cell Counter.
- Mark each counted cell by left-clicking when its centroid falls within the ROI.
- Scroll through the z-stack to verify cell identity.
- Avoid counting the same cell more than once across multiple image planes.
- Count infiltrating cells separately if they contact or lie within the tumor boundary.
- Record infiltrating cells as a distinct category even when the cell centroid falls outside the ROI.
- Convert the ROI area from pixels to mm2.
- Obtain the pixel width, pixel height, and Z-step interval from Image > Properties.
- Calculation of normalized cell counts.
- Divide the raw cell count for each fish by the corresponding ROI area value.
- Record the resulting value as the normalized cell count.
- For absolute density measurements, calculate the physical area using the image calibration values obtained from Image > Properties.
- Divide the raw cell count by the calculated area (mm2).
- Record the result as cell density expressed as cells/mm2.
Resultados
O fluxo experimental geral é mostrado na Figura 1. Peixes-zebra adultos Tg(cd4-1:mCherry) foram cruzados com peixes-zebra Tg(dβh:MYCN;dβh:EGFP) para gerar descendentes transgênicos duplos nos quais as células CD4+ e as células que expressam dβh foram rotuladas diferencialmente com fluorescência de mCherry e EGFP, respectivamente. Embriões foram selecionados pelos marcadores fluorescentes apropriados e posteriormente analisados por imagem confocal em tempo real durante o desenvolvimento larval ou por imagem confocal após fixação e crioseccionamento em peixes mais velhos (Figura 1).
Para avaliar a associação de células CD4+ com lesões premalignas de neuroblastoma durante o desenvolvimento larval, peixes transgênicos compostos foram analisados aos 7 e 14 dias pós-fertilização (dpf). Os pontos temporais foram escolhidos com base nas fases do desenvolvimento de linfócitos em zebrafish26,27. Imagens confocais representativas são mostradas na Figura 2A. Aos 7 dpf, células CD4+ foram raramente observadas dentro ou ao redor da região que expressa dβh, tanto em peixes controle quanto em peixes que expressam MYCN (Figura 2A; Vídeos Suplementares 1 e 2). Aos 14 dpf, peixes que expressam MYCN exibiram um aumento no número de células CD4+ associadas ao tumor premaligno derivado da crista neural, em comparação com a região de progenitores simpaticoadrenais derivados da crista neural em peixes controle (Figura 2A; Vídeos Suplementares 3 e 4).
Para levar em consideração as diferenças no tamanho do tumor e na capacidade da microscopia confocal de capturar todo o tumor nos peixes larvais, comparamos métodos de normalização baseados em volume e em área. Importante ressaltar que os métodos de normalização baseados em volume e em área geraram resultados comparáveis nos peixes larvais, o que sustenta o uso da normalização baseada em área para tumores em adultos quando o volume total do tumor não pode ser capturado pela microscopia confocal. A quantificação demonstrou ausência de diferença significativa no número de células CD4+ ao redor do tumor entre os grupos em ambos os pontos de tempo (Figura 2B, inferior; n = 4 e 6 aos 7 dpf e n = 4 e 5 aos 14 dpf para os grupos controle e MYCN, respectivamente). Em contraste, os peixes que expressavam MYCN exibiram maior infiltração significativa de células CD4+ dentro da região analisada aos 14 dpf em comparação com os peixes controle (Figura 2B, superior; P < 0,05; n = 4 e 5 para os grupos controle e MYCN, respectivamente). Os dados são apresentados como contagens celulares normalizadas em relação ao volume tumoral (células/mm3) e expressos como média ± erro padrão da média (SEM).
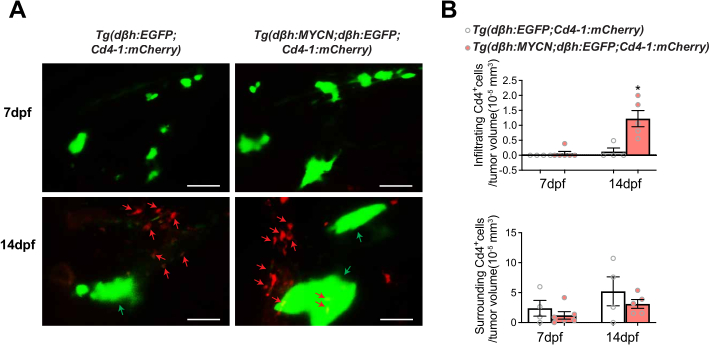
Figura 2. Aumento da associação de células CD4+ com lesões de neuroblastoma que expressam MYCN em 14 dias após a fertilização. (A) Imagens confocais representativas de peixes controle Tg(dβh:EGFP;Cd4-1:mCherry) e peixes Tg(dβh:MYCN;dβh:EGFP;Cd4-1:mCherry) em 7 e 14 dias após a fertilização (dpf). Células positivas para EGFP (verde) marcam células derivadas da crista neural/neuroblastoma que expressam dβh, e as células CD4+ são marcadas com mCherry (vermelho). As setas indicam células CD4+ representativas associadas à região da crista neural/tumoral. Barras de escala = 50 µm. (B) Quantificação de células CD4+ ao redor (parte inferior) e infiltrando (parte superior) a região da crista neural/tumoral em peixes controle e em peixes que expressam MYCN em 7 e 14 dpf. As contagens celulares foram normalizadas em relação ao volume tumoral (células/mm3). Os dados são apresentados como média ± erro padrão da média (SEM). As comparações estatísticas foram realizadas utilizando testes t não pareados bicaudais. P < 0,05. n = 4 e 6 em 7 dpf e n = 4 e 5 em 14 dpf para os grupos controle e MYCN, respectivamente. Dados representativos de três experimentos independentes. Clique aqui para visualizar uma versão maior desta figura.
Para examinar a associação de células CD4+ com tumores estabelecidos, peixes transgênicos compostos classificados foram criados até a idade adulta e analisados após fixação, crioseccionamento e imagem confocal (Figura 1). Imagens representativas de neuroblastoma localizado e metastático de peixes com 4 meses de idade são mostradas na Figura 3A. Os tumores foram classificados como metastáticos quando células tumorais positivas para EGFP foram detectadas fora dos gânglios simpáticos periféricos. Aplicamos um método de quantificação baseado em área, pois a microscopia confocal não consegue capturar todo o volume tumoral. Nossa análise revelou um número significativamente maior de células CD4+ ao redor ou infiltrando tumores metastáticos em comparação com tumores localizados (Figura 3B; P < 0,05; n = 4 por grupo). Os dados são apresentados como contagens normalizadas de células por área tumoral (células/mm2) e expressos como média ± erro padrão da média.
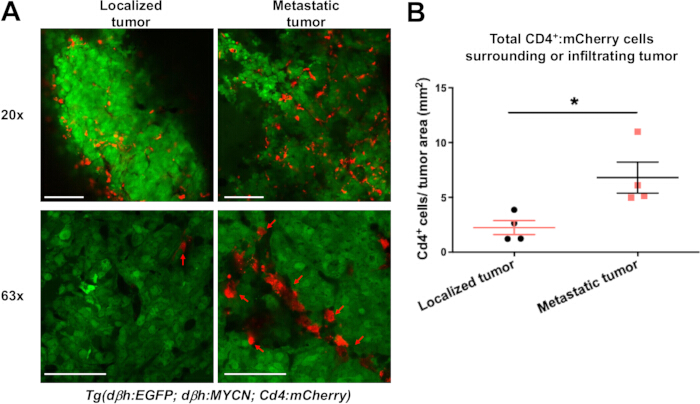
Figura 3. O neuroblastoma metastático apresenta maior infiltração de células CD4+ no microambiente tumoral. (A) Imagens representativas de microscopia confocal de neuroblastoma localizado e metastático em peixes-zebra irmãos de 4 meses de idade, Tg(dβh:MYCN;dβh:EGFP;Cd4-1:mCherry). As células tumorais são marcadas com EGFP (verde) e as células CD4+ são marcadas com mCherry (vermelho). As setas indicam células CD4+ representativas associadas ao tecido tumoral. As imagens obtidas com objetivas de 20× e 63× são mostradas como campos de visão independentes. Barras de escala = 100 µm (20×) e 50 µm (63×). (B) Quantificação do número total de células CD4+ ao redor ou infiltrando tumores localizados e metastáticos. As contagens celulares foram normalizadas em relação ao tamanho do tumor, conforme descrito no protocolo. Os dados são apresentados como média ± erro padrão da média (SEM). As comparações estatísticas foram realizadas utilizando testes t não pareados bicaudais. P < 0,05. n = 4 por grupo. Dados representativos de três experimentos independentes. Clique aqui para visualizar uma versão ampliada desta figura.
Esses achados demonstram que o protocolo pode ser usado para visualizar e quantificar células CD4+ associadas às lesões de neuroblastoma em múltiplas fases do desenvolvimento tumoral em peixe-zebra.
Vídeo Suplementar 1. Z-stack confocal representativo de um peixe-zebra controle aos 7 dias após a fertilização. Imagem confocal tridimensional de um peixe-zebra controle Tg(dβh:EGFP;Cd4-1:mCherry) aos 7 dias após a fertilização (dpf). As células derivadas da crista neural positivas para EGFP são mostradas em verde, e as células CD4+ são mostradas em vermelho. Poucas células CD4+ são observadas dentro ou ao redor da região que expressa dβh nesse estágio de desenvolvimento. Clique aqui para baixar este arquivo.
Vídeo Suplementar 2. Z-stack confocal representativo de um peixe-zebra que expressa MYCN com 7 dias pós-fertilização. Imagem confocal tridimensional de um peixe-zebra Tg(dβh:MYCN;dβh:EGFP;Cd4-1:mCherry) com 7 dias pós-fertilização (dpf). As células pré-malignas de neuroblastoma que expressam MYCN positivas para EGFP são mostradas em verde, e as células CD4+ são mostradas em vermelho. Semelhante aos peixes-controle, poucas células CD4+ são observadas dentro ou ao redor da região tumoral nesta fase inicial do desenvolvimento. Clique aqui para baixar este arquivo.
Vídeo Suplementar 3. Representação de z-stack confocal de um peixe-zebra controle aos 14 dias pós-fertilização. Imagem confocal tridimensional de um peixe-zebra controle Tg(dβh:EGFP;Cd4-1:mCherry) aos 14 dias pós-fertilização (dpf). As células derivadas da crista neural positivas para EGFP são mostradas em verde, e as células CD4+ são mostradas em vermelho. As células CD4+ estão esparsamente distribuídas e apresentam associação limitada com a região que expressa dβh. Clique aqui para baixar este arquivo.
Vídeo Suplementar 4. Z-stack confocal representativo de um peixe-zebra expressando MYCN em 14 dias após a fertilização. Imagem confocal tridimensional de um peixe-zebra Tg(dβh:MYCN;dβh:EGFP;Cd4-1:mCherry) em 14 dias após a fertilização (dpf). As células pré-malignas de neuroblastoma expressando MYCN positivas para EGFP são mostradas em verde, e as células CD4+ são mostradas em vermelho. Observa-se um acúmulo e infiltração aumentados de células CD4+ em associação com a região tumoral ampliada em comparação com peixes controle de idade correspondente, o que está de acordo com a quantificação mostrada na Figura 2B. Clique aqui para baixar este arquivo.
Discussão
O protocolo descrito aqui utiliza o peixe-zebra como modelo in vivo para visualizar e quantificar células imunes dentro do MEI. Vários fatores são fundamentais para a implementação bem-sucedida desta abordagem. Primeiro, a seleção e validação adequadas de linhagens de peixe-zebra transgênicas compostas são essenciais. As larvas devem ser triadas quanto aos padrões esperados de expressão fluorescente e, se necessário, confirmadas por genotipagem. A expressão do repórter imune e do oncogene deve ser verificada antes do experimento para garantir a atribuição correta dos grupos experimentais e controle. Segundo, a identificação precisa da região de interesse é fundamental durante a imagem confocal. A imagem em campo claro pode ser utilizada para identificar marcos anatômicos e facilitar a localização do tecido-alvo. Por exemplo, ao imagiar tumores na região anterior do corpo, o olho pode ser usado como marco para auxiliar na localização. Terceiro, o posicionamento adequado do peixe é essencial para garantir uma exposição suficiente da região de imagem. Um alinhamento inadequado pode reduzir a qualidade da imagem ou obscurecer o tecido de interesse. Por fim, o posicionamento e imobilização apropriados são necessários para minimizar artefatos de movimento durante a imagem em tempo real. A concentração de tricaina e a duração da imagem devem ser otimizadas para manter a viabilidade larval enquanto preserva a qualidade da imagem.
A fototoxicidade pode ser minimizada reduzindo a intensidade do laser e o tempo de exposição durante a imagem em tempo real. Para amostras adultas, os tecidos devem ser mantidos sobre gelo durante o manuseio e o preparo para imagem, pois descongelações repetidas podem alterar a integridade do tecido. O manuseio cuidadoso das amostras é particularmente importante após a criosseção e a remoção do bloco de OCT.
A interpretação dos resultados de imagem exige considerar a especificidade do marcador. Várias linhagens de marcadores imunes rotulam múltiplas populações de células imunes. Por exemplo, a expressão de CD4 foi relatada em populações celulares além dos linfócitos T convencionais, incluindo macrófagos28. Além disso, além dos macrófagos, a expressão de mpeg também é detectada em células B29. Lysc pode rotular tanto neutrófilos quanto macrófagos30. Consequentemente, a expressão de um marcador fluorescente isoladamente pode não ser suficiente para atribuir definitivamente a identidade celular. Abordagens adicionais de validação, como RNAscope, citometria de fluxo, reação em cadeia da polimerase com transcrição reversa quantitativa ou sequenciamento de RNA de célula única, podem complementar as observações baseadas em imagem e fornecer caracterização molecular adicional das populações celulares marcadas.
Este método apresenta várias limitações. A abordagem baseia-se na expressão de repórteres fluorescentes e, portanto, não pode confirmar independentemente a identidade ou o estado funcional das células imunes. Além disso, a análise de imagens no fluxo de trabalho atual para peixes adultos baseia-se em conjuntos de dados confocais projetados com camadas limitadas e pode não capturar completamente as complexas relações celulares tridimensionais dentro do microambiente tumoral (TME). Por fim, o método também exige a geração e manutenção de linhagens transgênicas compostas de peixe-zebra, o que pode limitar o acesso para alguns laboratórios.
Apesar dessas limitações, o protocolo fornece uma abordagem prática para visualizar células imunes associadas a lesões de neuroblastoma em peixe-zebra. Em comparação com a histologia convencional de ponto final, o método preserva a arquitetura tecidual e permite a obtenção de imagens de células marcadas com fluorescência em tecidos intactos20,21. O fluxo de trabalho pode ser aplicado em múltiplos estágios de desenvolvimento e pode ser adaptado a outras linhagens de repórteres fluorescentes. Além do neuroblastoma, diversos estudos têm realizado imagens do microambiente tumoral (TME) para analisar a interação entre melanoma e células imunes, incluindo células CD4+, macrófagos e células CD8+15,21,31,32. Em conjunto, essas características tornam o protocolo uma plataforma útil para o estudo da localização de células imunes dentro do TME de peixe-zebra.
Divulgações
Os autores declaram não haver interesses conflitantes.
Agradecimentos
Agradecemos o apoio dos National Institutes of Health (NIH; 1UL1TR001430, CA215059 e NS140967), da American Cancer Society (RSG-17-204-01-TBG), da National Science Foundation (1911253) e da Alex’s Lemonade Stand Foundation para H.F.; e de uma bolsa Warren Alpert Distinguished Scholars para X.Q. Y.W. recebeu apoio do Programa de Oportunidades de Pesquisa para Graduandos da Universidade de Boston (UROP) e do Programa de Bolsas de Verão St. Baldrick’s. M.V. foi apoiado pelo Programa de Bolsas de Verão St. Baldrick’s. O conteúdo deste artigo é de exclusiva responsabilidade dos autores e não representa necessariamente as opiniões oficiais do NIH.
Materiais
| Nome | Empresa | Número de catálogo | Comentários |
|---|---|---|---|
| 200 µL Gel Loading Tip | MilliporeSigma | 1022-0600 | Utilizado para manipulação de larvas |
| Plantas Artificiais | The Hidden Reef | 62874200000000000 | Enriquecimento opcional para reprodução |
| Água Sanitária | Fisher Scientific | 50371500 | Utilizada para descontaminação de embriões |
| Plugin Cell Counter | National Institutes of Health (NIH) | N/A | Plugin do Fiji utilizado para quantificação celular |
| Computador e Monitor | HP | 2TB68A8#ABA | Utilizado para aquisição e análise de imagens |
| Microscópio Confocal | Zeiss | LSM 710 | Utilizado para imagens de larvas e adultos |
| Molde Criogênico, Plástico | Epredia | 22-050-160 | Utilizado para inclusão em OCT |
| Criostato | Thermo Fisher Scientific | 95-664-0EC70 | Utilizado para crio-seccionamento |
| Gelo Seco | Fisher Scientific | N/A | Utilizado para transporte de amostras |
| Software Fiji | National Institutes of Health (NIH) | Version 1.54p | Software para análise de imagens |
| Rede de Malha Fina | Carolina Biological | 651345 | Utilizada para coleta de embriões |
| Incubadora para Peixes | VWR | 35960-056 | Mantida a 28,5°C |
| Pinça | Fisher Scientific | 10-316B | Utilizada para manipulação de amostras |
| Placa de Fundo de Vidro | IBIDI | 81218-200 | Utilizada para imagens |
| Agarose de Baixo Ponto de Fusão | Prolab Supply | 9012-36-6 | Utilizada para montagem de larvas e adultos |
| Tanque de Acasalamento (tanque principal, divisória, seção gradeada) | Carolina Biological | 161937 | Utilizado para reprodução de peixe-zebra |
| Rocker Agitador com Movimento Oscilante | Midsci | R2D-30 | Utilizado para fixação durante incubação noturna |
| Composto OCT | Tissue-Tek | 4583 | Meio de inclusão para crio-seccionamento |
| Paraformaldeído (PFA) | Sigma Aldrich | 158127-500G | Fixador |
| Placa de Petri, Plástica | MilliporeSigma | BR452000 | Utilizada para manipulação de embriões e larvas |
| Solução Salina Tamponada com Fosfato (PBS) | Gibco | 14080-055 | Utilizada para lavagem e procedimentos de fixação |
| Pipeta de Transferência Plástica | Fisher Scientific | 50-998-100 | Utilizada para transferência de embriões e larvas |
| Lâmina de Barbear | Fisher Scientific | 12-640 | Utilizada durante o preparo da amostra |
| Medidor de Condutividade | YSI | EC300ACC-04 | Utilizado para verificar a salinidade da água de rotíferos |
| Rotíferos | The Hidden Reef | 116151603 | Utilizados para criação de larvas |
| Tiossulfato de Sódio | Thermo Fisher Scientific | AAA1762936 | Utilizado para neutralização da água sanitária |
| Sacarose | Fisher Scientific | S25590A | Reagente de crioproteção |
| Mesilato de Tricaina | Western Chemical | NC0872873 | Anestésico; vendido pela Fisher Scientific |
| Pinça de Ponta Fina | Fisher Scientific | 12-000-122 | Utilizada para manipulação de amostras |
| Microscópio de Fluorescência Upright | Leica | M165 | Utilizado para triagem de fluorescência |
Referências
- Anderson NM, Simon MC. The tumor microenvironment. Curr Biol. 2020;30(16):R921-R925.
- Kumagai S, Momoi Y, Nishikawa H. Immunogenomic cancer evolution: A framework to understand cancer immunosuppression. Sci Immunol. 2025;10(105):eabo5570.
- Keren L, et al. A structured tumor-immune microenvironment in triple negative breast cancer revealed by multiplexed ion beam imaging. Cell. 2018;174(6):1373-1387.e19.
- Gerner MY, et al. Histo-cytometry: A method for highly multiplex quantitative tissue imaging analysis applied to dendritic cell subset microanatomy in lymph nodes. Immunity. 2012;37(2):364-376.
- Pittet MJ, Weissleder R. Intravital imaging. Cell. 2011;147(5):983-991.
- Wienke J, et al. The immune landscape of neuroblastoma: Challenges and opportunities for novel therapeutic strategies in pediatric oncology. Eur J Cancer. 2021;144:123-150.
- Spitzer MH, Nolan GP. Mass cytometry: Single cells, many features. Cell. 2016;165(4):780-791.
- Roy D, et al. Zebrafish—A suitable model for rapid translation of effective therapies for pediatric cancers. Cancers (Basel). 2024;16(7):1361.
- White RM, et al. Transparent adult zebrafish as a tool for in vivo transplantation analysis. Cell Stem Cell. 2008;2(2):183-189.
- MacRae CA, Peterson RT. Zebrafish as tools for drug discovery. Nat Rev Drug Discov. 2015;14(10):721-731.
- Miao KZ, et al. Tipping the scales with zebrafish to understand adaptive tumor immunity. Front Cell Dev Biol. 2021;9:660969.
- Povoa V, et al. Innate immune evasion revealed in a colorectal zebrafish xenograft model. Nat Commun. 2021;12(1):1156.
- Wang J, et al. Novel mechanism of macrophage-mediated metastasis revealed in a zebrafish model of tumor development. Cancer Res. 2015;75(2):306-315.
- Loveless R, Shay C, Teng Y. Unveiling tumor microenvironment interactions using zebrafish models. Front Mol Biosci. 2020;7:611847.
- Dee CT, et al. CD4-transgenic zebrafish reveal tissue-resident Th2- and regulatory T cell-like populations and diverse mononuclear phagocytes. J Immunol. 2016;197(9):3520-3530.
- Murali Shankar N, et al. Preclinical assessment of CAR-NK cell-mediated killing efficacy and pharmacokinetics in a rapid zebrafish xenograft model of metastatic breast cancer. Front Immunol. 2023;14:1254821.
- Tan KE, et al. LMO1 expression in neuroblastoma cells reprograms tumor-associated macrophages to promote metastasis. iScience. 2026;29(3):115144.
- Fior R, et al. Single-cell functional and chemosensitive profiling of combinatorial colorectal therapy in zebrafish xenografts. Proc Natl Acad Sci U S A. 2017;114(39):E8234-E8243.
- Fazio M, et al. Zebrafish patient avatars in cancer biology and precision cancer therapy. Nat Rev Cancer. 2020;20(5):263-273.
- Qin X, et al. CKLF instigates a “cold” microenvironment to promote MYCN-mediated tumor aggressiveness. Sci Adv. 2024;10(11):eadh9547.
- Ludin A, et al. CRATER tumor niches facilitate CD8+ T cell engagement and correspond with immunotherapy success. Cell. 2025;188(24):6720-6736.e26.
- Zhu S, et al. LMO1 synergizes with MYCN to promote neuroblastoma initiation and metastasis. Cancer Cell. 2017;32(3):310-323.e5.
- Tao T, et al. The pre-rRNA processing factor DEF is rate limiting for the pathogenesis of MYCN-driven neuroblastoma. Oncogene. 2017;36(27):3852-3867.
- Zimmerman MW, et al. MYC drives a subset of high-risk pediatric neuroblastomas and is activated through mechanisms including enhancer hijacking and focal enhancer amplification. Cancer Discov. 2018;8(3):320-335.
- Dankert EN, Look AT, Zhu S. Unraveling neuroblastoma pathogenesis with the zebrafish. Cell Cycle. 2018;17(4):395-396.
- Langenau DM, et al. In vivo tracking of T cell development, ablation, and engraftment in transgenic zebrafish. Proc Natl Acad Sci U S A. 2004;101(19):7369-7374.
- Lam SH, et al. Development and maturation of the immune system in zebrafish, Danio rerio: A gene expression profiling, in situ hybridization and immunological study. Dev Comp Immunol. 2004;28(1):9-28.
- Zhen A, et al. CD4 ligation on human blood monocytes triggers macrophage differentiation and enhances HIV infection. J Virol. 2014;88(17):9934-9946.
- Ferrero G, et al. The macrophage-expressed gene (mpeg)1 identifies a subpopulation of B cells in the adult zebrafish. J Leukoc Biol. 2020;107(3):431-443.
- Hall C, et al. The zebrafish lysozyme C promoter drives myeloid-specific expression in transgenic fish. BMC Dev Biol. 2007;7:42.
- Lorenzini F, et al. Melanoma innervation, noradrenaline and cancer progression in zebrafish xenograft model. Cell Death Discov. 2025;11(1):260.
- Ramakrishnan G, et al. Real-time imaging reveals a role for macrophage protrusive motility in melanoma invasion. J Cell Biol. 2025;224(2):e202403096.
Reimpressões e permissões
Este artigo foi publicado
Vídeo em breve