We introduce an immunophenotyping strategy, using full-spectrum flow cytometry to characterize immune cell lineages in one tube, including T cell subsets, B cell subsets, natural killer (NK) cell subsets, monocytes, and granulocyte populations in human peripheral blood and tumor tissues.
Artigo de investigação
A Flow Cytometry-Based Method for Profiling Immune Cells in Human Blood and Tumors
Neste artigo
Resumo
Resumo
Flow cytometry enables the simultaneous characterization of multiple immune-cell populations and their phenotypic subsets in clinical specimens. However, comprehensive immunophenotyping of limited blood and tumor samples can be challenging because of limited cell availability, sample-processing requirements, and the need for standardized staining and gating procedures. Here, we describe a 12-color full-spectrum flow cytometry method for profiling major immune-cell populations in human peripheral blood and tumor tissue. The panel comprises 11 antibody markers and DAPI and is designed to identify major lymphoid and myeloid populations, including T cells, B cells, NK cells, monocytes, and granulocyte populations, with further characterization of selected cell populations based on marker expression. The workflow includes sample preparation, antibody titration, multicolor staining, viability assessment, spectral reference controls, spectral unmixing, and hierarchical gating. The protocol was optimized for relatively small clinical specimens and can be applied to both whole blood and enzymatically dissociated tumor tissue. Representative data demonstrate the ability of the panel to resolve distinct immune-cell subset distributions in individual blood and paired tumor/peri-tumor specimens. This workflow provides a practical approach for multiparameter immune profiling of limited human blood and tumor specimens and can serve as a basis for subsequent studies requiring more extensive cohort-level validation.
Introdução
The immune system plays a complex and context-dependent role in tissue homeostasis and tumorigenesis, with immune responses capable of both restricting tumor development through immune surveillance and promoting tumor progression under certain pathological conditions1,2,3. Characterization of immune-cell composition is therefore essential for understanding immune composition and phenotype in both physiological and pathological conditions. In clinical practice, complete blood count (CBC) analysis is routinely used to assess circulating leukocyte levels and the proportions of major leukocyte populations. However, CBC does not provide detailed information on the phenotype or composition of immune-cell subsets and does not characterize immune-cell populations within tissues. In contrast, flow cytometry enables simultaneous single-cell analysis of multiple immune cell populations and has become a widely used technology for immune profiling in both clinical and translational research4,5,6,7. Recent advances in multicolor flow cytometry have enabled the simultaneous detection of more than 10 markers within a single tube, significantly improving the information output efficiency of limited clinical samples, such as biopsy tissues. Full-spectrum flow cytometry panels containing 28 and 40 colors have further improved the resolution and depth of immune phenotyping in peripheral blood samples8,9. However, highly multiplexed panels can involve complex staining and data analysis workflows, which may complicate assay optimization and reproducibility, particularly when working with limited clinical specimens.
Here, we developed a practical full-spectrum flow cytometry panel consisting of 11 antibody-conjugated markers and one viability dye for comprehensive leukocyte profiling in a single tube. This panel enables simultaneous identification of major lymphoid and myeloid populations, including T cells, B cells, NKT-like T cells, NK cells, classical, intermediate, and non-classical monocytes, and CD66b⁺ granulocyte populations, with further delineation of selected phenotypic subsets based on marker expression in fresh human peripheral blood and freshly collected tumor tissue samples. Compared with highly multiplexed approaches8,9, this method provides a strategy for rapid immune profiling, particularly in settings with limited sample volume or the need for streamlined immune lineage assessments.
Protocolo
This study was conducted in accordance with the principles of the Declaration of Helsinki. All protocols involving human participants, including the collection of peripheral blood and tissue samples, were reviewed and approved by the Ethics Committee of Luoyang Central Hospital Affiliated to Zhengzhou University (approval No. LWLL-2026-08-20-01). Informed consent was obtained from all individual participants included in the study.
1. Human subjects and clinical specimens
- Obtain peripheral blood specimens and tumor and peri-tumor tissue specimens for flow cytometric analysis. Collect colon tissue specimens from patients with colon cancer undergoing surgical resection.
- Collect tumor tissue from the tumor mass and peri-tumor tissue from macroscopically non-tumorous tissue adjacent to the tumor.
NOTE: Fluorophore selection was performed using the Cytek Full Spectrum Viewer to minimize spectral overlap and optimize detection of target cell populations (https://cloud.cytekbio.com/spectrum/cloudspectrumviewer). Antibody titration was performed using human blood samples at four dilution levels to determine the optimal antibody concentrations.
CAUTION: Due to the potential infectious nature of human specimens, all procedures involving human samples were performed in a certified Class II biological safety cabinet in accordance with institutional biosafety guidelines. The human specimen waste and contaminated materials should be disposed of/decontaminated according to institutional biosafety procedures.
NOTE: For peripheral blood samples, 200 µL of whole blood was used for each staining reaction. For tumor tissue samples, approximately 0.5 cm × 0.5 cm of tissue was collected and subjected to the described tissue dissociation procedure before staining. The same antibody cocktail and staining conditions were used for each sample.
2. Sample preparation
- Blood sample processing
- Collect peripheral blood from participants into EDTA-coated tubes, and aliquot 200 µL fresh whole blood into flow cytometry tubes.
- Perform red blood cell (RBC) lysis using a two-step RBC lysis procedure according to the manufacturer's instructions (Solarbio). Add 600 µL red blood cell lysis buffer at a 1:3 blood-to-lysis buffer ratio and mix gently.
- Incubate the samples on ice for 15 min. Gently vortex the tubes twice during the incubation period to facilitate erythrocyte lysis.
- Centrifuge the samples at 400 × g for 5 min at 4 °C. Carefully aspirate and discard supernatant.
- Resuspend the cell pellet in 400 µL of RBC lysis buffer, corresponding to a 1:2 ratio of the initial blood volume to lysis buffer volume, according to the manufacturer's instructions.
- Centrifuge the samples at 400 × g for 5 min at 4 °C. Carefully aspirate and discard supernatant. Use the cell pellet for subsequent flow cytometric staining.
- Tissue sample processing
- Collect fresh colon tumor and peri-tumor tissues during surgery. For the two subsequently processed paired tumor/peri-tumor specimens, tissue input was approximately 0.5-0.9 g based on recorded wet-weight measurements. Place tissue specimens (approximately 0.5 cm × 0.5 cm) into 15 mL centrifuge tubes containing DMEM complete medium. Keep the samples on ice and process them within 1 h of collection.
- In a certified biological safety cabinet, transfer the tissue specimens to a 6 cm culture dish and wash twice with 4 mL pre-cooled PBS.
- Using ophthalmic scissors, mince the tissues thoroughly into fragments of approximately 1–2 mm3 in a small amount of PBS. Keep the tissue fragments submerged in PBS throughout the procedure to prevent drying.
- Transfer the tissue suspension to a 15 mL centrifuge tube and centrifuge at 150 × g for 5 min. Carefully aspirate and discard the supernatant.
- Add 5 mL of digestion solution containing 1 mg/mL collagenase IV and 0.0125 mg/mL DNase I. Incubate the samples in a 37 °C water bath for 30 min, gently mixing the suspension every 10 min during digestion.
- Terminate enzymatic digestion by adding three volumes of DMEM complete medium relative to the volume of the digestion suspension. Filter the resulting cell suspension through a 70 µm cell strainer into a new 15 mL centrifuge tube.
- Centrifuge the samples at 400 × g for 5 min at 4 °C. Carefully aspirate and discard the supernatant. Resuspend the cell pellet in 4 mL PBS and transfer 1 mL of the suspension to flow cytometry tubes.
- Centrifuge the samples at 400 × g for 5 min at 4 °C. Carefully aspirate and discard the supernatant. Use the cell pellet for subsequent flow cytometric staining.
NOTE: Antibody concentrations were optimized by testing four working dilutions of each antibody. The four working dilutions were 1:20, 1:40, 1:80, and 1:160.
3. Antibody Titration
- Determine cell concentration and viability using an automated cell counter. Adjust the cell suspension to 1 × 10⁷ cells/mL and aliquot 100 µL of the cell suspension into each flow cytometry tube.
- Centrifuge the samples at 400 × g for 5 min at 4 °C. Carefully aspirate and discard the supernatant. Resuspend the cells in 100 µL of blocking solution and incubate at room temperature for 10 min.
- Gently vortex each sample for a few seconds. Add FACS buffer to a final volume of 4 mL, centrifuge at 400 × g for 5 min at 4 °C, and carefully aspirate and discard the supernatant.
- Add 50 µL of the corresponding antibody dilution to each sample and incubate at 4 °C for 30 min in the dark.
- Gently vortex each sample for a few seconds. Add PBS to a final volume of 4 mL, centrifuge at 400 × g for 5 min at 4 °C, and carefully aspirate and discard the supernatant.
- Resuspend the cells in 200 µL of FACS buffer and analyze the samples by flow cytometry.
4. Staining
- Resuspend each sample in 100 µL of blocking buffer and incubate at room temperature for 10 min.
- Add 4 mL FACS buffer to each tube. Centrifuge the samples at 400 × g for 5 min at 4 °C. Carefully aspirate and discard the supernatant.
- Resuspend each sample in 50 µL of antibody cocktail (Table 1) and incubate on ice for 30 min in the dark.
- Add 4 mL of FACS buffer to each tube. Centrifuge the samples at 400 × g for 5 min at 4 °C. Carefully aspirate and discard the supernatant.
- Immediately before flow cytometric acquisition, add 200 µL of 4′,6-diamidino-2-phenylindole (DAPI) working solution to each sample.
5. Flow cytometry
- Flow cytometry instrumentation and data acquisition
- Prepare the calibration beads by adding one drop of beads to 300 µL of sheath fluid.
- After instrument startup, run the calibration beads to automatically update the instrument gain parameters and monitor instrument performance. Perform daily instrument quality control according to the manufacturer's recommended procedure before sample acquisition.
- Acquire flow cytometry data using a flow cytometer equipped with three excitation lasers (405, 488, and 640 nm) and a CWDM full-spectrum detection system capable of collecting fluorescence signals over the 420–829 nm wavelength range.
- Set the acquisition threshold to 300,000 on the FCS channel. Set the sample flow rate to approximately 5,000 events/s, and stop data acquisition after a collection volume of 200 µL.
- Set the FSC area scaling factor to 1.31. Perform data acquisition and spectral analysis using SpectroFlo CLC software.
- Display FSC and SSC parameters using a linear scale and fluorescence parameters using logarithmic or biexponential scaling, as appropriate.
- Antibody titration and selection of working concentrations
- Titrate each antibody at four dilutions using a representative peripheral blood sample collected during a routine health examination. Evaluate antibody concentrations based on the observed separation between positive and negative populations, signal intensity, and background staining.
- NOTE: Determining the optimal antibody dilution is critical for achieving adequate staining quality and minimizing background fluorescence. No quantitative stain index, separation index, or signal-to-background ratio was calculated for antibody titration.
- Select the final working dilution based on these criteria. Use CD66b, CD14, CD11b, and CD4 antibodies at a dilution of 1:80, and use CD56, CD3, CD45, CD8, CD16, CD19, and HLA-DR antibodies at a dilution of 1:160. Representative titration results are shown in Figure 1.
- Use unstained and fluorescence-minus-one (FMO) controls to assess background fluorescence and guide fluorescence gate placement (Figure 2). Prepare FMO controls by staining cells at the final selected antibody concentrations with the complete antibody panel except for the marker being evaluated.
- Process and acquire the FMO controls under the same conditions as the fully stained samples. Establish gates based on the fluorescence distributions observed in the corresponding controls and subsequently apply the gates consistently to the experimental samples.
- Apply the gating strategy sequentially to identify viable singlets and the major lymphoid and myeloid cell populations.
- Spectral reference controls and unmixing
- Use unstained and single-stained cells to generate the reference spectra for individual fluorophores. Prepare single-stained reference controls for each fluorochrome included in the antibody panel and acquire them using the same instrument configuration as the experimental samples.
- Use the reference controls to generate the corresponding reference spectra in SpectroFlo. Include a reference control for DAPI for spectral unmixing.
- Perform spectral unmixing using the built-in Unmix function in SpectroFlo. Use the resulting unmixed fluorescence parameters for subsequent flow cytometric analysis and population gating.
6. Gating strategy
- Identify the major leukocyte-containing populations, including lymphocytes, monocytes, and granulocytes, based on forward scatter area (FSC-A) and side scatter area (SSC-A) characteristics. Exclude dead cells, debris, and cell aggregates prior to further analysis.
- Use CD45 staining to identify and gate leukocytes, thereby excluding residual non-leukocyte events, including erythrocytes.
NOTE: The panel was evaluated using peripheral blood samples from 19 donors recruited during routine health examinations with no documented underlying disease at the time of sample collection. Donor age, sex, and the percentages of the identified cell populations are presented in Supplementary Table 1. A representative gating strategy using a peripheral blood sample from Donor 10 is shown in Figure 3. - Apply the same overall gating workflow to both peripheral blood and tissue samples. Adjust specific population definitions and nomenclature according to the sample type, as described in the corresponding sections.
- Lymphocytes
- After gating on the CD45⁺ leukocyte population, identify T cells as CD3⁺ cells and further gate them based on SSC characteristics.
- Classify T cells according to CD4 and CD8 expression into helper T cells (Th, CD4⁺CD8⁻), cytotoxic T cells (Tc, CD4⁻CD8⁺), double-positive T cells (DPT, CD4⁺CD8⁺), and double-negative T cells (DNT, CD4⁻CD8⁻), consistent with commonly used immunophenotypic definitions of T-cell subsets10.
- Further characterize the Th and Tc populations according to HLA-DR expression to assess their activation status11,12,13,14. Define B cells as CD19⁺ cells15.
- Identify natural killer T (NKT)-like T cells (CD3⁺CD56⁺) and natural killer (NK) cells (CD3⁻CD56⁺) based on CD3 and CD56 expression. Further subdivide NK cells into CD16highCD56low NK cells and CD16⁻CD56high NK cells according to CD16 and CD56 expression16.
- Myeloid cells
- Monocytes
- Gate CD45⁺ leukocytes based on CD45 expression. Subsequently, identify lineage-negative cells by excluding CD3⁺ T cells, CD19⁺ B cells, CD56⁺ NK/NKT-like T cells, and CD66b⁺ granulocytes (CD3⁻CD19⁻CD56⁻CD66b⁻).
- In peripheral blood, define monocyte subsets within the lineage-negative population based on CD14 and CD16 expression, including classical monocytes (CD14⁺CD16⁻), intermediate monocytes (CD14⁺CD16⁺), and non-classical monocytes (CD14^low^CD16⁺)16.
- In dissociated tumor tissue, use CD14 and CD16 expression only to describe phenotypically defined myeloid populations, without assigning conventional blood monocyte subset identities17,18.
- Granulocytes
- In peripheral blood, characterize the CD45⁺ leukocyte population according to CD66b/CD16 expression. Classify CD66b⁺CD16⁺ cells as neutrophils and describe CD66b⁺CD16⁻ cells as a CD66b⁺CD16⁻ granulocyte population16,17.
- In dissociated tumor and peri-tumor tissues, similarly characterize CD45⁺ cells according to CD66b/CD16 expression as CD66b⁺CD16⁺ and CD66b⁺CD16⁻ granulocyte populations.
- Identify CD66b⁺CD14⁻ cells as the CD66b⁺ granulocyte population and further assess them based on the expression levels of CD11b and CD16. According to the relative expression of these two markers, identify four populations: CD11blowCD16low (subset 1), CD11bhighCD16low (subset 2), CD11blowCD16high (subset 3), and CD11bhighCD16high (subset 4).
NOTE: These subsets represent distinct CD11b/CD16 expression profiles within the CD66b⁺ granulocyte population that may reflect differences in granulocyte maturation and activation states18. Because CD11b and CD16 expression can be influenced by cellular state and sample processing, these populations were not interpreted as distinct functional or maturation states19,20,21.
- Monocytes
Resultados
The technical performance of the flow cytometry panel was evaluated by antibody titration, FMO controls, and sequential gating of viable single cells. As shown in Figure 1, each antibody was evaluated at four working dilutions (1:20, 1:40, 1:80, and 1:160), and the final concentrations were selected based on the separation between positive and negative populations, signal intensity, and background fluorescence. The selected antibody dilutions provided distinguishable positive and negative populations with acceptable background fluorescence. Poor separation between positive and negative populations, weak fluorescence intensity, or excessive background may indicate an inappropriate antibody concentration or suboptimal staining conditions and should prompt further optimization.
FMO controls were used for selected markers to assist with gate placement (Figure 2). The FMO samples provided a reference for the fluorescence distribution in the absence of the corresponding marker-specific antibody and supported the identification of positive and negative populations. Clear fluorescence distributions and well-defined boundaries facilitate reproducible gate placement, whereas broad or poorly defined fluorescence distributions and excessive background may make gate placement ambiguous and should prompt review of the staining and data-processing conditions.
Figure 3 illustrates the sequential gating strategy used for downstream immune-cell analysis. Cells were first selected based on FSC-A/SSC-A characteristics, followed by exclusion of DAPI-positive non-viable cells and singlet discrimination. CD45⁺ leukocytes were subsequently identified, followed by the characterization of lymphoid and myeloid populations using the marker combinations described in the protocol. The sequential gating strategy allowed the major immune-cell populations and their phenotypic subsets to be resolved. A high proportion of DAPI-positive events, excessive debris, poorly resolved singlet populations, or poorly separated target populations may indicate suboptimal sample preparation, staining, or acquisition and should be evaluated before downstream analysis.
Clear separation of relevant populations, low nonspecific background, high cell viability, and well-resolved singlet and target-cell populations are important indicators of acceptable sample and staining quality. These technical assessments provide practical criteria for evaluating whether the flow cytometry protocol has been successfully implemented before interpretation of immune-cell population frequencies.
To assess the effect of cell input on population frequencies, a single peripheral blood specimen was evaluated using cell inputs ranging from 5 × 10⁴ to 5 × 10⁶ cells per staining reaction. Under the acquisition conditions used, approximately 20% of the initial cell input was acquired as events. The proportions of the evaluated immune-cell populations are summarized in Supplementary Table 2 and do not show an apparent trend associated with the number of cells used for staining. These results indicate that, within the tested range, the evaluated population frequencies were generally comparable across different cell inputs. However, the reliability of population estimates depends on the number of acquired events, particularly for relatively low-frequency populations such as classical, intermediate, and non-classical monocytes. Therefore, sufficient numbers of acquired events should be collected to obtain reliable estimates of low-frequency populations. A substantial decrease or unexpected variation in population frequencies as cell input increases may warrant evaluation of sample preparation, staining, acquisition, or gating conditions.
Individuals with different clinical backgrounds and variable CBC parameters were analyzed to demonstrate the applicability of the panel across heterogeneous blood samples. To determine whether similar lymphocyte proportions on routine CBC may correspond to differences in immune-cell composition, two patients with comparable peripheral blood lymphocyte proportions (Patient 1, 27.5%; Patient 2, 33.2%) were selected for detailed comparison of lymphocyte subsets. Patients’ characteristics are summarized in Table 2. These patients differed in age, sex, underlying disease, and clinical characteristics, including treatment history. Therefore, the observed differences in immune-cell subset composition cannot be attributed to disease status alone. These findings are presented as descriptive observations of inter-individual immune heterogeneity. Patients’ age, sex, and the percentages of the identified cell populations are presented in Supplementary Table 1. Despite similar overall lymphocyte proportions, flow cytometric immunophenotyping revealed distinct lymphocyte subset distributions between the two patients (Figure 4). Patient 1 exhibited a higher frequency of Th cells and a readily detectable CD19⁺ B-cell population, whereas Patient 2 showed a markedly expanded Tc cell and NK cell population with an almost complete absence of B cells. Differences were also observed in the relative distribution of T-cell subsets, while NKT-like T cells remained infrequent in both patients.
These findings suggest that flow cytometric immunophenotyping provides complementary information to routine CBC, revealing differences in immune-cell composition that may not be apparent from lymphocyte percentages alone. Thus, similar lymphocyte proportions on CBC may be associated with distinct underlying immune-cell profiles.
Flow cytometric immunophenotyping was performed to compare immune cell populations between paired colon peri-tumor and tumor tissues. Representative flow cytometric profiles of a paired tumor and peri-tumor specimen are shown in Figure 5. Representative tumor and paired peri-tumor specimens showed differences in the relative distributions of T-cell, B-cell, and CD66b⁺ granulocyte populations. In the tumor specimen, CD3⁺ T cells and CD66b⁺ granulocytes accounted for a higher relative proportion of the analyzed leukocyte population, with differences also observed in the distribution of CD4⁺ and CD8⁺ T-cell subsets. The percentages of the identified cell populations are presented in Supplementary Table 3. The relative distributions of immune-cell populations varied among the paired tumor and peri-tumor specimens, with differences observed between individual specimens. Given the limited number of specimens, these observations are presented descriptively to illustrate inter-individual variability rather than to establish consistent biological differences between tumor and peri-tumor tissues.
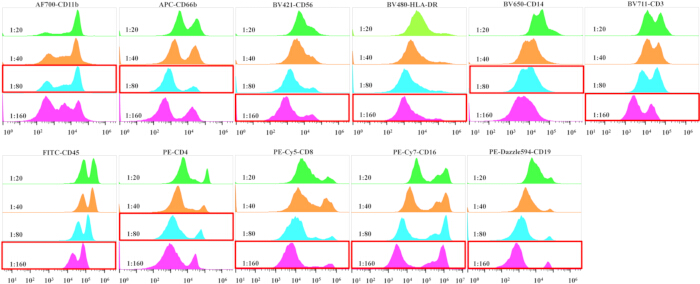
Figure 1: Representative antibody titration results and optimal working dilutions. The fluorescence marker corresponding to each antibody is indicated for each set of histograms. The four tested antibody dilutions (1:20, 1:40, 1:80, and 1:160) are indicated to the left on each histogram. Red outlines indicate the dilution selected as the optimal working dilution for the final panel. Antibody dilutions were evaluated using representative positive and/or negative cell populations, with selection based on fluorescence separation between positive and negative populations, signal intensity, and background staining. The same population-identification strategy was applied across all tested antibody dilutions to facilitate comparison. Please click here to view a larger version of this figure.
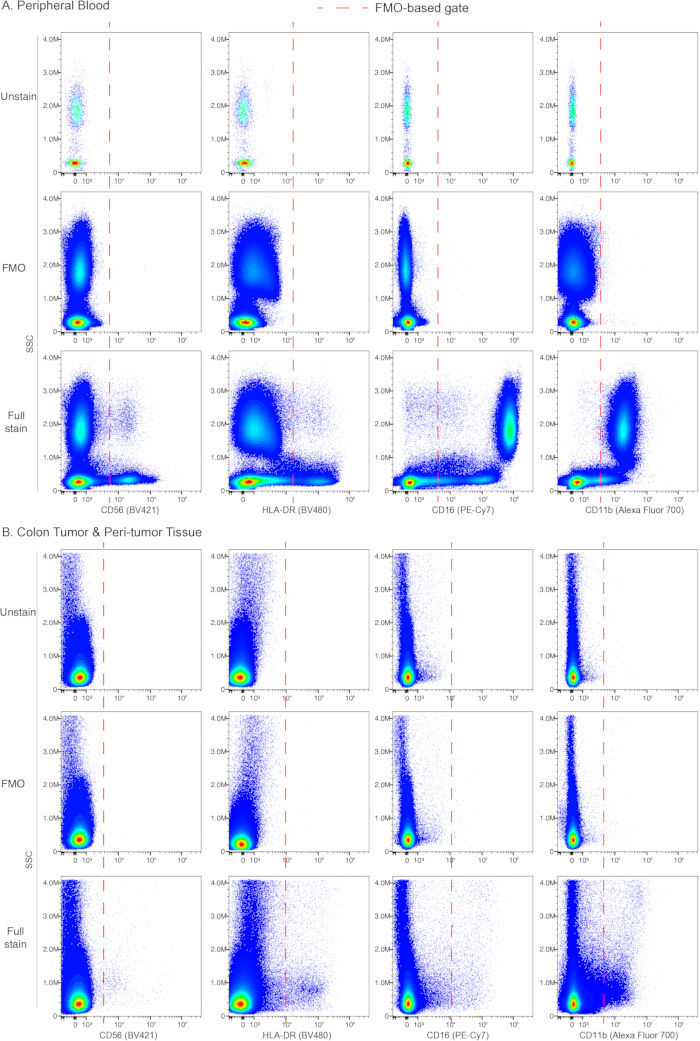
Figure 2: Fluorescence-minus-one (FMO) controls for selected markers. (A) Representative fluorescence-minus-one (FMO) plots for HLA-DR, CD16, CD11b, and CD56 in peripheral blood samples. (B) Representative FMO plots for HLA-DR, CD16, CD11b, and CD56 in colon tumor/peri-tumor tissue samples. FMO controls were used to assess fluorescence spread and to establish and validate gating boundaries for markers with continuous or poorly separated fluorescence distributions. Red dashed lines indicate the gating boundaries established based on the corresponding FMO controls. Please click here to view a larger version of this figure.
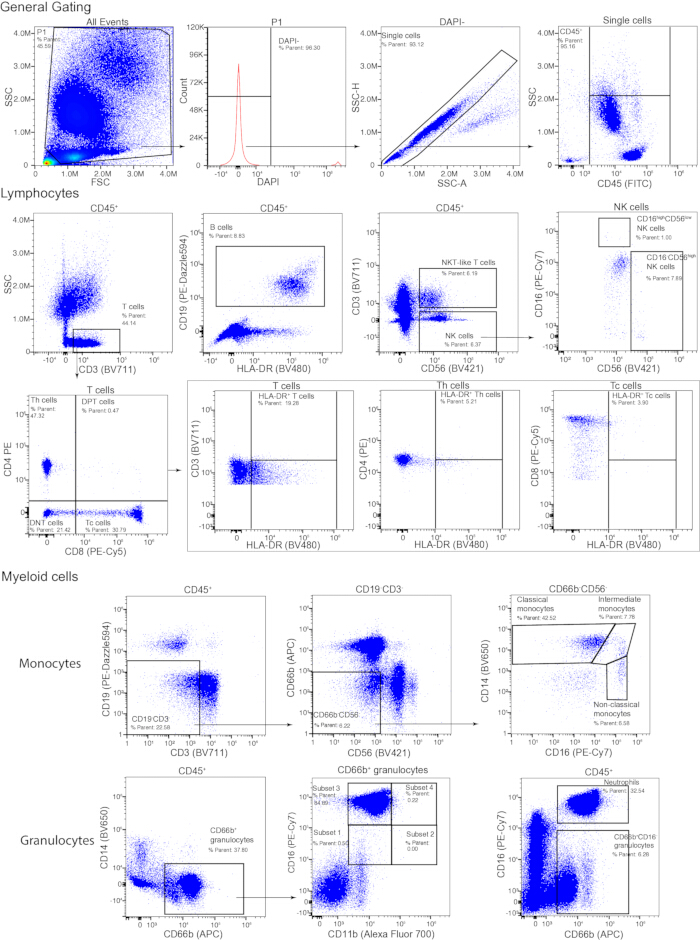
Figure 3: Representative flow cytometry gating strategy for identification of immune cell populations in peripheral blood. Representative peripheral blood plots illustrate the sequential gating strategy used to identify viable CD45⁺ leukocytes and major lymphoid and myeloid populations. Cells were first gated by forward Scatter (FSC)-A and side scatter (SSC)-A, followed by exclusion of dead cells using 4′,6-diamidino-2-phenylindole (DAPI) and singlet discrimination. CD45⁺ leukocytes were subsequently analyzed for lymphoid and myeloid populations according to the indicated marker expression. T cells were identified as CD3⁺ cells and further classified according to CD4 and CD8 expression into helper T cells (Th), cytotoxic T cells (Tc), double-positive T cells (DPT), and double-negative T cells (DNT). Th and Tc cell populations were further subdivided into HLA-DR⁺ and HLADR⁻ subsets to characterize their activation status. CD19⁺ B cells, CD3⁻CD56⁺ natural killer (NK) cells, and CD3⁺CD56⁺ NKT-like T cells were identified as indicated, with NK cells further characterized according to CD16 and CD56 expression. Within the myeloid compartment, lineage-negative cells (CD3⁻CD19⁻CD56⁻CD66b⁻) were used for identification of monocyte populations, which were further characterized by CD14 and CD16 expression. CD66b⁺CD14⁻ cells were identified as the CD66b⁺ granulocytes and further characterized according to CD11b/CD16 expression profiles. Four phenotypically defined CD11b/CD16 populations were identified within the CD66b⁺ granulocyte compartment: CD11blowCD16low (subset 1), CD11bhighCD16low (subset 2), CD11blowCD16high (subset 3), and CD11bhighCD16high (subset 4). CD45⁺ leukocyte population was characterized according to CD66b/CD16 expression, with CD66b⁺CD16⁺ cells classified as neutrophils, and CD66b⁺CD16⁻ cells described as a CD66b⁺CD16⁻ granulocyte population. A similar gating framework was applied to dissociated colon tumor and peri-tumor tissue samples, with population definitions and nomenclature adapted to the tissue context where appropriate. Please click here to view a larger version of this figure.
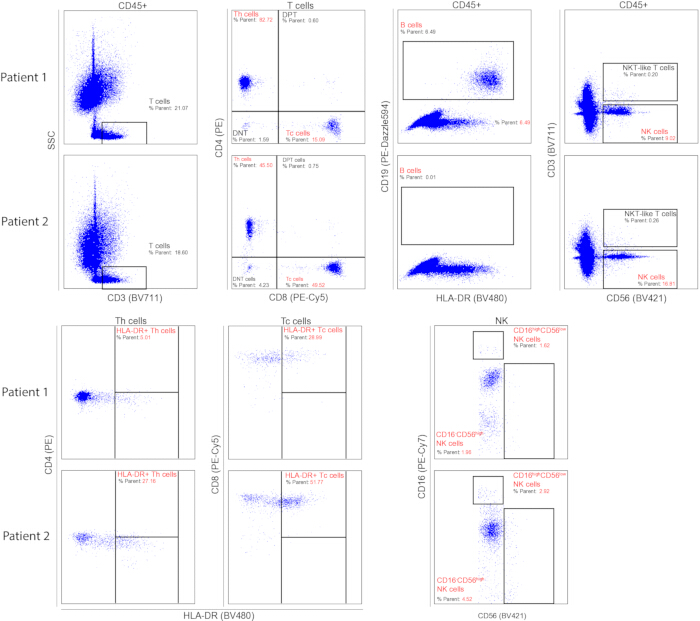
Figure 4: Representative flow cytometric analysis of lymphocyte subsets in two patients with comparable lymphocyte proportions on complete blood count. The relative distribution of lymphocyte subsets differed between the two patients. The parent population is indicated at the top of each plot and is used as the denominator for calculating the percentages shown in the plot. Patient 1 exhibited a higher relative proportion of helper T cells (Th) and CD19+ B cells, whereas Patient 2 showed a higher relative proportion of cytotoxic T cells (Tc) and NK cells, with a very low proportion of CD19⁺ B cells. Data are presented as percentages of the respective gated lymphocyte populations and are intended to illustrate the application of the flow cytometry panel rather than to support clinical or statistical comparisons. Please click here to view a larger version of this figure.
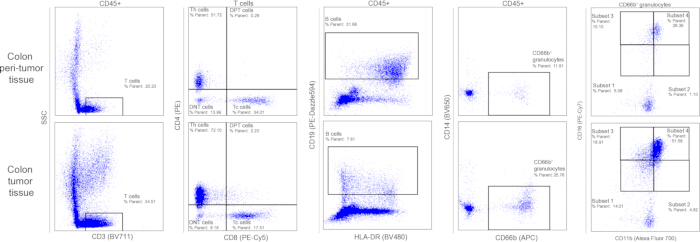
Figure 5. Representative flow cytometric immunophenotyping of paired peri-tumor and tumor tissues from a patient with colon cancer. The representative plots show the distribution of CD3⁺ T cells, CD4⁺ and CD8⁺ T-cell subsets, CD19⁺ B cells, and CD66b⁺ granulocytes in the paired tissue specimens. The parent population is indicated at the top of each plot and is used as the denominator for calculating the percentages shown in the plot. The data are presented to illustrate the application of the flow cytometry panel and gating strategy to tumor and peri-tumor tissues and are not intended to indicate generalizable biological differences between the tissue types. Please click here to view a larger version of this figure.
| Target | Fluorochrome | Dilution (v/v) | Volume (μL) |
| CD4 | PE | 1:80 | 0.625 |
| CD14 | BV650 | 1:80 | 0.625 |
| CD66b | APC | 1:80 | 0.625 |
| CD11b | AF700 | 1:80 | 0.625 |
| CD45 | FITC | 1:160 | 0.3125 |
| CD19 | PE/Dazzle 594 | 1:160 | 0.3125 |
| CD3 | BV 711 | 1:160 | 0.3125 |
| CD8a | PE/Cyanine5 | 1:160 | 0.3125 |
| CD56 | BV421 | 1:160 | 0.3125 |
| CD16 | PE/Cyanine7 | 1:160 | 0.3125 |
| HLA-DR | BV480 | 1:160 | 0.3125 |
| Brilliant Staining Buffer | - | to desired volume | 45.3125 |
Table 1: Antibody cocktail used for flow cytometry immunostaining. The table shows the target markers, corresponding fluorochromes, antibody dilutions, and volumes used in the staining cocktail.
| Characteristic | Patient 1 | Patient 2 |
| Age, years | 62 | 48 |
| Sex | Male | Female |
| Primary diagnosis | Malignant pulmonary neoplasm | Non-Hodgkin lymphoma (NHL) |
| Initial finding / presentation | Right upper lobe pulmonary mass | NHL diagnosed prior to study entry |
| Time since initial detection | 7 days | Not reported |
| Initial diagnosis | / | Waldenström macroglobulinemia (WM) |
| Subsequent diagnostic assessment | / | Small B-cell lymphoma; LPL/MZL considered; previous flow cytometry reported to support MZL |
| Clinical stage | cT4N3M0 (Stage III) | Not reported |
| Treatment before blood sampling | None | Three lines of prior therapy; disease progression after the first two lines; stable disease after bendamustine plus rituximab |
| Relevant comorbidities | Cerebral infarction, hypertension | None reported |
| Blood sampling | At initial evaluation | During routine follow-up after BR treatment |
| WBC, ×10⁹/L | 8.7 | 3.92 |
| Lymphocytes, % | 27.5 | 33.2 |
| Neutrophils, % | 55.8 | 55.3 |
Table 2: Demographic and clinical characteristics of the patients included in the comparative analysis. The table summarizes the available demographic, clinical, diagnostic, treatment, and hematological information for Patients 1 and 2, whose representative peripheral blood flow cytometry plots are shown in Figure 4.
Supplementary Table 1: Demographic characteristics and flow-cytometry-based immune-cell population proportions of peripheral blood donors and patients. The table summarizes the available demographic information and the relative proportions of viable and CD45⁺ immune-cell populations and their phenotypic subsets identified by flow cytometry in peripheral blood specimens from donors 1–19 and Patients 1 and 2. Percentages are reported relative to the indicated population (%P1). Please click here to download this file.
Supplementary Table 2: Immune-cell population frequencies at different cell input. Please click here to download this file.
Supplementary Table 3: Demographic characteristics and flow-cytometry-based immune-cell population proportions of colon tissues. The table summarizes the available demographic information and the relative proportions of viable and CD45⁺ immune-cell populations and their phenotypic subsets identified by flow cytometry in four paired colon tumor and peri-tumor tissue specimens. Percentages are reported relative to the indicated population (%P1). Please click here to download this file.
Discussão
The immune system plays an important role in host defense and disease development, and variation in immune-cell composition and function can influence disease susceptibility, progression, and responses to treatment22. Characterization of immune-cell composition may therefore provide useful information for disease investigation and immune monitoring. Flow cytometry enables multiparametric and highly sensitive characterization of immune-cell populations and is widely used in immunological studies. In the present study, we established a 12-color full-spectrum flow cytometry panel for the characterization of major immune-cell populations in human whole blood and tissue specimens using a single staining tube. The panel enables identification of major peripheral immune-cell populations, including T cells, B cells, NK cells, monocytes, and granulocytes, using a streamlined staining and data-acquisition workflow. In contrast to routine complete blood count measurements, which primarily provide total leukocyte and differential cell counts, flow cytometry allows further phenotypic characterization of specific immune-cell populations and their subsets. The representative blood specimens demonstrate that the panel can resolve major lymphoid and myeloid populations, while the tumor and paired peri-tumor specimens illustrate its applicability to dissociated solid-tissue samples. Thus, this workflow may be useful for immunological profiling when clinical specimens are limited, and multiple immune-cell populations need to be assessed simultaneously.
The representative datasets in this study were included primarily to demonstrate the application of the flow cytometry panel and gating strategy rather than to establish clinical or population-level biological conclusions. The representative blood specimens were obtained from different individuals, and the tumor and peri-tumor specimens were obtained from a limited number of samples. Therefore, differences observed in the relative distributions of immune-cell populations may reflect inter-individual variation, tissue-specific variation, or other sample-related factors. In particular, the tumor and peri-tumor data should not be interpreted as evidence of generalizable biological differences in the tumor immune microenvironment. Larger studies involving appropriately powered and clinically characterized cohorts will be required to determine the biological and clinical significance of the immune-cell distributions identified using this approach.
When full-spectrum flow cytometry is applied to clinical specimens, obtaining high-quality single-cell suspensions is an important prerequisite for reliable analysis. Sample-processing procedures, including red blood cell lysis and enzymatic tissue digestion, should therefore be carefully controlled19,20. A limitation of the present study is that cell recovery before and after red blood cell lysis was not systematically quantified. In addition, dedicated processing-control experiments comparing different tissue dissociation, enzymatic digestion, or red blood cell lysis conditions were not performed. Although the two-step red blood cell lysis procedure was performed according to the manufacturer's instructions, its potential effects on granulocyte recovery or on the expression of CD11b, CD16, and CD66b were not directly assessed. These factors should be considered when applying the protocol to clinical specimens, particularly when granulocyte populations are of specific interest.
Another practical limitation is that clinical specimens in the current workflow were defined by sample volume or tissue size rather than by absolute cell number. Consequently, the total number of leukocytes or other cells entering each staining reaction may vary among specimens, resulting in variation in the antibody-to-cell ratio. The protocol was nevertheless designed as a streamlined workflow for limited clinical specimens, using a fixed whole-blood input volume or defined tissue input. This approach facilitates practical implementation when sample availability is limited. However, normalization by cell number may be preferable when quantitative comparisons of fluorescence intensity or staining characteristics across samples are required. In addition, tissue mass was not recorded for the initial representative tumor/peri-tumor specimens. Wet-weight measurements were subsequently obtained for two paired specimens, with tissue inputs ranging from approximately 0.5 to 0.9 g, providing a reference range for tissue input in subsequent applications.
An additional consideration is the applicability of the staining procedure to cryopreserved samples. The staining verification described in this study was not completed using revived PBMCs after cryopreservation. Therefore, the performance of the current panel in thawed and recovered PBMC samples remains to be confirmed. Additional validation using appropriately controlled cryopreserved samples would help determine whether freezing and thawing influence marker expression, cell recovery, or population identification.
Overall, the present study establishes a 12-color full-spectrum flow cytometry panel for the streamlined immunophenotypic characterization of human whole blood and solid tissue specimens. The panel enables simultaneous identification of major immune-cell populations and selected phenotypic subsets using a single staining tube and standardized gating strategy. The representative datasets demonstrate the practical application of the workflow rather than providing evidence for biological or clinical differences between sample groups. Although further validation is needed to assess cell recovery, processing effects, performance in cryopreserved samples, and reproducibility across larger and clinically characterized cohorts, this approach provides a practical framework for multiparametric immune-cell profiling when specimen availability is limited.
Divulgações
The authors declare no conflicts of interest.
Agradecimentos
This study was financially supported by the Project of State Key Laboratory of Neurology and Oncology Drug Development (SKLSIM-20250437), Henan Province Science and Technology Research Program (242102310001, 252102310270, LHGJ20250772, LHGJ20240743, LHGJ20230830, and LHGJ20230828), Henan Province Joint Fund for Science and Technology Research and Development Program (252103810351), Henan Province Engineering Research Center of Pulmonary Diseases Multi-omics Precision Diagnosis and Treatment (DZXGCZXYN01 and DZXGCZXYN04), Luoyang Municipal Guiding Scientific Research Program Project (2501089B) and Luoyang Key Medical and Health Projects (2302009A).
Materiais
| Nome | Empresa | Número de catálogo | Comentários |
|---|---|---|---|
| Blocking buffer | 5% (v/v) Human TruStain FcX and 2% (v/v) Fetal Bovine Serum in D-PBS | ||
| Brilliant Staining Buffer | Thermo Fisher Scientific | 00-4409-75 | Used to make antibody cocktail |
| CD11b antibody | Selleck | G4672; RRID: AB_3750934 | Clone:M1/70; Stock concentration: 0.5mg/ml |
| CD14 antibody | Thermo Fisher Scientific | 416-0149-42; RRID: AB_2929096 | Clone: 61D3; Stock concentration: 0.2mg/ml |
| CD16 antibody | BioLegend | 302016; RRID: AB_314216 | Clone: 3G8; Stock concentration: 0.2mg/ml |
| CD19 antibody | BioLegend | 302252; RRID: AB_2563560 | Clone: HIB19; Stock concentration: 0.05mg/ml |
| CD3 antibody | Thermo Fisher Scientific | 407-0038-42; RRID: AB_2921023 | Clone: UCHT1; Stock concentration: 0.1mg/ml |
| CD4 antibody | Thermo Fisher Scientific | 12-0048-42; RRID: AB_2016675 | Clone: OKT-4; Stock concentration: 0.12mg/ml |
| CD45 antibody | BioLegend | 368508; RRID: AB_2566368 | Clone: 2D1; Stock concentration: 0.1mg/ml |
| CD56 antibody | BD biosciences | 562751; RRID: AB_2732054 | Clone: NCAM16.2; Stock concentration: 0.05mg/ml |
| CD66b antibody | BioLegend | 305118; RRID: AB_2566607 | Clone: G10F5; Stock concentration: 0.2mg/ml |
| CD8a antibody | Thermo Fisher Scientific | 15-0088-42; RRID: AB_1633398 | Clone: RPA-T8; Stock concentration: 0.05mg/ml |
| Collagenase IV | Beyotime | Y296939 | For 10 mg/mL Collagenase IV stock, dissolve 200 mg Collagenase IV in 20 mL HBSS solution, and use the 0.22 μm filter membrane for sterilization filtration. Aliquot and store at -20°C for up to 36 months. Avoid repeated freeze-thaw cycles. |
| DAPI | Sigma-Aldrich | D9542 | For 1 mg/mL DAPI stock, dissolve 1 mg DAPI in 1 mL ddH2O. Aliquot and store at -20°C for up to 12 months. Protect from light and avoid repeated freeze-thaw cycles. Dilute the 1 mg/mL DAPI stock solution 1:2,000 (v/v) in D-PBS to prepare a working solution with a final DAPI concentration of 0.5 µg/mL. |
| DMEM | Gibco | C11965500BT | High glucose (4.5 g/L) with L-glutamine and phenol red |
| DMEM complete medium | 10% (v/v) Fetal Bovine Serum and 1% (v/v) Penicillin-Streptomycin Liquid in DMEM | ||
| DNase I | Macklin | D799285 | For 1.25 mg/mL DNase I stock, dissolve 5 mg DNase I in 4 mL double-distilled water (ddH2O). Aliquot and store at -20°C for up to 12 months. Avoid repeated freeze-thaw cycles. |
| D-PBS | Solarbio | D1040 | Dulbecco’s Phosphate-Buffered Saline (without Ca2+/Mg2+) |
| FACS buffer | 2% (v/v) Fetal Bovine Serum in D-PBS | ||
| Fetal Bovine Serum | Gibco | A5256701 | Used to make FACS buffer and blocking buffer |
| HBSS | Solarbio | H1025 | Hanks (without Ca2+/Mg2+, without phenol red) |
| HLA-DR antibody | Thermo Fisher Scientific | 414-9956-42; RRID: AB_3251017 | Clone: LN3; Stock concentration: 0.25mg/ml |
| Human TruStain FcX | Biolegend | 422302 | Used to make blocking buffer |
| Northern Lights flow cytometer | Cytek Biosciences Co., Ltd | Northern Lights flow cytometer equipped with 405, 488, and 640 nm lasers and a CWDM full-spectrum detection system, which collects fluorescence signals across the 420-829 nm wavelength range. Data acquisition and spectral analysis were performed using SpectroFlo software. | |
| Penicillin-Streptomycin Liquid | Solarbio | P1400 | |
| Red Blood Cell Lysis Buffer | Solarbio | R1010 |
Referências
- Hagerling C, Casbon AJ, Werb Z. Balancing the innate immune system in tumor development. Trends Cell Biol. 2015;25(4):214–20.
- Bi Q, et al. Tumor-associated inflammation: the tumor-promoting immunity in the early stages of tumorigenesis. J Immunol Res. 2022;2022:3128933.
- Nahrendorf M, Ginhoux F, Swirski FK. Immune system influence on physiology. Science. 2025;389(6760):594–9.
- Kumari D, et al. Flow cytometry profiling of cellular immune response in COVID-19 infected, recovered and vaccinated individuals. Immunobiology. 2023;228(3):152392.
- Adamo S, et al. Profound dysregulation of T cell homeostasis and function in patients with severe COVID-19. Allergy. 2021;76(9):2866–81.
- Crosby EJ, et al. Long-term survival of patients with stage III colon cancer treated with VRP-CEA(6D), an alphavirus vector that increases the CD8+ effector memory T cell to Treg ratio. J Immunother Cancer. 2020;8(2):e001179.
- Pérez-Lanzón M, et al. Flow cytometry assessment of lymphocyte populations infiltrating liver tumors. In: Kroemer G, Pol J, Martins I, editors. Liver Carcinogenesis: Methods and Protocols. Methods Mol Biol. Vol. 2769. Humana; New York, NY; 2024. p. 129–41. https://doi.org/10.1007/978-1-0716-3694-7_10.
- Waaijer LA, van Cranenbroek B, Koenen HJPM. OMIP-112: 42-parameter (40-color) spectral flow cytometry panel for comprehensive immunophenotyping of human peripheral blood leukocytes. Cytometry A. 2025;107(4):226–32.
- Liechti T, Roederer M. OMIP-051: 28-color flow cytometry panel to characterize B cells and myeloid cells. Cytometry A. 2019;95(2):150–5.
- Germain RN. T-cell development and the CD4–CD8 lineage decision. Nat Rev Immunol. 2002;2(5):309–22.
- Osuna-Gómez R, et al. Effector mechanisms of CD8+ HLA-DR+ T cells in breast cancer patients who respond to neoadjuvant chemotherapy. Cancers (Basel). 2021;13(24):6167.
- Triaille C, Fernandez I, Touzot F. HLA-DR+ CD8+ T lymphocytes as an alternative T-cell activation marker in pediatric HLH: a real-life study. Pediatr Allergy Immunol. 2026;37(1):e70282.
- Guo H, et al. CD8+HLA-DR+CD27+ T cells define a population of naturally occurring regulatory precursors in humans. Sci Adv. 2025;11(37):eadw1702.
- Tippalagama R, et al. HLA-DR marks recently divided antigen-specific effector CD4 T cells in active tuberculosis patients. J Immunol. 2021;207(2):523–33.
- Wang K, Wei G, Liu D. CD19: a biomarker for B cell development, lymphoma diagnosis and therapy. Exp Hematol Oncol. 2012;1(1):36.
- Wong KL, et al. Gene expression profiling reveals the defining features of the classical, intermediate, and nonclassical human monocyte subsets. Blood. 2011;118(5):e16–31.
- Gao J, et al. Deep immunophenotyping of human whole blood by standardized multiparametric flow cytometry analyses. Phenomics. 2023;3(3):309–28.
- Nesterova IV, et al. Remodeling of phenotype CD16+CD11b+ neutrophilic granulocytes in acute viral and acute bacterial infections. In: Khajah M, editor. Neutrophils. IntechOpen; London; 2018. https://doi.org/10.5772/intechopen.81631.
- Krémer V, et al. Isolation methods determine human neutrophil responses after stimulation. Front Immunol. 2023;14:1301183.
- Elghetany MT, Davis BH. Impact of preanalytical variables on granulocytic surface antigen expression: a review. Cytometry B Clin Cytom. 2005;65(1):1–5.
- Macey MG, et al. Expression of functional antigens on neutrophils: effects of preparation. J Immunol Methods. 1992;149(1):37–42.
- Brodin P, Davis MM. Human immune system variation. Nat Rev Immunol. 2017;17(1):21–9.