11.13
Phase Diagrams
Carbon dioxide can exist as a solid, liquid, or gas under specific temperatures and pressures. This dependence is mapped into a phase diagram, which includes three general features: regions, lines, and points.
Regions represent the temperature and pressure conditions for a single phase. At standard pressure, carbon dioxide can be solid or gaseous, depending on the temperature.
At pressures below 5.1 atm, if the temperature of solid carbon dioxide is raised, it will directly transition to the gaseous phase without passing through the liquid form.
A transition through all three phases — solid to liquid and liquid to gas — will occur at pressures above 5.1 atm.
The lines or curves that separate the regions denote the temperatures and pressures at which the phases on either side of the curve are in equilibrium.
For example, the point at 1 atm and −78.5 °C, lies on the curve separating the solid and vapor phases, so a solid–vapor equilibrium exists under those conditions. Accordingly, this is called the sublimation curve.
Similarly, the liquid-gas equilibrium exists on the vaporization curve, and the solid-liquid equilibrium exists on the fusion curve. These curves are known more generally as phase boundaries.
At 5.1 atm and −56.6 °C all three phases will coexist. This is the triple point of carbon dioxide.
At 73 atm and 31 °C, both liquid and vapor phases of carbon dioxide will coalesce into a single-phase supercritical fluid. This is the critical point of carbon dioxide.
In the region beyond the critical point no pressure or temperature change can convert a supercritical fluid to a gas or liquid.
The phase diagram of water has a few notable differences from that of carbon dioxide.
The fusion curve of carbon dioxide has a positive slope, while for water, the slope is negative. This is an atypical feature of water. Increasing the pressure favors a liquid-to- solid transition in carbon dioxide but a solid-to-liquid transition in water.
The higher pressure favors the denser solid form of carbon dioxide. In the case of water, the denser liquid form is favored
A phase diagram combines plots of pressure versus temperature for the liquid-gas, solid-liquid, and solid-gas phase-transition equilibria of a substance. These diagrams indicate the physical states that exist under specific conditions of pressure and temperature and also provide the pressure dependence of the phase-transition temperatures (melting points, sublimation points, boiling points). Regions or areas labeled solid, liquid, and gas represent single phases, while lines or curves represent two phases coexisting in equilibrium (or phase change points). The triple point indicates conditions of pressure and temperature at which all three phases coexist. In contrast, a critical point indicates the temperature and pressure above which a single phase—whose physical properties are intermediate between the gaseous and liquid states—exists.
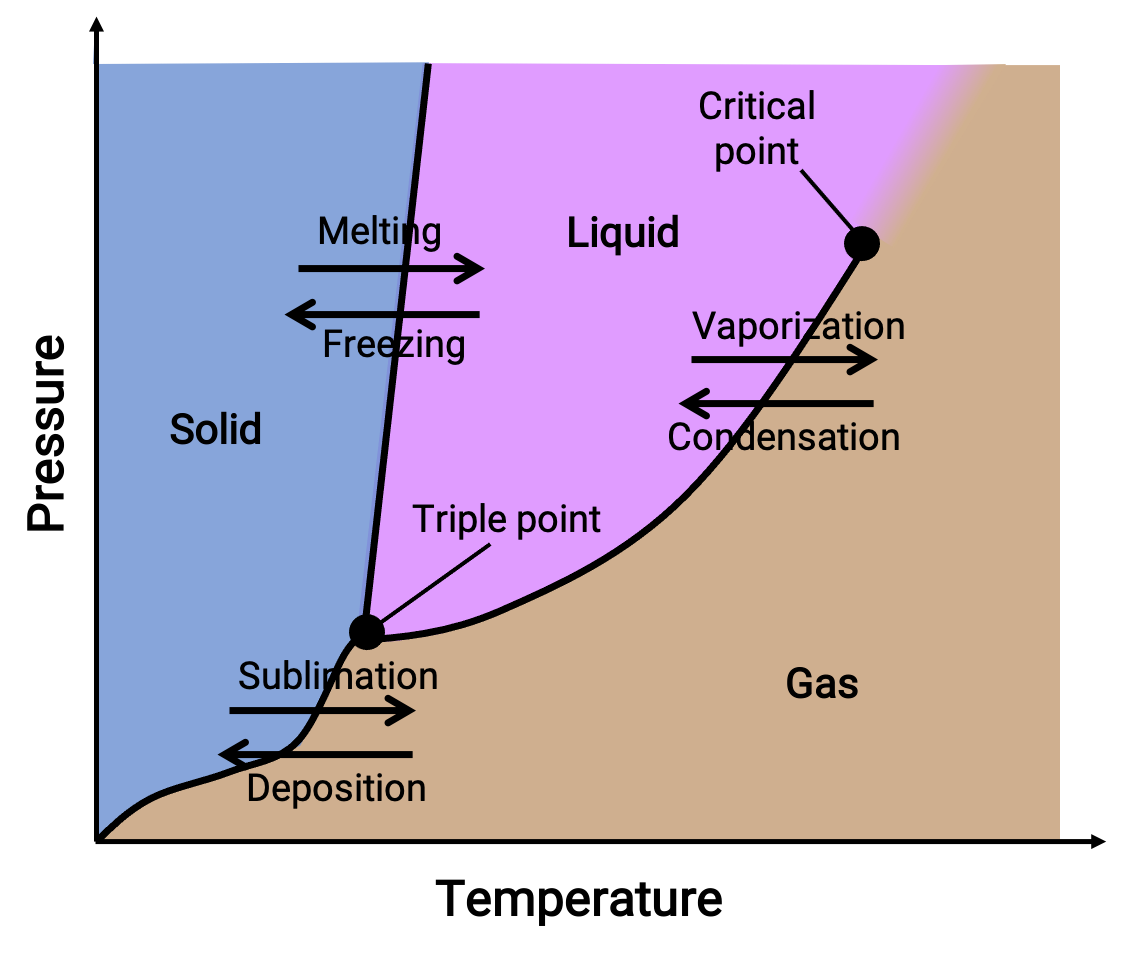
Figure 1. A typical phase diagram.
A phase diagram identifies the physical state of a substance under specified conditions of pressure and temperature. To illustrate the utility of these plots, consider the phase diagram of water, shown below.
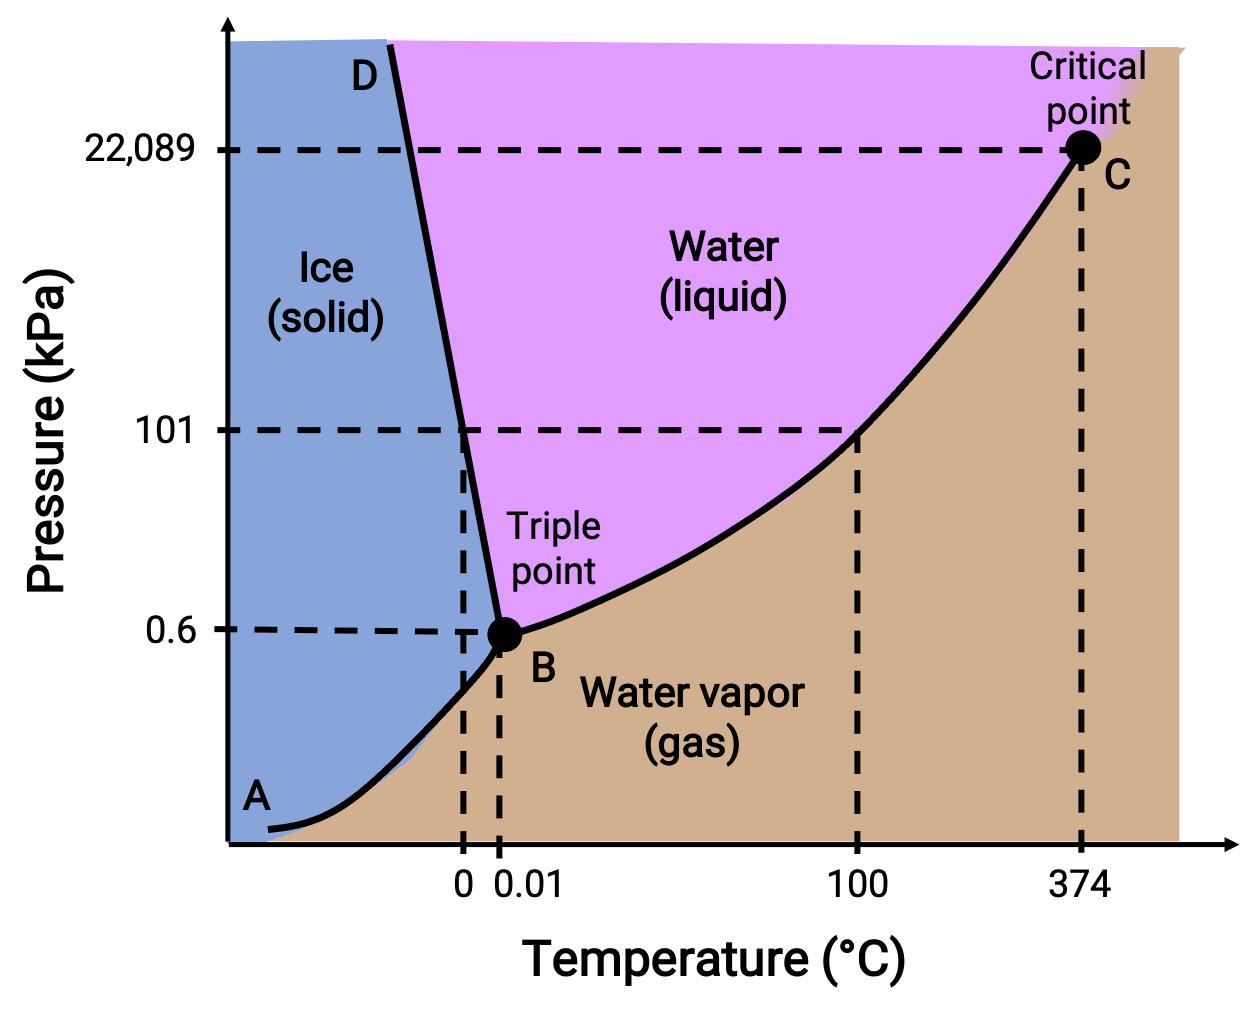
Figure 2. Phase diagram of water.
A pressure of 50 kPa and a temperature of −10 °C corresponds to the region of the diagram labeled “ice.” Under these conditions, water exists only as a solid. A pressure of 50 kPa and a temperature of 50 °C corresponds to the region where water exists only as a liquid. At 25 kPa and 200 °C, water exists only in the gaseous state. Curve BC is the liquid-vapor curve separating the liquid and gaseous regions of the phase diagram and provides the boiling point for water at any pressure. For example, at 1 atm, the boiling point is 100 °C. Notice that the liquid-vapor curve terminates at a temperature of 374 °C and a pressure of 218 atm, indicating that water cannot exist as a liquid above this temperature, regardless of the pressure. The physical properties of water under these conditions are intermediate between those of its liquid and gaseous phases. This unique state of matter is called a supercritical fluid. The solid-vapor curve labeled AB, indicates the temperatures and pressures at which ice and water vapor are in equilibrium. These temperature-pressure data pairs correspond to the sublimation, or deposition, points for water.
The solid-liquid curve labeled BD shows the temperatures and pressures at which ice and liquid water are in equilibrium, representing the melting/freezing points for water. Note that this curve exhibits a slight negative slope, indicating that the melting point for water decreases slightly as pressure increases. Water is an unusual substance in this regard, as most substances exhibit an increase in melting point with increasing pressure. The point of intersection of all three curves—labeled B—is the triple point of water, where all three phases coexist in equilibrium. At pressures lower than the triple point, water cannot exist as a liquid, regardless of the temperature.
Consider the phase diagram for carbon dioxide as another example.
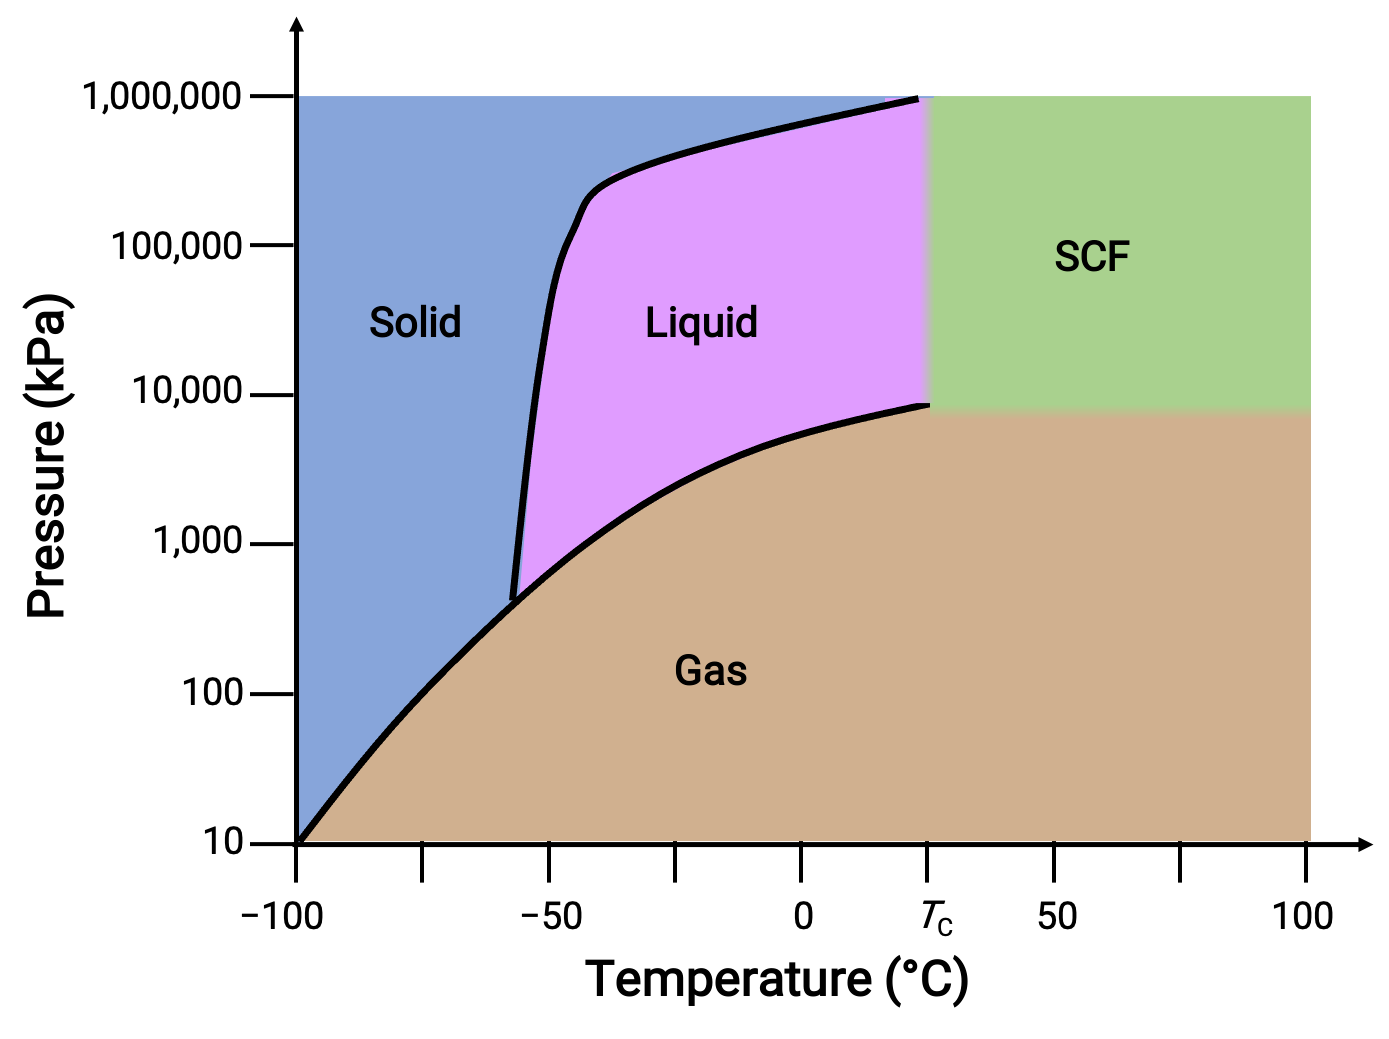
Figure 3. Phase diagram of carbon dioxide.
The solid-liquid curve exhibits a positive slope, indicating that the melting point for CO2 increases with pressure as it does for most substances. Notice that the triple point is well above 1 atm, indicating that carbon dioxide cannot exist as a liquid under ambient pressure conditions. Instead, cooling gaseous carbon dioxide at 1 atm results in its deposition into the solid-state. Likewise, solid carbon dioxide does not melt at 1 atm pressure but instead sublimes to yield gaseous CO2. Finally, the critical point for carbon dioxide is observed at a relatively modest temperature and pressure in comparison to water.
This text is adapted from Openstax, Chemistry 2e, Section 10.4: Phase Diagrams.
Carbon dioxide can exist as a solid, liquid, or gas under specific temperatures and pressures. This dependence is mapped into a phase diagram, which includes three general features: regions, lines, and points.
Regions represent the temperature and pressure conditions for a single phase. At standard pressure, carbon dioxide can be solid or gaseous, depending on the temperature.
At pressures below 5.1 atm, if the temperature of solid carbon dioxide is raised, it will directly transition to the gaseous phase without passing through the liquid form.
A transition through all three phases — solid to liquid and liquid to gas — will occur at pressures above 5.1 atm.
The lines or curves that separate the regions denote the temperatures and pressures at which the phases on either side of the curve are in equilibrium.
For example, the point at 1 atm and −78.5 °C, lies on the curve separating the solid and vapor phases, so a solid–vapor equilibrium exists under those conditions. Accordingly, this is called the sublimation curve.
Similarly, the liquid-gas equilibrium exists on the vaporization curve, and the solid-liquid equilibrium exists on the fusion curve. These curves are known more generally as phase boundaries.
At 5.1 atm and −56.6 °C all three phases will coexist. This is the triple point of carbon dioxide.
At 73 atm and 31 °C, both liquid and vapor phases of carbon dioxide will coalesce into a single-phase supercritical fluid. This is the critical point of carbon dioxide.
In the region beyond the critical point no pressure or temperature change can convert a supercritical fluid to a gas or liquid.
The phase diagram of water has a few notable differences from that of carbon dioxide.
The fusion curve of carbon dioxide has a positive slope, while for water, the slope is negative. This is an atypical feature of water. Increasing the pressure favors a liquid-to- solid transition in carbon dioxide but a solid-to-liquid transition in water.
The higher pressure favors the denser solid form of carbon dioxide. In the case of water, the denser liquid form is favored
From Chapter 11:

Now Playing
11.13 : Phase Diagrams
Liquids, Solids, and Intermolecular Forces
46.9K Views

11.1 : Molecular Comparison of Gases, Liquids, and Solids
Liquids, Solids, and Intermolecular Forces
51.3K Views

11.2 : Intermolecular vs Intramolecular Forces
Liquids, Solids, and Intermolecular Forces
94.0K Views

11.3 : Intermolecular Forces
Liquids, Solids, and Intermolecular Forces
65.6K Views

11.4 : Comparing Intermolecular Forces: Melting Point, Boiling Point, and Miscibility
Liquids, Solids, and Intermolecular Forces
44.0K Views

11.5 : Surface Tension, Capillary Action, and Viscosity
Liquids, Solids, and Intermolecular Forces
29.5K Views

11.6 : Phase Transitions
Liquids, Solids, and Intermolecular Forces
19.9K Views

11.7 : Phase Transitions: Vaporization and Condensation
Liquids, Solids, and Intermolecular Forces
17.7K Views

11.8 : Vapor Pressure
Liquids, Solids, and Intermolecular Forces
31.7K Views

11.9 : Clausius-Clapeyron Equation
Liquids, Solids, and Intermolecular Forces
59.7K Views

11.10 : Phase Transitions: Melting and Freezing
Liquids, Solids, and Intermolecular Forces
12.2K Views

11.11 : Phase Transitions: Sublimation and Deposition
Liquids, Solids, and Intermolecular Forces
16.6K Views

11.12 : Heating and Cooling Curves
Liquids, Solids, and Intermolecular Forces
23.9K Views

11.14 : Structures of Solids
Liquids, Solids, and Intermolecular Forces
19.5K Views

11.15 : Molecular and Ionic Solids
Liquids, Solids, and Intermolecular Forces
16.9K Views
See More