$$\rightleftharpoonup{xx}$$
$$\longleftharp{xx}$$,
$$\longrightharp{xx}$$,
1. Preparation of CXCL12, Assay Buffer, and Jurkat Cells for the Competition Binding Assay
- Prepare a stock solution of CXCL12AF647 (20 µg/mL; see Table of Materials and Reagents) by dissolving the lyophilized reagent (stored at -80 °C, in the dark) in ultrapure water supplemented with 0.01% (volume/volume) of Polysorbate 20. Store single-use aliquots from this stock solution at -80 °C, protected from light.
- Prepare assay buffer by adding 40 mL HEPES (1 M, 20 mM final concentration) to 200 mL Hank's Balanced Salt Solution (HBSS, 10x, without phenol red and without sodium bicarbonate, 1x final concentration). Add ultrapure water to obtain a final volume of 2 L. Add 4 g (0.2% weight/volume) bovine serum albumin (BSA), and dissolve the BSA via magnetic stirring. Finally, adjust the pH to 7.4 (use NaOH for this) and filter the solution through 0.2 µm pores (see Table of Materials and Reagents) using a vacuum manifold.
NOTE: This assay buffer will be used in all further steps of the protocol.
- Count the number and the viability of the Jurkat cells. For this, take a sample of the cell suspension and dilute it in phosphate-buffered saline (PBS).
NOTE: We routinely use an automated cell viability analyzer (see Table of Materials and Reagents) capable of counting cell suspensions at varying concentrations. For cell counting, dilute 0.5 mL of cell suspension in 1.5 mL PBS (other dilutions, e.g., 0.1 mL in 1.9 mL PBS, are also possible). Several other devices are commercially available for counting cell numbers and viability that should work equally well.
- Collect the desired number of cells (i.e., ~24 x 106 cells to run the assay with one complete 96-well plate) in a sterile 50 mL tube by centrifugation (see Table of Materials and Reagents for the type of centrifuge used) at 400 x g for 5 min at RT.
- Gently pour off the supernatant without disturbing the cell pellet. Add fresh assay buffer (e.g., 20 mL) and resuspend the cells by gently pipetting up and down.
- Centrifuge the cells again at 400 x g for 5 min at RT.
- Pour off the supernatant again and resuspend the cell pellet in fresh assay buffer to obtain a density of 5 x 10⁶ cells/mL.
2. Competition Binding Assay
NOTE: The actual competition binding assay is performed at RT and can be performed under non-sterile conditions.
- Dilute the compounds under investigation in assay buffer (see 1.2) to obtain the desired concentration. Either prepare a fixed concentration of compound for initial screening (e.g., 10 µM final concentration) or, alternatively, a serial dilution series of concentrations for more detailed characterization of the compounds (e.g., a 1/3, 1/4, or 1/5 dilution series starting at 1 µM, final concentration). Keep in mind that the compound solution will ultimately become 2x diluted in the assay; therefore, prepare a 2x concentrated solution.
- Dispense 100 µL of compound solution (2x concentrated) into a clear 96-well round bottom plate (see Table of Materials and Reagents) according to a pre-defined experimental layout (e.g., Figure 1C).
NOTE: At this stage, negative and positive control samples are included in the assay. In the negative control sample, 100 µL of assay buffer is added instead of the compound to the wells of the 96-well plate. For the positive control sample, an assay buffer is also added during this step. See also Figure 1C for a typical experimental layout in which a dilution series of several compounds is tested.
- Add 50 µL of cell suspension (see 1.7; 0.25 x 10⁶ cells) from a reagent reservoir into the 96-well plate using a multichannel pipette. Incubate the plate for 15 min at RT in the dark.
- Add 50 µL of fluorescently labeled CXCL12 (i.e., 100 ng/mL of CXCL12AF647 in assay buffer, 4x concentrated, 25 ng/mL final concentration) from a similar reagent reservoir to the wells of the 96-well plate. Incubate for 30 min at RT in the dark.
NOTE: For the negative control samples, add assay buffer instead. Hence, the fluorescent signal detected in the negative control samples will correspond to the autofluorescent background signal (Figure 1A). For the positive control samples, add 50 µL/well of CXCL12AF647. The positive control samples will yield the maximal fluorescence signal detected since no potential inhibition by pre-incubation with compounds was included (Figure 1A).
- Centrifuge the 96-well plate at 400 x g for 5 min at RT. Remove the supernatant from the pelleted cells by flipping over the plate. Dry the plate on a tissue.
- Add 200 µL of fresh assay buffer from a reagent reservoir to the wells using a multichannel pipette. Immediately proceed.
- Centrifuge the plate again for 5 min at 400 x g at RT. Remove the supernatant by flipping over the plate and again dry it on a tissue.
- Gently resuspend the cell pellet in 200 µL of 1% paraformaldehyde dissolved in PBS. This step will fix the cells.
- Continue the protocol immediately with the quantification of the fluorescence by flow cytometry.
3. Analysis of the samples by flow cytometry
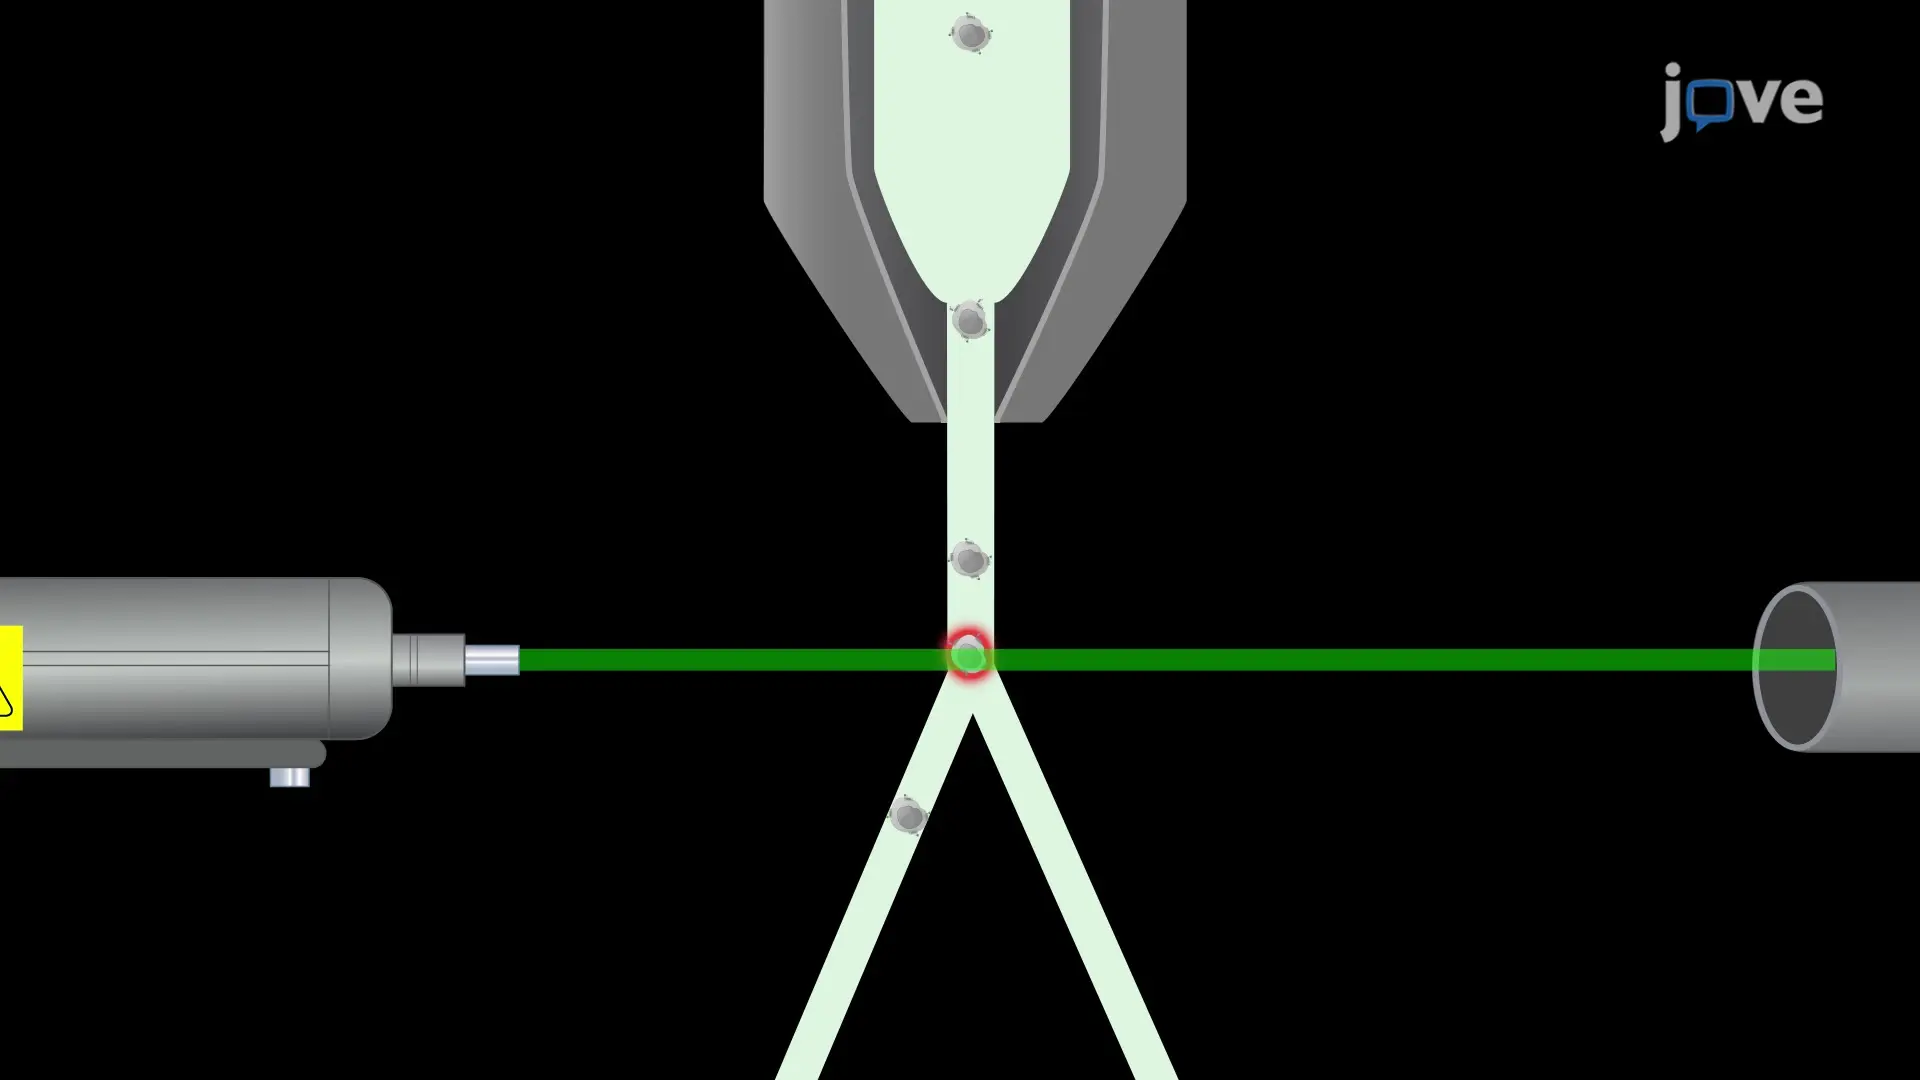
CXCL12AF647 stained and fixated cells are now ready to be analyzed using flow cytometry. Several types of flow cytometers can be used, but they need to be equipped with the correct laser (i.e., a red laser, excitation range ~630 nm) for excitation and suitable filters for fluorophore detection (emission filters ~660 nm). They need to be capable of handling samples in a 96-well plate format. Examples of suitable flow cytometry devices are given in the Table of Materials and Reagents.
- Start up the device and open the corresponding software (see Table of Materials and Reagents).
- Select the following cellular parameters to be visualized in a dot blot format: forward scatter (FSC), side scatter (SSC), and the fluorophore (CXCL12AF647) detection channel.
NOTE: With the FSC parameter, cells are discriminated based on their size, since the detected light absorption is proportional to the cell's diameter. The SSC parameter, measuring light scattering at a 90° angle, provides information about the granularity of the cells.
- Choose one sample (e.g., a negative control sample) to perform gating of a defined homogenous cell population based on the FSC and SSC parameters.
- Select automatic injection of ~100 µL of fixated cells from this negative control sample into the flow cytometer. Select the option "mixing" before injection and use a sample flow rate of 1.5 µL/s.
- Run this sample by selecting "Acquire Data." The FSC and SSC parameters for this sample will now appear on the screen.
- Select the software's gating tool. Based on the FSC and SSC dot blot visualization, pre-define a homogenous and viable cell population by gating. To do so, create a polygon (using the software's gating tool) that includes the homogenously distributed single cells ("events") based on these two dimensions.
NOTE: The gating procedure aims to define a homogenous and viable cell population that will be used for further analysis. Gating relies on the assumption that the majority of viable cells will form a homogenous cell population based on the FSC and SSC parameters. By performing this step, cellular debris, dead cells, and cell aggregates can largely be excluded from further analysis. An illustration of the gating process is given in Figure 1B.
- Select to analyze 20,000 "events" (i.e., single cells) per sample.
NOTE: This means that for each sample, 20,000 cells that fall within the pre-defined gate will eventually be analyzed. Data acquisition for each sample will continue until this number of events is analyzed.
- Start the run (select "Record Data"). The flow cytometry device will now analyze all samples one-by-one by recording the mean fluorescence intensity (MFI) for each sample. This MFI corresponds to the mean fluorescent signal corresponding to the 20,000 cells that fall within the pre-defined gate.