This video demonstrates the two-photon imaging technique combined with optogenetics using holographic microscopy. Using a spatial light modulator, this technique enables precise neuronal stimulation expressing the red-light-sensitive protein and calcium imaging with minimal photodamage. This approach provides insights into the functional connectivity and organization of neural networks.
A subscription to JoVE is required to view this content. Sign in or start your free trial.
Method Article
Two-Photon Holographic Microscopy to Study Neural Activity and Connectivity in a Mouse Model
981 views
⸱
June 17th, 2025
In This Article
Abstract
Protocol
All procedures involving animal models have been reviewed by the local institutional animal care committee and the JoVE veterinary review board.
1. Head plate implantation (Figure 1A)
- Administer the anesthetic (a mixture of 74 mg/kg ketamine and 10 mg/kg xylazine) intraperitoneally to anesthetize the mouse. Check the anesthetic status of the mouse frequently by assessing the pedal reflexes.
- After anesthesia, place the mouse in a stereotaxic instrument. Apply an eye ointment (see Table of Materials) to prevent the cornea from drying out when the head plate is implanted.
- Shave the surgical area and disinfect the skin with three alternating rounds of povidone-iodine or chlorhexidine scrubs followed by 70% alcohol wipes. Carefully expose the skull and clean it with cotton swabs.
NOTE: All surgical instruments should be sterilized, and all procedures should be performed accordingly. Any remaining debris (e.g., hair or dried blood) causes inflammatory reactions. Therefore, any debris should be removed under a stereoscope using cotton swabs moistened with sterile water or 70% alcohol. - Use the stereotactic coordinates- anterior and posterior = 0.5 mm, medial and lateral = 1.5 mm from bregma-to find the center of the craniotomy and label it with a marker pen.
- Place a custom-made head plate at the center of the skull. Next, apply dental cement (see Table of Materials) to firmly fix it to the skull. Apply light pressure until the head plate makes firm contact with the front and back of the skull.
NOTE: This step takes approximately 20 min to complete and is critical for reducing motion artifacts in the brain during two-photon imaging. The dimensions of the head-plate are 20 mm × 40 mm × 1 mm with a home plate shape opening with one edge 15 mm long, two adjacent sides 3 mm long, and the remaining two sides 10 mm long. - Mix together an acrylic-based dental adhesive resin cement as follows: half a spoon of powder, three drops of liquid, and one drop of catalyst (see Table of Materials). To prevent drying, apply this mixed dental adhesive resin cement to the intact skull surface of the mouse with the head plate.
- Place the mouse in a warm cage until it has recovered from anesthesia. Do not leave the mouse unattended until it has regained sufficient consciousness to maintain sternal recumbency.
2. Surgery and adeno-associated virus (AAV) injection (Figure 1B)
- Perform craniotomy or viral injection without removal of the dental adhesive resin cement from the skull 1 day after head plate implantation.
NOTE: Administer anesthesia (a mixture of 74 mg/kg ketamine and 10 mg/kg xylazine) intraperitoneally to the mouse during this procedure. - To avoid cerebral edema, administer dexamethasone sodium phosphate (1.32 mg/kg) intraperitoneally 1 h before surgery.
- Anesthetize the mouse with the head plate with 1% isoflurane anesthesia using a vaporizer (anesthesia delivery system) while maintaining body temperature with a heating pad. Apply an eye ointment to prevent corneal drying.
- Under a stereoscope, perform a circular craniotomy approximately 2 mm in diameter using a dental drill. To reduce brain damage, operate the dental drill carefully with constant slight movement and light downward pressure.
- Remove bone fragments several times using a suction system. After removing the bone fragments, use an artificial spinal fluid (ACSF) solution to remove and wash any debris remaining on the brain surface. Repeat this cleaning procedure several times to suppress inflammatory reactions.
NOTE: The ACSF solution (140 mM sodium chloride, NaCl, 2.5 mM potassium chloride, KCl, 5 mM 4-(2-hydroxyethyl)-1-piperazineethanesulfonic acid, HEPES, 2.0 mM calcium chloride, CaCl2, and 1.0 mM magnesium chloride, MgCl2) was stored at 4 °C for 1 month after the reagent was dissolved and filtered (pore size = 0.22 µm). - Using a pressure injection system (see Table of Materials), set the appropriate pressure (about 10 Pounds per square inch (PSI) in pulses with a duration of 4 ms) to inject 500 nL of AAV solution through a glass capillary with a tip diameter of 10-20 µm (prepared with a micropipette puller) for 10 min.
- Determine whether the AAV solution is being administered to the brain by checking whether the level of the AAV solution in the glass capillary gradually decreases.
- Leave the glass capillary in place for an additional 10 min to prevent backflow. Repeat three times to administer a total of 1.5 µL of AAV solution into the brain.
- To evaluate and manipulate neural activity in layer 2/3 (L2/3) pyramidal cells, inject an AAV solution (for Ca2+ imaging: AAV2/1-Syn-jGCaMP8f-WPRE at 1.28 × 10¹⁴ vector genomes/mL, diluted 1:1 in saline; for Ca2+ imaging with optogenetics: AAV2/8-CaMKII-GCaMP6m-P2A-ChRmine-Kv2.1-WPRE at 1.73 × 10¹⁴ vector genomes/mL, diluted 1:1 in saline) into the hind paw area of the primary somatosensory cortex of wild-type mice (S1, centered at 0.5 mm posterior and 1.5 mm lateral from the bregma, 150 µm depth from the surface).
NOTE: The AAV solution should be injected at 2-3 weeks and 1-2 weeks before imaging for jGCaMP8f and GCaMP6m-P2A-ChRmine expression, respectively. - After an application of 2% (w/v) low-melting agarose to the brain surface of S1 using a micropipette, place a glass window over the craniotomy with two cover glasses. Attach the two cover glasses (small 2.0 mm diameter and large 4.5 mm diameter; see Table of Materials) with ultraviolet (UV) curable adhesive.
- Press the cover glass against the agarose while it is still liquid; this prevents the formation of air bubbles in the agarose. Seal the edges of the cranial window with dental and adhesive resin cement (Figure 1C).
- Remove the mouse from the stereotaxic instrument and return it to its cage. Place the mouse in a warm cage and do not return to the cage with other animals until it has fully recovered from anesthesia. Carefully maintain sterile conditions during survival surgery.
- For the first 72 hours after surgery, check the health status of the mouse by observing general behavior. If there are any abnormalities in general behavior, subcutaneously inject anti-inflammatory and analgesic agents.
3. Preparation for the holographic stimulation or illumination system (Figure 2)
- Calibrate the holographic stimulation system by placing the surface of a red fluorescence slide (cast acrylic substrate) at the sample plane. Place the microscope in live imaging mode with a weak excitation light and run the calibration_GUI.m file. Check the parameters pane and click on the Save button.
- Click the Z Scan button in the step 1 pane. It will automatically generate three random spots in all 21 axial planes, 2 µm apart from each plane.
- Move the slide bar and check the live image. Find a perfect plane where the spots appear the smallest and the brightest, and then click the Save button. This will automatically generate an offset spherical wavefront for the digital hologram.
NOTE: If you fail to find the brightest fluorescence spots, change the minimum and maximum values of the scan range and try again. - Click the Go button in the step 2 pane, and then click six spots on the left square. Check the live image. If there are six distinguishable fluorescence spots, then type their x and y axis to the edit boxes and click the Save button. This will automatically generate affine transform coefficients to coordinate calibration between the holographic stimulation and imaging system.
NOTE: The axis pair number and clicked spot number must be matched in order. If not sure, or if there are no spots in your image, please try again and generate a unique spot pattern or choose a smaller range around the center of the field of view (FOV). - Click the Scan button in the step 3 pane. It will generate 441 digital holograms to perform single spot scanning across the FOV in 21 × 21 steps.
- First, check the images while changing patterns in the list box. Then, adjust the laser power to obtain spot images within the dynamic range of the imaging device (for instance, to avoid overly saturated images).
- Subsequently, adjust the interval time in the edit box; the interval time should be more than two times the recording interval time. Finally, put the imaging device in recording mode and click the Play button. If the play completes, there will be "display OK" strings shown in the command window. Stop recording and stack up recorded sequential images using the max intensity method.
- Click Generate WM in the step 4 pane and choose a stacked image from above. Then close the calibration_GUI window. It will automatically generate a weight map to compensate for the unbalanced intensity in each spot.
NOTE: For a more detailed description, the MATLAB code can be downloaded from here (https://github.com/ZenKG/SLM_control).
4. Ca2+ imaging using an image sensor with holographic illumination (Figure 3)
- Place the AAV-injected mouse with a head plate under the microscope (Figure 1D).
NOTE: During this procedure, the mouse is restrained in the awake state, but is able to escape uncomfortable stimuli. - Perform two-photon imaging (point scanning mode) using a holographic microscope and a mode-locked Ti: sapphire laser tuned to 920 nm with a 25x objective (see Table of Materials).
- Turn on the commercial imaging software (see Table of Materials). In the live imaging mode, adjust the voltage of the image detector (see Table of Materials) and the power of the imaging laser to optimize the brightness of the neurons expressing jGCaMP8f. Capture images of the neurons expressing this protein.
NOTE: The intensity of the imaging laser (920 nm) is 20-30 mW. The FOV was 512 µm × 512 µm at a depth of 100-150 µm from the cortical surface. - To illuminate specific neurons expressing jGCaMP8f with holographic illumination, run the SLMcontrol.m script file. Click the Reference Image and choose the image acquired above. Then, click the Spot button to choose specific pixels on the neurons in the image by continuous mouse clicking (Figure 3A). If the selection is complete, push the Enter button on the keyboard to finalize it.
NOTE: The digital hologram is automatically calculated and displayed on the spatial light modulator (SLM). This pattern can also be revisited by clicking on a list box. The spatial resolution of a single spot generated by the SLM was approximately 1.2 µm along the transverse direction and ~8.3 µm along the optical axis. We used a high numerical aperture (1.1) objective lens to achieve more localized holographic stimulation. - To detect neural activity with high temporal resolution using an image sensor (see Table of Materials), set the exposure time, imaging area, and binning (Figure 3B) before performing image acquisition (Figure 3C).
NOTE: The intensity of the holographic illumination laser (920 nm) that continuously stimulates one neuron is 2 mW, which is sufficient to detect neural activity. For example, to achieve a frame rate of 100 Hz for imaging, the exposure time is 9 ms, the imaging area is 400 µm × 400 µm, and the binning is 4. - After the experiment, return the mouse to its home cage.
5. Two-photon imaging (point scanning mode) with optogenetics using a holographic microscope (Figure 4)
- Repeat steps 4.1 and 4.2.
- Turn on the commercial imaging software (see Table of Materials). In the live imaging mode, adjust the voltage of the image detector (see Table of Materials) and the power of the imaging laser to optimize the brightness of the neurons expressing GCaMP6m-P2A-ChRmine. Capture images of the neurons expressing these proteins (Figure 1E).
- Repeat step 4.4.
- To investigate the functional connectivity within L2/3 neurons, use an SLM to generate holographic patterns of optogenetic stimulation (ChRmine; 1,040 nm) and combine it with two-photon Ca2+ imaging (GCaMP6m; 920 nm, 512 × 512 pixels, 2 Hz or 30 Hz, 2x digital zoom, point scanning mode; Figure 3D-H).
- For this protocol, set the intensity of the imaging laser to 920 nm, at 10-20 mW, and the FOV as 256 µm × 256 µm measured at a depth of 100-150 µm from the cortical surface. Set the pixel dwell time at 1.5 µs for 2 Hz or 100 ns for 30 Hz.
- To see if a single holographic stimulus caused a calcium response in the neurons, use both 2 Hz and 30 Hz as the imaging frame rate. Set the intensity of the holographic stimulation laser (1,040 nm) that stimulates a single neuron at 10 mW, which is sufficient to induce neural activity (Figure 3D).
NOTE: The spatial resolution of a single spot generated by the SLM is approximately 1.2 µm along the transverse direction and ~8.3 µm along the optical axis. The range of accessible volume in the lateral direction is around 500 µm × 500 µm and 100 µm in the axial direction. We have further confirmed with Ca2+ imaging at 2 Hz or 30 Hz imaging frame rate that not only one neuron, but multiple neurons can be holographically stimulated simultaneously (Figure 3E).
- Perform image acquisition with the following protocol: simultaneously image the Ca2+ response at 920 nm with 10 holographic stimuli at 1,040 nm with 8 s intervals (0.125 Hz) for a duration of 50 ms after a baseline period of 10 s.
Access restricted. Please log in or start a trial to view this content.
Results
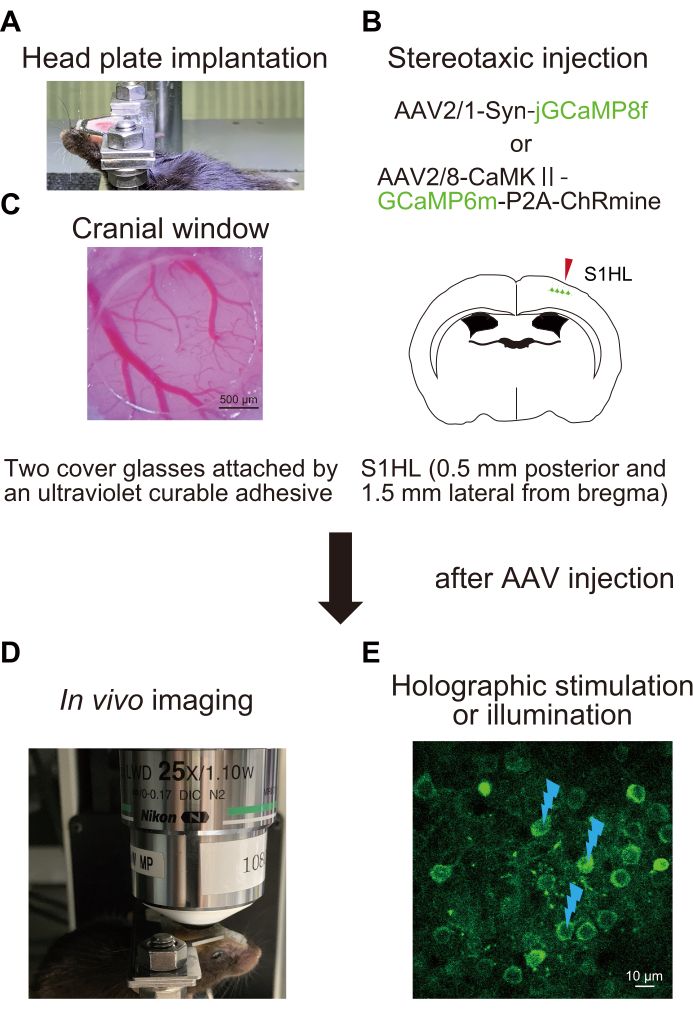
Figure 1: Schematic outline of the experimental procedure. (A) Fixation of t...
Access restricted. Please log in or start a trial to view this content.
Materials
| Name | Company | Catalog Number | Comments |
|---|---|---|---|
| 25x Objective | Nikon | N25X-APO-MP | Objective |
| A1MP | Nikon | A1MP | Microscope |
| AnesII | Bio machinery | AnesII | Anesthesia delivery system |
| C2 plus | Nikon | C2 plus | Microscope |
| DECADRON phosphate injection | Aspen | 21N024 | Avoid cerebral edema |
| Dental drill | Jota | C1.HP.005 | Dental drill |
| Electric microinjector | NARISHIGE | IM-31 | Pressure injection system |
| Feathers | FEARGER | FA-10 | Shaving |
| G-CEM one adhesive enhancing primer | GC | 2110271 | Resin cement primer for dental adhesion |
| G-CEM ONE neo | GC | 43093 | Resin cement for dental adhesion |
| Glass capillary with filament | NARISHIGE | GDC-1 | Glass capillary |
| Image detector | Hamamatsu | H10770PA-40 | GaAsP photocathode photomultiplier tube |
| Imaging software | Nikon | NISelements | Imaging software |
| Isoflurane inhalation solution | Pfizer | 229KAR | Anesthetics |
| iXon EMCCD camera | Andor | iXon Life 888 | Image sensor |
| Ketamine | daiitisannkyou | s9-018506 | Anesthetics |
| Leica-M60 | Leica | M60 | Stereoscope |
| Linicon | Linicon | LV-125 | Vacuum pump |
| Mode-locked Ti:sapphire chameleon ultra II laser | Coherent | Chameleon Discovery NX | Femtosecond laser |
| Mos-cure | U-VIX | mini 365 | Portable LED UV Light Source |
| PEN bright | SHOFU INC. | PEN Bright | Dental light curing unit |
| Puller | SUTTER instaument | P-97 | Puller |
| Stereotaxic instrument (for Mice) | NARISHIGE | SR-6M-H | Stereotaxic instrument |
| Stereotaxic micromanipulator | NARISHIGE | SM-15R | Stereotaxic micromanipulator |
| Super-bond CATALYST V | SUN MEDICAL | 8070 | Dental adhesive resin cement |
| Super-bond dental adhesive monomer | SUN MEDICAL | 8071 | Dental adhesive monomer |
| Super-bond teeth color polymer powder | SUN MEDICAL | 145052000 | Teeth color polymer powder |
| Tarivid ophthalmic ointment 0.3% | Santen Pharmaceutical | TRN3952 | Eye ointment |
| UlTIMATE XL | NSK | Y141446 | Dental laboratory micromotor control unit |
| UV curing optical adhesives | THORLABS | NOA61 | UV curing optical adhesives |
| Xylazine | Bayer | KP0F2BK | Anesthetics |
