Method Article

A Fourier Transform Infrared Spectroscopy Technique to Study Peptide Self-Assembly

August 13th, 2025

In This Article

Abstract

Loading...
$$\rightleftharpoonup{xx}$$ $$\longleftharp{xx}$$, $$\longrightharp{xx}$$,

Source: Neves, R., et al. Synthesis and Characterization of 1,2-Dithiolane Modified Self-Assembling Peptides. J. Vis. Exp. (2018)

This video demonstrates the self-assembly of amyloid peptides into a beta sheet-rich supramolecular structure using Fourier transform infrared spectroscopy. An infrared beam is passed through a crystal with a high refractive index, and energy absorption across the interface of the crystal and the sample is recorded. The secondary structures of the sample proteins are identified by analyzing their characteristic absorption peaks at specific regions of the infrared spectrum, which aids in identifying the formation of the supramolecular assembly.
Protocol

Loading...
$$\rightleftharpoonup{xx}$$ $$\longleftharp{xx}$$, $$\longrightharp{xx}$$,

1. Characterization of Supramolecular Self-Assembly Structures

  1. Formation of Amyloid Fibers
    1. To prepare a self-assembly solution, weigh out 1 mg of the peptide powder using an analytical balance. Dissolve into a mixture (pH 7.5) of 20% acetonitrile and 10 mM (4-(2-hydroxyethyl)-1-piperazineethanesulfonic acid (HEPES) in a 1.5 mL microcentrifuge tube, to a final concentration of 1 mg/mL peptide assembly mixture. Vortex the assembly solution and leave it to assemble at room temperature.
  2. Spectroscopic Characterization of Amyloid Fibers
    1. Follow the peptide assembly process via Fourier-trans....

Access restricted. Please log in or start a trial to view this content.

Results

Loading...
$$\rightleftharpoonup{xx}$$ $$\longleftharp{xx}$$, $$\longrightharp{xx}$$,

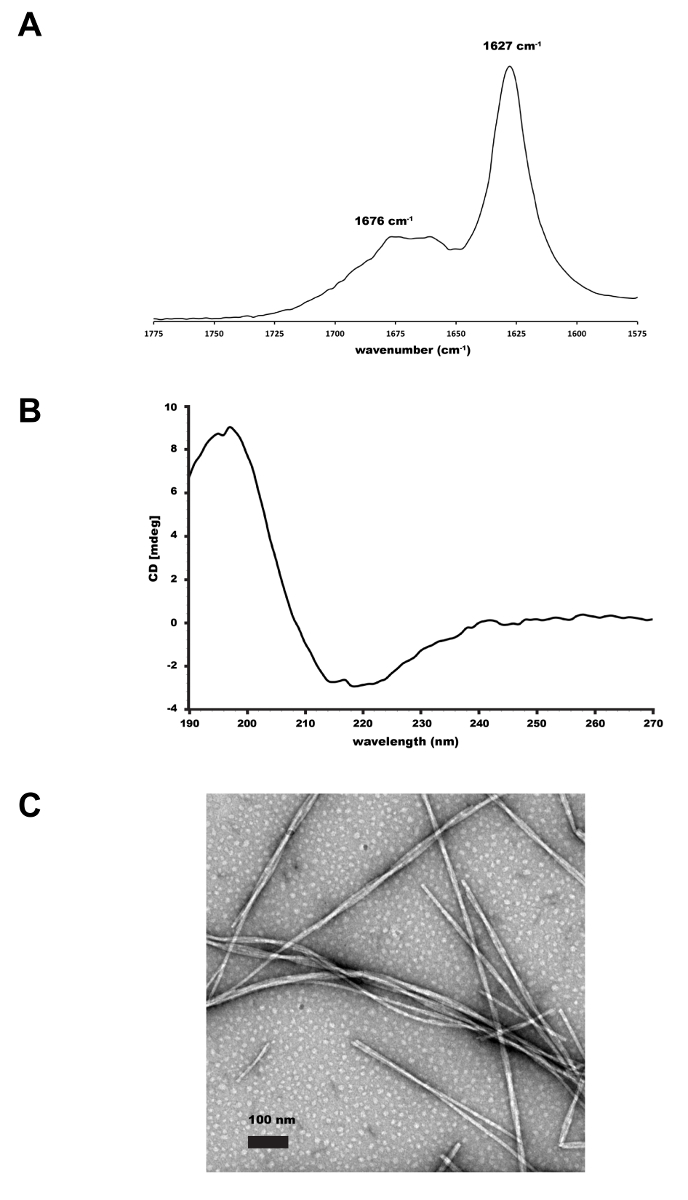
FTIR spectra 1627/1676 cm⁻¹ (A), CD spectrum 190-270 nm (B), TEM nanofibers 100 nm scale (C).
Figure 1. Supramolecular characterization of 1,2-dithiolane modified peptide. (A) FT-IR of 1 mg/mL 1,2-dithiolane-KLVFFAQ-NH2 fibers assembled in 10mM HEPES, pH 7.5 in 20% CH3CN. The peak at 1627 cm-1 is consistent with the peptide.......

Access restricted. Please log in or start a trial to view this content.

Disclosures

Loading...
$$\rightleftharpoonup{xx}$$ $$\longleftharp{xx}$$, $$\longrightharp{xx}$$,
No conflicts of interest declared.

Materials

List of materials used in this article
NameCompanyCatalog NumberComments
AcetonitrileFisher ScientificA998-4Flammable; irritating to eyes; Use personal protective equipment; Use only under a fume hood; keep away from open flame or hot surface; if contacted rinse wiith water for at least 15 minutes and obtain medical attention
4-(2-Hydroxyethyl)piperazine-1-ethanesulfonic acidAcros OrganicsAC172571000Do not inhale; use outdoors or in well-ventilated area
Fourier-Transform Infrared SpectrometerAlpha Tensor, Bruker

Reprints and Permissions

Request permission to reuse the text or figures of this JoVE article

Request Permission

Tags

Beta Sheet FormationATR CrystalInfrared Spectrum AnalysisEvanescent WaveWavenumber MeasurementAmyloid PeptidesSupramolecular StructureSecondary Structure Identification

Related Articles