Guidelines for computer based structural and functional characterization of protein using the I-TASSER pipeline is described. Starting from query protein sequence, 3D models are generated using multiple threading alignments and iterative structural assembly simulations. Functional inferences are thereafter drawn based on matches to proteins with known structure and functions.
Method Article
A Protocol for Computer-Based Protein Structure and Function Prediction
Opens in a new tab
In This Article
Summary
Loading...
$$\rightleftharpoonup{xx}$$
$$\longleftharp{xx}$$,
$$\longrightharp{xx}$$,
Abstract
Loading...
$$\rightleftharpoonup{xx}$$
$$\longleftharp{xx}$$,
$$\longrightharp{xx}$$,
Genome sequencing projects have ciphered millions of protein sequence, which require knowledge of their structure and function to improve the understanding of their biological role. Although experimental methods can provide detailed information for a small fraction of these proteins, computational modeling is needed for the majority of protein molecules which are experimentally uncharacterized. The I-TASSER server is an on-line workbench for high-resolution modeling of protein structure and function. Given a protein sequence, a typical output from the I-TASSER server includes secondary structure prediction, predicted solvent accessibility of each residue, homologous template proteins detected by threading and structure alignments, up to five full-length tertiary structural models, and structure-based functional annotations for enzyme classification, Gene Ontology terms and protein-ligand binding sites. All the predictions are tagged with a confidence score which tells how accurate the predictions are without knowing the experimental data. To facilitate the special requests of end users, the server provides channels to accept user-specified inter-residue distance and contact maps to interactively change the I-TASSER modeling; it also allows users to specify any proteins as template, or to exclude any template proteins during the structure assembly simulations. The structural information could be collected by the users based on experimental evidences or biological insights with the purpose of improving the quality of I-TASSER predictions. The server was evaluated as the best programs for protein structure and function predictions in the recent community-wide CASP experiments. There are currently >20,000 registered scientists from over 100 countries who are using the on-line I-TASSER server.
Protocol
Loading...
$$\rightleftharpoonup{xx}$$
$$\longleftharp{xx}$$,
$$\longrightharp{xx}$$,
Method overview
Following the sequence-to-structure-to-function paradigm, the I-TASSER procedure1-4 for structure and function modeling involves four consecutive steps of: (a) template identification by LOMETS5; (b) fragment structure reassembly by replica-exchange Monte Carlo simulations6; (c) atomic level structure refinement using REMO7 and FG-MD8; and (d) structure-based function interpretations using COFACTOR9.
Template identification: For a query sequence submitted by the user, the sequence is first threaded through a representative PDB structure library by a locally installed LOMETS meta-threading server. Threading is a sequence-structure alignment procedure used for identifying template proteins which may have similar structure or contain similar structural motif as the query protein. To increase the coverage of homologous template detections, LOMETS combines multiple state-of-the-art algorithms covering different threading methodologies. Since different threading programs have different scoring systems and alignment sensitivities, the quality of the generated threading alignments from each threading program is assessed by normalized Z-score, which is defined as:

where Z-score is the score in standard deviation units relative to the statistical mean of all alignments generated by the program; and Z0 is a program-specific Z-score cutoff determined based on large-scale threading benchmark tests5 to differentiate 'good' and 'bad' templates. A template with a high Z-score means that the top templates have an alignment score significantly higher than most of other templates, which usually implies that the alignment corresponds to a good model. If most of the top threading templates have high normalized Z-scores, the accuracy of the final I-TASSER model is usually high. However, if the protein is large and the coverage of the threading alignments is confined to a small region of the query protein, a high normalized Z-score does not necessarily mean a high modeling accuracy for the full-length model. Top two threading alignments from each threading program are collected and used for the next step of structure assembly.
Iterative structure assembly simulation: Following the threading procedure, query sequence is split into threading aligned and unaligned regions. Continuous fragments in threading alignment are excised from templates and used directly for the structure assembly, while the unaligned loop regions are built by ab initio modeling. The structure assembly procedure is performed on a lattice system guided by the replica exchange Monte Carlo simulations6. The I-TASSER force field includes hydrogen-bonding interactions10, knowledge-based statistical energy terms derived from known protein structures in the PDB11, sequence-based contact predictions from SVMSEQ12, and spatial restraints collected from LOMETS5 threading templates. The conformational decoys generated in the low-temperature replicas during the simulations are clustered by SPICKER13 to identify structures of low free-energy states. Cluster centroids of the top clusters are obtained by averaging the 3D coordinates of all clustered structural decoys and used for the final model generation. The simulation and clustering procedure are repeated twice for removing steric clashes and further refining the global topology.
Atomic-level model construction and refinement: The cluster centroids obtained after SPICKER clustering are reduced protein models (each residue represented by its Cα and side-chain center of mass) and have limited biological application. The construction of full-atomic model from the reduced models is done in two steps. In the first step, REMO7 is used to construct full-atomic models from C-alpha traces by optimizing the H-bond networks. In the second step, REMO full-atomic models are further refined by FG-MD14, which improves the backbone torsion angles, bond lengths, and side-chain rotamer orientations, by molecular dynamic simulations, as guided by the structural fragments searched from the PDB structures by TM-align. The FG-MD refined models are used as the final models for tertiary structure predictions by I-TASSER.
The quality of the generated models are estimated based on a confidence score (C-score), which is defined based on the Z-score of LOMETS threading alignments and the convergence of I-TASSER simulations, mathematically formulated as:

where M is the multiplicity of structure decoys in the structural clusters identified by the SPICKER13; Mtot is the total number of decoys submitted to the clustering; is the average RMSD of the clustered decoys to the cluster centroids; Norm.Z-Score(i) is the normalized Z-score (Eq. 1) of the top threading alignment obtained from ith threading server in LOMETS5; N is the number of servers used in LOMETS.
The C-score has a strong correlation with the quality of the I-TASSER models. By combining C-score and protein length, the accuracy of the first I-TASSER models can be estimated with an average error of 0.08 for the TM-score and 2 Å for the RMSD15. In general, models with C-score > - 1.5 are expected to have a correct fold. Here, RMSD and TM-score are both well known measures of topological similarity between the model and native structure. TM-score values range in [0, 1], where a higher score indicates a better structure match16,17. However for lower-ranked models (i.e. 2nd-5th models), the correlation of C-score with TM-score and RMSD is much weaker (~ 0.5), and cannot be used for reliable estimation of absolute model quality.
Is first model always the best model in I-TASSER simulations? The answer to this question depends on the target type. For easy targets, the first model is usually the best model and its C-score is usually much higher than the rest of the models. However, for hard targets, where threading does not have significant template hits, the first model is not necessarily the best model and I-TASSER actually has difficulty in selecting the best template and models. It is therefore recommended to analyze all the 5 models for hard targets and select them based on the experimental information and biological knowledge.
Function predictions: In the last step, final 3D-models generated from FG-MD are used to predict three aspects of protein function, namely: a) Enzyme Commission (EC) numbers18 and (b) Gene Ontology (GO)19 terms and (c) binding sites for small molecule ligands. For all the three aspects, functional interpretations are generated using COFACTOR, which is a new approach to predict protein's function based on global and local similarity to template proteins in PDB with known structure and functions. First, the global topology of the predicted models is matched against functional template libraries using structural alignment program TM-align20. Next, a set of proteins most similar to the target models are selected from the library based on their global structure similarity, and an extensive local search is performed to identify structure and sequence similarity near the active/binding site region. The resultant global and local similarity scores are used to rank the template proteins (functional homologues) and transfer the annotation (EC numbers and Gene Ontology19 terms) based on the top scoring hits. Similarly, ligand binding site residues and the ligand binding mode are inferred based on the local alignment of query with known ligand binding site residues in the top scoring function templates9.
The quality of function (EC and GO term) prediction in I-TASSER is evaluated based on functional homology score (Fh-score) which is a measure of global and local similarity between the query and template, and is defined as:

where C-score is an estimate of the quality of predicted model as defined in Eq. (2); TM-score measures the global structural similarity between the model and template proteins; RMSDali is the RMSD between the model and the template structure in the structurally aligned region from TM-align20; Cov represents the coverage of the structural alignment (i.e. the ratio of the structurally aligned residues divided by the query length); IDali is the sequence identity in the TM-align alignment. The estimated confidence score for EC number predictions also includes a term for evaluating active site match (AcM) between query and template within a defined local region, calculated as:

where Nt represents the number of template residues present within the local area, Nali is the number of the aligned query-template residue pairs, dii is the Cα distance between ith pair of aligned residues, d0 = 3.0 Å is the distance cutoff, Mii is the BLOSUM scores between ith pair of aligned residues. In general, the Fh-score is in the range [0, 5] and AcM score is between [0, 2], where higher scores indicating more confident functional assignments. AcM score is also used for evaluating the local structure and sequence similarity near the ligand-binding sites, which is referred to as BS-score.
1. Submission of protein sequence
- Visit the I-TASSER web page at http://zhanglab.ccmb.med.umich.edu/I-TASSER to start with structure and function modeling experiment.
- Copy and paste the amino acid sequence into the provided form or directly upload it from your computer by clicking the "Browse" button. I-TASSER server currently accepts sequences with up to 1500 residues. Proteins longer than 1500 residues are usually multi-domain proteins, and are recommended to be split into individual domains before submitting to I-TASSER.
- Provide your e-mail address (mandatory) and a name for the job (optional).
- Users can optionally specify external inter-residue contact/distance restraints, add-in an additional template or exclude some template proteins during the structure modeling process. Learn more about using these options in the "Discussion" section.
- To submit the sequence, click on the "Run I-TASSER" button. The browser will be directed to a confirmation page displaying user specified information, job identification (Job ID) number and a link to a webpage where the results will be deposited after completion of job. Users may bookmark this link or note down the job identification number for future reference.
2. Availability of results
- Check the status of your submitted job by visiting the I-TASSER queue page at http://zhanglab.ccmb.med.umich.edu/I-TASSER/queue.php. Click on the search tab and use the Job ID number or the query sequence to search your submitted job.
- After the structure and function modeling is finished, a notification e-mail containing image of the predicted structures and a web-link will be sent to you. Click on this link or open the link bookmarked at Step 1.5 to view and download the results.
3. Secondary structure and solvent accessibility predictions
- Check the FASTA formatted query sequence displayed on the top of the result page. If any additional restraint/template was specified during sequence submission, a link to the webpage displaying user-specified information can also be seen (Figure 1A).
- Examine the secondary structure prediction displayed as: alpha helix (H), beta strand (S) or coil (C) and confidence score of prediction (0 = low, 9 = high) for each residue. Look for region with long stretches of regular secondary structure (H or S) predictions, to estimate the core-region in the protein. Structural class of protein can also be analyzed based on distribution of secondary structures elements. Also, long regions of coil elements in the protein usually indicate unstructured/disordered regions.
- View the predicted solvent accessibility (Figure 1C) to ascertain buried and solvent exposed regions in the query. Values of predicted solvent accessibility range from 0 (buried residue) to 9 (exposed residue). Region containing mostly buried residues can be used to delineate the core region in the protein, while regions with solvent exposed and hydrophilic residues are potential hydration/functional sites.
4. Tertiary structure predictions
- Scroll down to view the predicted tertiary structures of query protein, displayed in an interactive Jmol applet (Figure 2). Left click on the applet to change the appearance of displayed structure, zoom into specific region, select specific residue types in the predicted model or calculate inter-residue distances.
- Analyze the models for the presence of long unstructured regions. These regions usually correspond to disordered regions in protein or indicate lack of template alignment. These regions generally have low modeling accuracy and removing these regions during modeling from N & C-terminus region will improve the modeling accuracy.
- Download the PDB formatted structure files of the model by clicking on the "Download Model" links. You can open these files in any molecular visualization software (e.g. Pymol, Rasmol etc.) for further analysis of the structural features.
- Analyze the confidence score (C-score) of structure modeling to estimate the quality of predicted structures. C-score (Eq. 2) values are typically in the range [-5, 2], wherein a higher score reflects a model of better quality. The estimated TM-score and RMSD of first model is shown as "Estimated accuracy of Model 1". For long proteins, it is recommended to evaluate the model quality based on TM-score, as TM-score is more sensitive to the topological changes than RMSD.
- Click on "more about C-score" link to analyze C-score, cluster size and cluster density of all the models. Estimated TM-score and RMSD are presented only for the first I-TASSER model, because C-score of lower ranked models is not strongly correlated with TM-score or RMSD. Quality of lower-ranked models can be partially assessed based on their cluster density and cluster size relative to the first model, wherein models from bigger cluster and higher density are on average closer to the native structure.
- Low C-score predictions usually indicate a low accuracy prediction. In most such cases, the query protein lacks a good template in the library and has a size beyond the range of ab initio modeling (i.e. >120 residues). In these cases, users can seek for additional spatial restraints and use them to improve the I-TASSER modeling (see Discussion section). It is also encouraged to submit the sequences to our QUARK server (http://zhanglab.ccmb.med.umich.edu/QUARK/) for a pure ab initio modeling if the protein size is below 200 residues.
5. LOMETS target template alignment
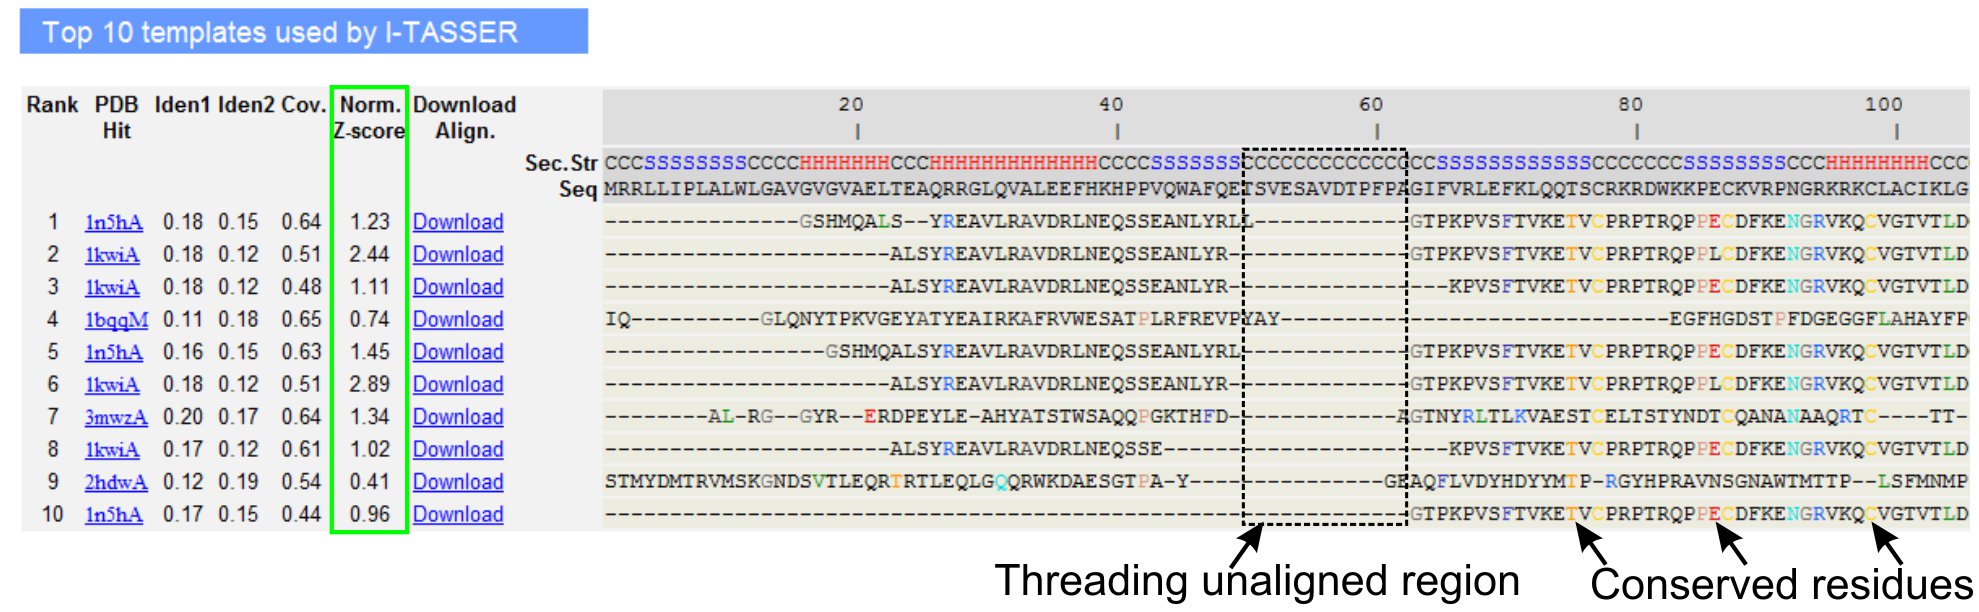
- Scroll down to analyze the top ten threading templates of the query protein, as identified by LOMETS threading programs (Figure 3). View the normalized Z-score (Eq. 1), shown in 'Norm. Z-score' column, to analyze the quality of threading alignments. Alignments with a normalized Z-score > 1 reflects a confident alignment and most likely have the same fold as the query protein.
- Analyze the sequence identity in the threading-aligned region (column 'Iden. 1') and for the whole chain (column 'Iden. 2') to assess the homology between the query and the template proteins. High sequence identity is an indicator of evolutionary relatedness between the query and template proteins.
- View the threading aligned residues shown in colored to visually identify conserved residues/motifs in the query and the template proteins. A higher sequence identity in threading-aligned region, compared to whole-chain alignment also indicates presence of conserved structural motif/domains in the query.
- Assess the coverage of the threading alignment by viewing the 'Cov.' column and inspecting the alignment. If the coverage of the top alignments is low and confined to only a small region of the query protein or absent for a long segment of query sequence, then the query protein usually contains more than one domain and it is recommended to split the sequence and model the domains individually (Figure 3).
- Download the PDB formatted sequence-structure alignment files by clicking on the "Download Align" links. These alignment file can be opened in any molecular visualization program listed in the Materials section, and can also be used for adding additional restraints during the structure modeling (Step 1.4).
6. Structural analogs in PDB
- View the next table (Figure 4) of the result page to determine the top ten structural analogs of the first predicted model, as identified by the structural alignment program TM-align20. A TM-score >0.5 indicates that the detected analog and model have a similar topology and can be used to determine the structural class/protein family of the query protein16, while those with TM-score <0.3 means a random structure similarity.
- Analyze the sequence identity and RMSD in the structurally aligned region shown in 'IDENa' and 'RMSDa' columns to assess the conservation of spatial motifs in the model and the structural analog. Visually inspect the colored and aligned residue pairs in the alignment to identify these structurally conserved residues and motifs.
- Click on the PDB code shown in the 'PDB Hit' column to visit RCSB website and learn more about their structural classification (SCOP, CATH and PFAM) and functional information (EC number, associated GO terms and bound ligand).
7. Function prediction using COFACTOR
- Scroll down in the result page to analyze functional interpretations for the query protein. Protein functions are enumerated in three context tables, displaying: Enzyme Commission (EC) numbers, Gene Ontology (GO) terms, and ligand binding sites.
- View the 'TM-score', 'RMSDa', 'IDENa' and 'Cov.' columns in each table to analyze parameters of global structure similarity and conservation of spatial patterns between model and identified functional homologues (templates).
8. Enzyme Commission number prediction
- View the top five potential enzyme homologues of query protein shown in the "Predicted EC numbers" table (Figure 5). The confidence level of EC number prediction using these templates is shown in 'EC-Score' column. Based on benchmarking analysis23, functional similarity (first 3 digits of EC number) between the query and template protein can be reliably interpreted using EC-score >1.1.
- Look for consensus of function (EC numbers) amongst the templates, which have the similar fold (i.e. TM-score >0.5) as the query protein. If multiple templates have same EC number and EC-score > 1.1, the confidence level of prediction is very high. However, if the EC-Score is high but there is a lack of consensus among the identified hits, then the prediction becomes less reliable and the users are recommended to consult the GO term predictions.
- Click on the link provided on the EC numbers to visit the ExPASy Enzyme database and analyze the function, including the reaction catalyzed, co-factor requirements and the metabolic pathway, of the template protein in detail.
9. Gene Ontology (GO) term predictions
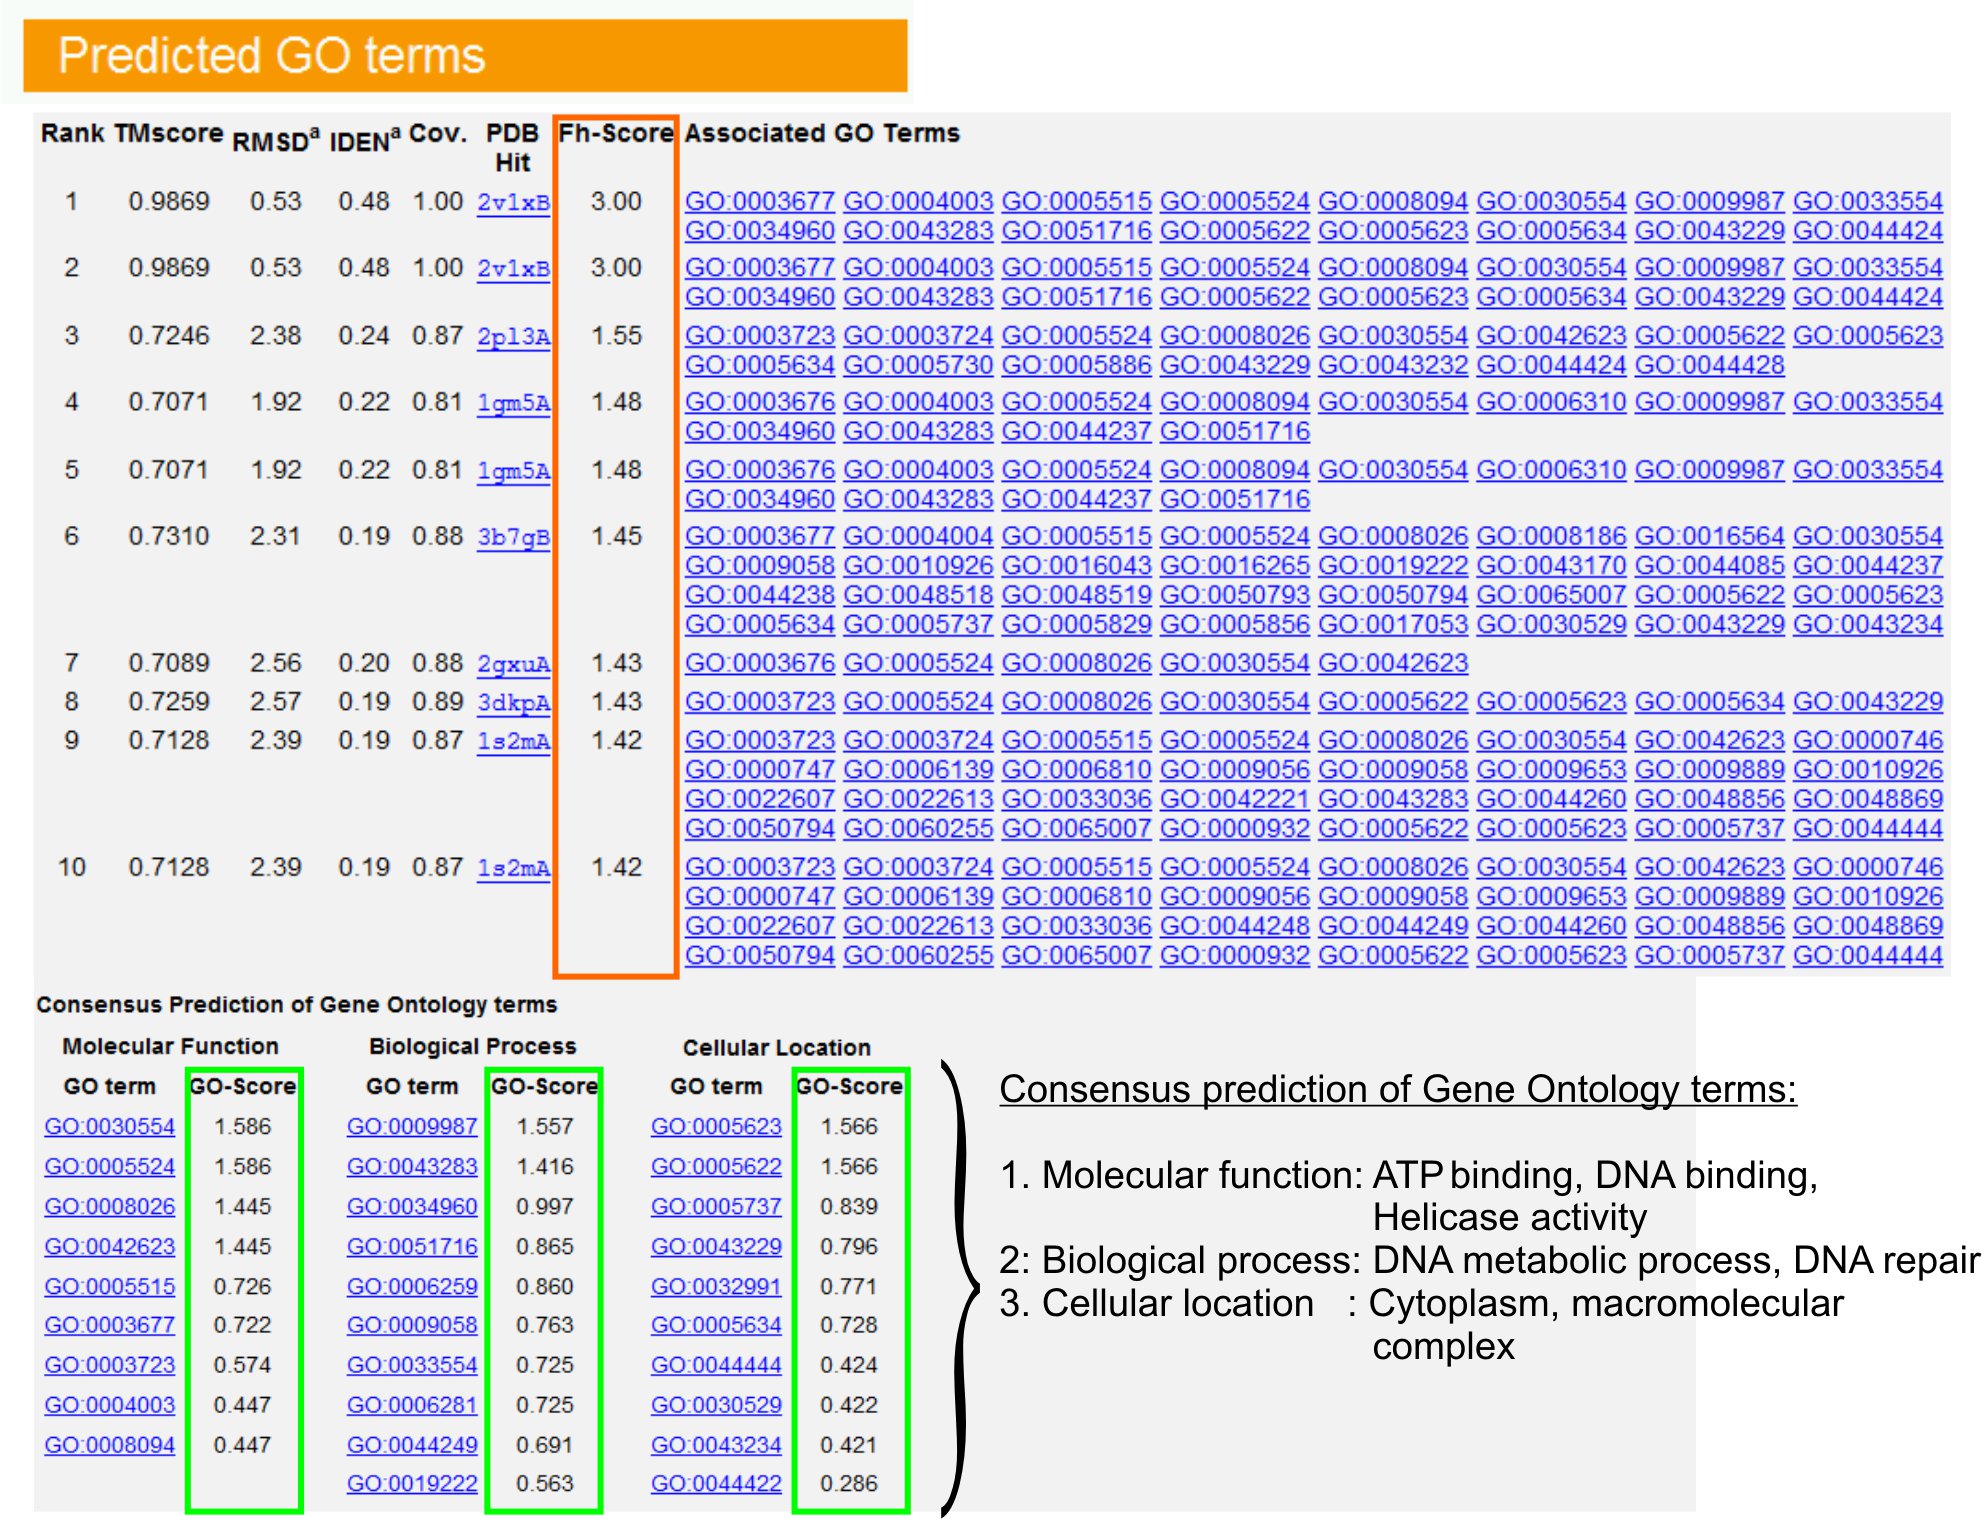
- View the "Predicted GO terms" table (Figure 6) to identify top ten homologues of query protein in the PDB library, annotated with Gene Ontology (GO) terms. Each protein is usually associated with multiple GO terms, describing its molecular functions (MF), biological processes (BP) and cellular component (CC). Click on each term to visit the Amigo website and analyze its definition and lineage.
- Analyze the Fh-score (Functional homology score) column to access the functional similarity between the query and template proteins and estimate the confidence level of transferring functional annotation from these proteins. In our benchmarking study23, 50% of the native GO terms could be correctly identified from the first identified template using an Fh-score cutoff of 0.8, with an overall accuracy of 56%.
- View the "Consensus prediction of GO terms" table to analyze the concurrence of function between the templates. These common functions are used for predicting the GO terms (MF, BP and CC) of the query protein and assess the confidence level (GO-score) of GO term predictions. Based on the benchmarking test23, the best false positive and false negative rates are obtained for predictions with GO-score cutoff=0.5, with decreasing coverage of prediction at deeper ontology levels.
10. Protein-ligand binding site predictions
- Scroll down to the bottom of the page to view top ten ligand binding site predictions for the query protein. Predicted binding sites are ranked based on the number of predicted ligand conformations that share common binding pocket. The best identified binding site is already displayed in the Jmol applet. Click on the radio buttons to analyze other predictions and visualize the ligand interacting residues.
- Analyze the BS-score column to evaluate local similarity between the model and template's binding site. Based on the benchmark9, BS-score > 1.1 indicates high sequence and structure similarity near the predicted binding site in model and known binding site in the template.
- Download the PDB formatted structure file of the complex by clicking on the "Download" link. Users can open these files in any molecular visualization program and interactively view the predicted binding site and ligand-protein interactions on their local computer.
11. Representative results

Figure 1. An excerpt of I-TASSER result page showing (A) FASTA formatted query sequence; (B) predicted secondary structure and associated confidence scores; and (C) predicted solvent accessibility of the residues. Analyzed core region and potential hydration site in the query are highlighted in cyan and red rectangles, respectively.

Figure 2. An example of I-TASSER result page showing tertiary structure predictions for the query proteins. The predicted models are displayed in an interactive Jmol applet, allowing the user to change the display of the molecule. The models can also be downloaded by clicking on the "Download" links. The confidence score to estimate the quality of the model is reported as C-score.

Figure 3. An example of I-TASSER result page showing top ten identified threading templates and alignments by LOMETS5 threading programs. The quality of the threading alignments is evaluated based on normalized Z-score (highlighted in green), where a value >1 reflects a confident alignment. Aligned residues in the template that are identical to the corresponding query residues are highlighted in color to indicate presence of conserved residue/motif, while a lack of alignment in most of the top templates indicates presence of multiple domains in the query protein and the unaligned residues correspond to domain linker regions. Click here to view the full-sized version of figure 3.

Figure 4. An example of result page showing top ten identified structural analogs and structural alignments, identified by TM-align20 structural alignment program. The ranking of the analogs shown in is based on the TM-score (highlighted in blue) of the structural alignment. A TM-score >0.5 indicates that the two compared structures have a similar topology, while a TM-score <0.3 means a similarity between two random structures. Structurally aligned residue pairs are highlighted in color based on their amino-acid property, while the unaligned regions are indicated by "-". Click here to view the full-sized version of figure 4.

Figure 5. An example of I-TASSER result page showing identified enzyme homologues of the query protein in the PDB library. The confidence level of EC number prediction is analyzed based on EC-score (highlighted in green), where EC-score > 1.1 indicates functional similarity (same first 3 digits of EC number) between query and template protein.

Figure 6. An example of I-TASSER result page showing GO term predictions for the query protein. Functional homologues for the query protein in the Gene Ontology template library are ranked based on their Fh-score (in orange rectangle). Common functional features from these top-scoring hits are derived to generate the final GO term predictions for the query protein. The quality of the predicted GO terms is estimated based on GO-score (shown in green), where a GO-score >0.5 indicates a reliable prediction. Click here to view the full-sized version of figure 6.

Figure 7. An example of I-TASSER result page showing top ten protein ligand binding site predictions using the COFACTOR9 algorithm. The ranking of the predicted binding sites is based on the number of predicted ligand conformations that share common binding pocket in the query. BS-score (highlighted in red) is a measure of local sequence and structure similarity between the predicted and template's binding site; and is useful for analyzing the conservation of binding site pockets.

Figure 8. An example of external restraint files used to for specifying residue-residue contact/distance restraints.

Figure 9. Example of restraint files used for specifying a template protein to the I-TASSER server. User can specify the query-template alignment either in (A) FASTA format; or (B) 3D format.

Figure 10. An example file used for excluding template during the I-TASSER structure modeling procedure. The first column contains the PDB ID of the template proteins to be excluded. The second column is used to specify the sequence identity cutoff which will be used for other similar templates in the template library.
Discussion
Loading...
$$\rightleftharpoonup{xx}$$
$$\longleftharp{xx}$$,
$$\longrightharp{xx}$$,
The protocol presented above is a general guideline for structure and function modeling using the I-TASSER server. Although, this automated procedure works very well for most of the proteins, human interventions often help to significantly improve the modeling accuracy, especially for the proteins which lack close templates in the PDB library. Users can intervene during the I-TASSER modeling in the following ways: (a) splitting of multi-domain proteins; (b) providing external restraints to improve the structure assembly; and (c) removing templates during the modeling.
Splitting multi-domain protein:
Many long protein sequences frequently contain multiple domains tethered by flexible linker regions, which makes their structure elucidation difficult using both experimental and computational techniques. Nevertheless, as domains are independently folding entities and can perform distinct molecular function; it is desirable to split long multi-domain proteins and model each domain separately. Modeling domains individually will not only speed up the prediction process, but also increases the quality of query-template alignment, resulting in more reliable structure and function predictions.
Domain boundaries in protein sequences can be predicted using freely available external online programs such as NCBI CDD24, PFAM25 or InterProScan26. Also, if LOMETS threading alignments are available for the query protein, domain boundaries can be located by visually identifying long stretches of unaligned residues in the top threading templates (see Step 5.4). These unaligned regions mostly correspond to domain linker regions. If multi-domain templates are already available in the template PDB library with all the query domains aligned, then the query protein can be modeled as full length.
Provide external restraints
The structure assembly simulations in I-TASSER are mainly guided by spatial restraints collected from the LOMETS threading templates. For query proteins that have good threading hit (Norm. Z-score > 1) in the template library, derived spatial restraints are mostly of high accuracy and I-TASSER will generate high resolution structural models for these proteins. Contrarily, for query proteins that have weak or no threading hit (Norm. Z-score < 1), collected spatial restraints often contain errors because of the uncertainty of the template and the alignment. For these protein targets, user-specified spatial information can be very helpful to improve the quality of the predicted model. Users can provide external restraints to the I-TASSER server in two ways:
A. Specify contact/distance restraints
Experimentally characterized inter-residue contacts/distances, for example from NMR or cross-linking experiments, can be specified by uploading a restraint file. An example file is shown in Figure 8, where Column 1 specifies the type of restraint, i.e. "DIST" or "CONTACT". For distance restraint (DIST), columns 2 and 4 contain residue positions (i, j), columns 3 and 5 contain the atom-types in the residue and column 6 specifies the distance between the two specified atoms. For contact restraints (CONTACT), columns 2 and 3 contain the positions (i, j) of residues which should be in contact. The distance between the side chains center of these contacting residue pairs is decided based on observed distances in known structures in PDB. I-TASSER will try to draw these atom pairs close to the specified distance during the structure refinement simulations.
B. Specify a protein structure template
LOMETS threading programs use a representative PDB library to find plausible folds for the query protein. Although using a representative structure library helps to reduce the time required to compute the sequence-structure alignments, it is possible that a good template protein is missed in the library or the template may not have been identified by LOMETS threading programs, even though it is present in the library. In these cases, the user should specify the desired protein structure as the template.
To specify protein structure as an additional template, users can either upload a PDB formatted structure file or specify the PDB ID of a deposited protein structure in PDB library. The I-TASSER will generate the query-template alignment using MUSTER program23 and will collect spatial restraints from both the user specified template and LOMETS templates to guide the structure assembly simulation. Because the accuracy of the LOMETS restraints is different for different targets, the weight of the LOMETS restraints is stronger in easy (homologous) targets than that in hard (non-homologous) targets, which have been systematically tuned in our benchmark training.
Users can also specify their own query-template alignments. The server accepts alignment in two formats: the FASTA format (Figure 9A) and the 3D format (Figure 9B). The FASTA format is standard and described at http://zhanglab. ccmb.med.umich.edu/FASTA/. The 3D format is similar to the standard PDB format (http://www.wwpdb.org/documentation/format32/sect9.html), but two additional columns derived from the templates are added to the ATOM records (see Figure 9B):
Columns 1-30: Atom (C-alpha only) and residue names for the query sequence.
Columns 31-54: Coordinates of C-alpha atoms of the query copied from the corresponding atoms in the template.
Columns 55-59: Corresponding residue number in the template based on alignment
Columns 60-64: Corresponding residue name in the template
Exclude templates proteins
Proteins are flexible molecules and can adopt multiple conformational states to change their biological activity. For example, structures of many protein kinases and membrane proteins have been solved in both active and inactive conformation. Also presence or absence of bound ligand can cause large structural movements. While all the conformational states of the template are alike for the threading programs, it is desirable to model the query using templates in only one particular state. A new option on the server allows the user to exclude template proteins during structure modeling. This feature would also allow the user to choose the homology level of templates to be used for the modeling. Users can exclude template proteins from the I-TASSER library by:
A. Specifying a sequence identity cutoff
Users can use this option to exclude homologous proteins from the I-TASSER template library. The homology level is set based on the sequence identity cutoff, i.e. the number of identical residue between the query and the template protein divided by the sequence length of the query sequence. For example, if the user types in "70%" in the provided form, all templates proteins which have a sequence identity >70% to the query protein I-will be excluded from the I-TASSER template library.
B. Exclude specific template proteins
Specific template proteins can be excluded from the I-TASSER template library by uploading a list containing PDB IDs of the structures to be excluded. An example file is shown in Figure 10. As the same protein can exist as multiple entries in the PDB library, I-TASSER server will by default exclude the specified templates (in Column1) as well as all other templates from the library that have an identity >90% to the specified templates. Users can also specify a different identity cutoff, e.g. 70%, where all templates with identity >70% to specified template proteins will be excluded.
Disclosures
Loading...
$$\rightleftharpoonup{xx}$$
$$\longleftharp{xx}$$,
$$\longrightharp{xx}$$,
No conflicts of interest declared.
Acknowledgements
Loading...
$$\rightleftharpoonup{xx}$$
$$\longleftharp{xx}$$,
$$\longrightharp{xx}$$,
The project is supported in part by Alfred P. Sloan Foundation, NSF Career Award (DBI 1027394), and the National Institute of General Medical Sciences (GM083107, GM084222).
Materials
| Name | Company | Catalog Number | Comments |
|---|---|---|---|
| Material Name | Type | Company | Catalogue Number |
| FASTA formatted amino acid sequence of the protein to be modeled (see, http://www.ncbi.nlm.nih.gov/BLAST/fasta.shtml). | |||
| A personal computer with access to the internet and a web browser. | |||
| Molecular visualizing software, e.g. RASMOL or PYMOL, for analyzing the predicted tertiary structure and functional sites. |
References
Loading...
$$\rightleftharpoonup{xx}$$
$$\longleftharp{xx}$$,
$$\longrightharp{xx}$$,
- Zhang, Y. Template-based modeling and free modeling by I-TASSER in CASP7. Proteins. 69, 108-117 (2007).
- Zhang, Y. I-TASSER: Fully automated protein structure prediction in CASP8. Proteins. 77, 100-113 (2009).
- Wu, S., Skolnick, J., Zhang, Y. Ab initio modeling of small proteins by iterative TASSER simulations. BMC Biol. 5, 17-17 (2007).
- Roy, A., Kucukural, A., Zhang, Y. I-TASSER: a unified platform for automated protein structure and function prediction. Nat Protoc. 5, 725-738 (2010).
- Wu, S., Zhang, Y. LOMETS: a local meta-threading-server for protein structure prediction. Nucleic Acids Res. 35, 3375-3382 (2007).
- Zhang, Y., Kihara, D., Skolnick, J. Local energy landscape flattening: parallel hyperbolic Monte Carlo sampling of protein folding. Proteins. 48, 192-201 (2002).
- Li, Y., Zhang, Y. REMO: A new protocol to refine full atomic protein models from C-alpha traces by optimizing hydrogen-bonding networks. Proteins. 76, 665-676 (2009).
- Zhang, J., Zhang, Y. High-resolution protein structure refinement using fragment guided molecular dynamics simulations. , (2011).
- Roy, A., Zhang, Y. COFACTOR: protein-ligand binding site predictions by global structure similarity match and local geometry refinement. , Forthcoming (2011).
- Zhang, Y., Hubner, I. A., Arakaki, A. K., Shakhnovich, E., Skolnick, J. On the origin and highly likely completeness of single-domain protein structures. Proc. Natl. Acad. Sci. U. S. A. 103, 2605-2610 (2006).
- Zhang, Y., Kolinski, A., Skolnick, J. TOUCHSTONE II: a new approach to ab initio protein structure prediction. Biophys. J. 85, 1145-1164 (2003).
- Wu, S., Zhang, Y. A comprehensive assessment of sequence-based and template-based methods for protein contact prediction. Bioinformatics. 24, 924-931 (2008).
- Zhang, Y., Skolnick, J. SPICKER: a clustering approach to identify near-native protein folds. J. Comput. Chem. 25, 865-871 (2004).
- Zhang, J., Zhang, Y. High-resolution protein structure refinement using fragment guided molecular dynamics simulations. , Forthcoming (2010).
- Zhang, Y. I-TASSER server for protein 3D structure prediction. BMC Bioinformatics. 9, 40-40 (2008).
- Xu, J., Zhang, Y. How significant is a protein structure similarity with TM-score = 0.5? Bioinformatics. 26, 889-895 (2010).
- Zhang, Y., Skolnick, J. Scoring function for automated assessment of protein structure template quality. Proteins. 57, 702-710 (2004).
- Barrett, A. J. Nomenclature Committee of the International Union of Biochemistry and Molecular Biology (NC-IUBMB). Enzyme Nomenclature. Recommendations 1992. Supplement 4: corrections and additions (1997). Eur J Biochem. 250, 1-6 (1997).
- Ashburner, M. Gene ontology: tool for the unification of biology. The Gene Ontology Consortium. Nat. Genet. 25, 25-29 (2000).
- Zhang, Y., Skolnick, J. TM-align: a protein structure alignment algorithm based on the TM-score. Nucleic. Acids. Res. 33, 2302-2309 (2005).
- Xu, D., Zhang, Y. RK Ab Intio Protein Structure Prediction. , Forthcoming (2011).
- Kim, D. E., Chivian, D., Baker, D. Protein structure prediction and analysis using the Robetta server. Nucleic. Acids. Res. 32, W526-W531 (2004).
- Roy, A., Mukherjee, S., Hefty, P. S., Zhang, Y. Inferring protein function by global and local similarity of structural analogs. , Forthcoming (2011).
- Marchler-Bauer, A., Bryant, S. H. CD-Search: protein domain annotations on the fly. Nucleic. Acids. Res. 32, W327-W331 (2004).
- Finn, R. D. The Pfam protein families database. Nucleic. Acids. Res. 38, D211-D222 (2010).
- Zdobnov, E. M., Apweiler, R. InterProScan--an integration platform for the signature-recognition methods in InterPro. Bioinformatics. 17, 847-848 (2001).
Reprints and Permissions
Request permission to reuse the text or figures of this JoVE article
Request Permission