A method to process human mammary surgical discard material is described. Processed tissue, in the form of organoids, can be stored frozen indefinitely or placed in culture for long-term growth. This method enables experimental examination of normal human epithelial cell biology, and the effects of exogenous perturbations.
Method Article
Processing of Human Reduction Mammoplasty and Mastectomy Tissues for Cell Culture
In This Article
Summary
Abstract
Experimental examination of normal human mammary epithelial cell (HMEC) behavior, and how normal cells acquire abnormal properties, can be facilitated by in vitro culture systems that more accurately model in vivo biology. The use of human derived material for studying cellular differentiation, aging, senescence, and immortalization is particularly advantageous given the many significant molecular differences in these properties between human and commonly utilized rodent cells1-2. Mammary cells present a convenient model system because large quantities of normal and abnormal tissues are available due to the frequency of reduction mammoplasty and mastectomy surgeries.
The mammary gland consists of a complex admixture of many distinct cell types, e.g., epithelial, adipose, mesenchymal, endothelial. The epithelial cells are responsible for the differentiated mammary function of lactation, and are also the origin of the vast majority of human breast cancers. We have developed methods to process mammary gland surgical discard tissues into pure epithelial components as well as mesenchymal cells3. The processed material can be stored frozen indefinitely, or initiated into primary culture. Surgical discard material is transported to the laboratory and manually dissected to enrich for epithelial containing tissue. Subsequent digestion of the dissected tissue using collagenase and hyaluronidase strips stromal material from the epithelia at the basement membrane. The resulting small pieces of the epithelial tree (organoids) can be separated from the digested stroma by sequential filtration on membranes of fixed pore size. Depending upon pore size, fractions can be obtained consisting of larger ductal/alveolar pieces, smaller alveolar clusters, or stromal cells. We have observed superior growth when cultures are initiated as organoids rather than as dissociated single cells. Placement of organoids in culture using low-stress inducing media supports long-term growth of normal HMEC with markers of multiple lineage types (myoepithelial, luminal, progenitor)4-5. Sufficient numbers of cells can be obtained from one individual's tissue to allow extensive experimental examination using standardized cell batches, as well as interrogation using high throughput modalities.
Cultured HMEC have been employed in a wide variety of studies examining the normal processes governing growth, differentiation, aging, and senescence, and how these normal processes are altered during immortal and malignant transformation4-15,16. The effects of growth in the presence of extracellular matrix material, other cell types, and/or 3D culture can be compared with growth on plastic5,15. Cultured HMEC, starting with normal cells, provide an experimentally tractable system to examine factors that may propel or prevent human aging and carcinogenesis.
Protocol
1. Tissue Processing and Digestion
- Obtain human mammary tissue as discard material from surgical procedures. Reduction mammoplasties can provide normal or benign cells; fibroadenomas and gynecomastias provide benign cells; non-tumor mastectomy tissues (peripheral or contralateral to a tumor, or subcutaneous) provide cells that may range from normal to benign to containing microtumors. Ensure proper IRB approval exists prior to obtaining the discard material. All material should be treated under bloodborne pathogen regulations.
- Place material in sterile containers containing buffer or media (e.g. 1:1 Dulbecco's Modified Eagle's Medium and Ham's F-12) supplemented with 100 U/ml penicillin, 100 μg/ml streptomycin, 5 μg/ml Fungizone, 50U/ml polymyxin B, and 10% Fetal Bovine Serum, and transport to laboratory at 4 °C. Reduction mammoplasty tissue can be stored or shipped at 4 °C for 72 hr without significantly affecting subsequent cell viability. Small pieces of non-reduction mammoplasty tissue may require more prompt processing.
- Separate the epithelial areas from the stromal matrix of adipose tissue, connective tissue and blood vessels using a combination of sterile scalpel, forceps and scissors. Cut pieces of tissue with scissors and place in a large glass sterile dish (e.g., 150 mm). Gently dissect out the epithelial areas, which appear as white strands embedded in the yellower stromal matrix, using the forceps to hold the material and the scalpel to scrape away the grossly fatty material. To facilitate digestion, cut the epithelial tissue into smaller pieces of ~3-4 mm using opposing scalpels and place into a 50 ml test tube. If large amounts of tissue are being processed, fresh scalpel blades may be needed. Remove fatty material from the dish for disposal according to institutional regulations.
- In heavily fibrous tissues (e.g., subcutaneous mastectomies with severe fibrocystic disease), there will be more solid white, non-epithelial material. It may be difficult to dissect out the epithelial cells from such fibrous matrices. Large pieces of fibrous material can be cut into smaller pieces that are ~1-3 mm square in area and digested separately.
- Place the dissected epithelial tissue into a conical centrifuge tube (50 ml or 15 ml) with the tissue comprising no greater than one third of the volume of the tube. Bring the tube up to full volume, leaving only a small air space to allow for mixing during rotation, using a tissue digestion mixture (DME/F-12 or equivalent, 10 μg/ml insulin, antibiotics as above, and final concentration of 10% FCS, 200 U/ml crude collagenase and 100 U/ml hyaluronidase.
- Place tubes on a HulaMixer tube rotator and rotate 360° at 8 rpm overnight at 37 °C.
- Centrifuge tubes at 600 x g for 5 min. Discard the supernatant fat and medium for disposal according to institutional regulations.
- Check for completion of digestion by diluting a small aliquot of the pellet in medium. Digestion is complete when microscopic examination shows clumps of cells (organoids) with smooth-appearing ductal, alveolar, or ductal-alveolar structures free from attached stroma (Figure 1A). Reduction mammoplasty tissues will usually still show attached stroma after an overnight digestion and will require additional digestion time.
- Resuspend the incompletely digested pellet in fresh tissue digestion mixture and re-incubate with rotation at 37 °C for another 4-12 hr. Repeat steps 1.6 and 1.7. If digestion is still incomplete, again add digestion mixture to the pellet and re-incubate with rotation at 37 °C overnight. The concentration of enzymes may be reduced to prevent over-digestion overnight.
- When digestion is complete, centrifuge tubes at 600 x g for 5 min, aspirate the digestion mix, resuspend pellet in medium plus antibiotics at approximately 15 ml/50 ml tube, 5 ml/15 ml tube.
2. Filtration and Freezing of Digested Material
- Transfer aliquots of the resuspended pellet onto a sterile 100 μm strainer over a sterile 50 ml tube. Let the medium drain into the tube, then rewash the organoids on top 1-2x times with 2-3 ml of medium. Repeat until all of the resuspended pellet has been transferred. If there are too many organoids on the filter and the medium no longer drains easily, use a new filter(s) for the remaining material. Carefully flip the filter(s) on top of another sterile tube and wash the organoids into the tube with more medium. This is the 100 μm organoid pool.
- Take the material that drained into the original 50 ml tube and repeat the process of 2.1 using a 40 μm strainer, to obtain the 40 μm organoid pool, which contains mostly alveolar structures. The material that drained into the tube constitutes the filtrate pool, which contains single/small clumps of mesenchymal and epithelial cells and small pieces of the vasculature.
- Pellet the 100 μm, 40 μm, and filtrate pools at 600 x g for 5 min.
- Aspirate the supernatant, reconstitute each tube in CPM II (DME/F-12 or equivalent with 44% FCS and 6% DMSO) using approximately 1 ml of CPMII per 0.1 ml of packed pellet. Keep at 4 °C.
- Seed a test dish for the 2 organoid pools by placing 0.1 ml of resuspended material into a 35 mm tissue culture plastic dish drop by drop as in 3.2 below. The filtrate pool can be directly seeded onto tissue culture plastic with fibroblast medium (DME/F-12 or equivalent with 10 μg/ml insulin and 10% FBS).
- Aliquot the remaining resuspended material into Nunc type freezing ampoules (1 ml/2 ml ampoule). Freeze overnight at -80 °C and then transfer promptly to storage in liquid nitrogen. We have not observed any significant loss of viability in our original ampoules stored frozen since the late 1970's.
3. Seeding Frozen Organoids and Subculture of Primary Cultures
- Quickly thaw the frozen ampoule containing the organoids in a 37 °C water bath. Seed the organoids into 2 to 10 (usually ~6) 60 mm dishes, or 1-3 100 mm dishes, depending upon visual estimation of the number of organoids in the ampoule. Approximately 20-40 organoids seeded per 60 mm dish is optimal.
- Thawed organoids are carefully placed, drop by drop, onto the dish surface with a 1 ml pipette or Pasteur pipette for an even distribution of organoids. Organoids placed close together will have limited space for outgrowth, giving rise to fewer cells for subculture or freezing. Avoid scratching the dish surface (cells tend not to grow past scratched surfaces). Wait 1-2 min to allow the organoids to attach and then slowly add growth medium to avoid dislodging the organoids (e.g. 2-3 ml/60 mm dish). Incubate at 37 °C in humidified CO2 incubator. These are the primary cultures. We currently use M87A+oxytocin(X) medium for the most robust HMEC growth (Figure 2).
- After 1 day, check that the organoids are attached. Add additional medium (e.g. 2-3 ml/60 mm dish). Cell migration from the organoids should be visible by 24-48 hr, and mitotic outgrowth by 48-72 hr after seeding (Figure 1B,C). Sometimes attachment is poor after 24 hr, particularly if plating overdigested organoids or organoids from older women, but most preparations will attach within 72 hr. Small pieces of the vasculature may attach and give rise to fibroblast cell outgrowth (Figure 1D).
- Feed cultures at least 3 times per week. Cells grown in M87A-type media grow to near confluence within 5-8 days, depending upon density of seeding.
- If there is significant fibroblast growth, Differential Trypsinization (DT), based on the rapid detachment of fibroblasts from the surface plastic, is needed to remove the fibroblasts. When the epithelial patches become large, aspirate media, wash dish (e.g., 1-2 ml/60 mm dish) with STE (saline, 0.05% trypsin, 0.02% EDTA), aspirate, add fresh 0.5 ml STE and leave at room temperature for around 1 min with continuous microscopic observation. When the fibroblasts detach but the epithelial cells are still adherent, gently but sharply knock the side of the dish against a hard surface to dislodge the fibroblasts and then quickly aspirate. Wash once with PBS, and aspirate again. Cultures heavily contaminated with fibroblasts may need an additional DT.
- Subculture primary cultures when large epithelial patches are present, but before confluence. The density of organoid seeding and attachment will influence the time required. To retain the primary culture and to generate multiple secondary cultures, spaced over time, we perform Partial Trypsinizations (PT).
- Aspirate media, wash a 60 mm dish with 1-2 ml STE, add 0.5 ml fresh STE to dish. Observe cell detachment under the microscope at room temperature for 1-5 min, with gentle knocking of the dish to promote cell detachment. Trypsinization should be stopped when ~50% of the cells have detached. Early PTs usually have rapid cell detachment. For later PTs, cells can be placed at 37 °C for faster detachment, with careful monitoring, as all the cells may come off quickly.
- Add 2 ml of serum-containing media to the dish, repipette to wash, and transfer to a sterile 15 ml tube. Repeat 2x with another ~1-2 ml media, adding the wash to the tube. Refeed the primary dish and return to incubator. Count the cells in the tube with the haemocytometer. PTs can be repeated around 4 to 8 times with good cell regrowth in the primary dishes and equivalent long-term growth from the subcultured or frozen secondaries (second passage cells are called secondaries; once subcultured, cells are no longer primaries). Once organoid material is no longer present in the primary cultures, subcultured secondaries show a decline in long-term population doubling potential.
-
- For subculture to secondaries, seed cells directly from the tube into dishes. Seeding of 1-2 x 10⁵ cells/100 mm dish in a robust medium such as M87A+X will lead to confluence in 4-7 days. We add cholera toxin to the medium at second passage to increase proliferative potential; cholera toxin is omitted in primary culture because it leads to multilayered cell outgrowth from the organoids.
- For freezing as secondaries, pellet tube at 600 x g for 5 min, and resuspend in CPMII with a final density of 106 cells/ml. Aliquot resuspended cells into Nunc type freezing ampoules, freeze overnight at -80 °C and then transfer promptly to storage in liquid nitrogen.
- It is recommended to freeze cells from the first PT for safekeeping, and use cells from the second PT for subculture. Additional PTs can be stored frozen for future use.
Results
Representative figures for tissues appropriately digested to organoids and placed in culture are shown in Figure 1. Incompletely digested tissue will show material still attached to the outside of these structures, and will likely have some fibroblastic cell growth in primary culture, requiring DT to remove. Overdigested tissue will show less smooth external borders, and may take longer to attach in primary culture. Epithelial outgrowth should begin within 48-72 hr (Figure 1B,C). Small pieces of vasculature (Figure 1D) can be a source of mesenchymal cell outgrowth. Epithelial outgrowths show morphologically heterogeneous populations, with proliferative populations that contain mixtures of cells with markers associated with myoepithelial, progenitor, and luminal lineages (Figure 1E, 3C-E). Growth in low stress media such as M87A supplemented with cholera toxin and oxytocin will support superior long-term growth of normal pre-stasis HMEC compared to previous media formulations (Figure 2). M87A-type media will also support growth of luminal and progenitor cells through passages 4-8 (Figures 3C-E, 4); thereafter, most cells show only myoepithelial lineage markers. HMEC cultured on plastic can retain their ability to form proper 3D self-organization in micropatterned 3D microwells, with luminal cells interior to myoepithelial cells (Figure 4A,B), and to form organized structures when plated in Matrigel (Figure 4C,D).
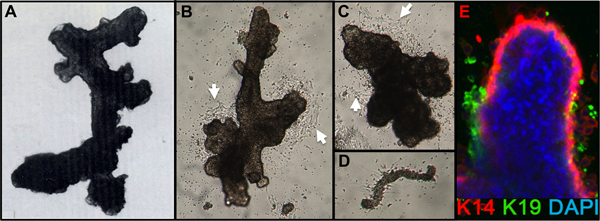
Figure 1. HMEC organoids and primary culture. (A) Organoid showing ductal-alveolar structure after digestion and filtration. (B,C) Organoids showing ductal and alveolar structure 2 days after placement in primary culture; note the beginning cell outgrowth (white arrows). (D) Small blood vessel attached and with starting fibroblast outgrowth from same cultures as B,C. (E) Epithelial cell outgrowth from primary organoid culture after 4 days. Lineages are identified by staining with antibodies to K14 (red) and K19 (green); nuclei were stained with DAPI (blue). Luminal (K14-/K19+, green), myoepithelial (K14+/K19-, red), and progenitor (K14+/K19+, yellow) cells are visible. Unstained cells are observed in the organoid core due to incomplete antibody penetration.
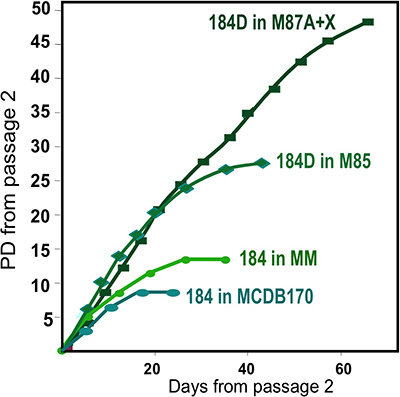
Figure 2. Growth of HMEC cultures in different media formulations. Organoids obtained from one individual, specimen 184, were initiated in primary culture using different media formulations. Best long-term growth is obtained using our most recent formulation, M87A+oxytocin(X)4. This medium also supports growth of multiple HMEC lineages (see Fig. 1E). An earlier media formulation, MM3 provided less robust growth, while a serum-free media, MCDB170 (commercial MEGM)17 leads to rapid induction of the cyclin kinase inhibitor p16INK4A and selection for aberrant cells7,11,13.
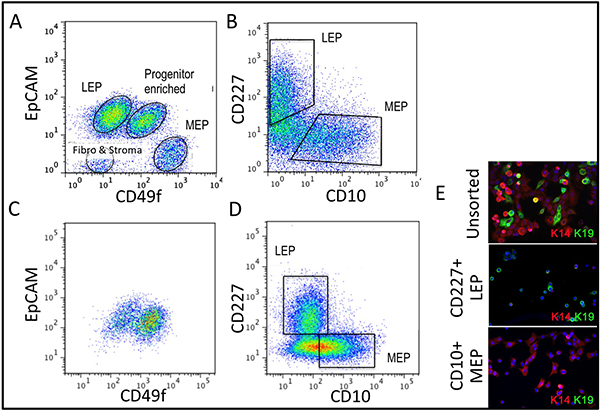
Figure 3. Comparison of lineage diversity in uncultured organoids and cultured HMEC at 4th passage. (A,B) FACS analysis of an uncultured, enzymatically dissociated organoid for (A) expression of EpCAM and CD49f/alpha 6 integrin, and (B) CD227/Muc1 and CD10/CALLA. (C,D) FACS analysis of 4th passage pre-stasis HMEC for expression of (C) EpCAM and CD49f/alpha 6 integrin, and (D) CD227/Muc1 and CD10/CALLA. Identifiable populations are labeled as LEP (expressing luminal markers EPCAM or CD227), MEP (expressing myoepithelial markers CD49f or CD10), or PROG (enriched in the CD49f+/EPCAM+ population). Note that during the adaptation to culture regulation of EpCAM and CD49f changes compared to uncultured organoids. (E) Unsorted HMEC and FACS-enriched LEP and MEP at 4th passage stained for immunofluorescence analysis of keratin K14 (MEP marker) and K19 (LEP marker) to verify lineage identification. Nuclei stained with DAPI appear blue.
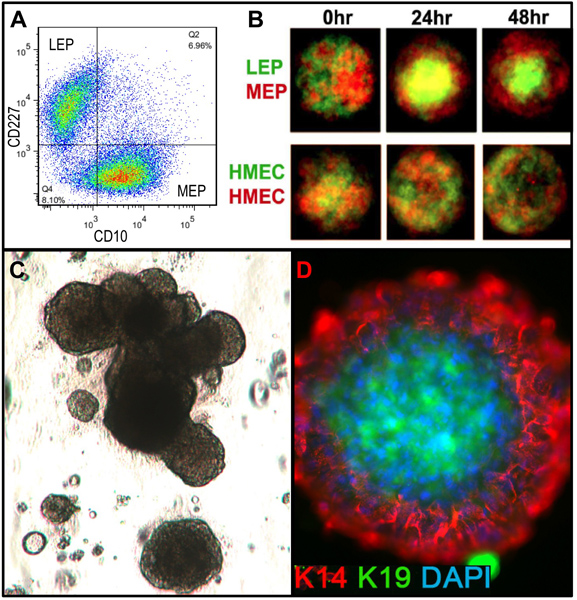
Figure 4. Cultured HMEC are capable of forming organized structures with in vivo-like lineage relationships when placed in appropriate microenvironments. (A) Pre-stasis 4th passage HMEC were FACS-enriched into luminal LEP and myoepithelial MEP lineages using markers for CD227 and CD10, with these lineages verified by expression of K14 and K19 (not shown). (B) When mixed together in micropatterned microwells, the cultured cells were capable of self-organization into bilayers with MEP on the outside and LEP internal [adapted from Chanson et al.5]. Fluorescently labeled LEP (green) and MEP (red) were imaged with a confocal microscope at 0 hr, 24 hr, and 48 hr after addition to the microwells (upper). Control HMEC were arbitrarily labeled with red or green fluorescent labels (lower). (C) Bright field image of FACS-enriched progenitor cells (cKit+) plated in 3D (Matrigel) culture and grown for 18 days. Resulting structures can exhibit alveolar morphogenesis. (D) Structures were extracted from Matrigel and stained to detect K14 and K19; nuclei were counterstained with DAPI. Immunofluorescent analysis shows organized structures with correct luminal and basal polarity.
Discussion
The human mammary tissue processing method presented here enables obtaining pure mammary epithelial cells from the heterogeneous admixture of cell types in the human breast. Filtration through pores of fixed size allows separation of different fractions of the mammary gland (e.g., ductal and ductal-alveolar vs. alveolar) from the digested stromal matrix. Isogenic mammary fibroblasts can be obtained to match the epithelial cells. Frozen digested material has retained good viability for over 30 years. This method has worked successfully on all but very fibrous mammary tissues, and is simple to perform. Other variations of mammary tissue processing exist that do not provide epithelial fractions that are as viable, clean, or separated. Placement of processed organoids in culture with low stress-inducing media such as M87A allows long-term growth of HMEC with multiple lineage markers. HMEC that have been cultured on plastic still retain the ability to generate 3D structures with normal in vivo-like lineage relationships. These HMEC cultures are suitable for extensive experimental investigation, including high throughput, of normal HMEC behavior and factors that may propel or inhibit senescence and transformation.
Disclosures
No conflicts of interest declared.
Acknowledgements
MAL, JCG, and MRS are supported by the NIA (R00AG033176 and R01AG040081) and by Laboratory Directed Research and Development, US Department of Energy contract# DE-AC02-05CH11231.
Materials
| Name | Company | Catalog Number | Comments |
|---|---|---|---|
| Glass Petri dish 15 cm | VWR | 89000-308 | |
| Scissors 6.5" | VWR | 82027-594 | |
| Forceps 8" | VWR | 82027-436 | |
| Scalpels disposable | Miltex | 4-411 | |
| Collagenase | SIGMA | C0130 | |
| Hyaluronidase | SIGMA | H3506 | |
| Insulin | SIGMA | I5500 | |
| DMSO | SIGMA | D8418 | |
| Pennicillin/Streptomycin | Life Technologies | 15140-122 | |
| Fungizone | Life Technologies | 15290-018 | |
| Polymixin B sulfate | Life Technologies | 21850-029 | |
| Fetal Bovine Serum | Life Technologies | 26140-087 | |
| Trypsin 0.05% 100 ml | Life Technologies | 25300-054 | |
| DMEM/F12 | Life Technologies | 11039-021 | |
| HulaMixer | Life Technologies | 159-20D | |
| Cell strainer 100 μm | BD Falcon | 352360 | |
| Cell strainer 40 μm | BD Falcon | 352340 | |
| Tubes 15 ml | Greiner bio-one | 188-261 | |
| Tubes 50 ml | Greiner bio-one | 227-261 | |
| TC dishes 10 cm | Greiner bio-one | 664-160 | |
| TC dishes 6 cm | Greiner bio-one | 628-160 | |
| Cryogenic vials | Nalgene | 5000-1020 | |
| Heamocytometer | Hauser Scientific | 1490 | |
| Centrifuge | Eppendorf model | 5702 |
References
- Prowse, K. R., Greider, C. W. Developmental and tissue-specific regulation of mouse telomerase and telomere length. Proc. Natl. Acad. Sci. U.S.A. 92, 4818-4822 (1995).
- Gil, J., Peters, G. Regulation of the INK4b-ARF-INK4a tumour suppressor locus: all for one or one for all. Nat. Rev. Mol. Cell Biol. 7, 667-677 (2006).
- Stampfer, M. R., Hallowes, R., Hackett, A. J. Growth of Normal Human Mammary Epithelial Cells in Culture. In Vitro. 16, 415-425 (1980).
- Garbe, J. C., Bhattacharya, S., Merchant, B., Bassett, E., Swisshelm, K., Feiler, H. S., Wyrobek, A. J., Stampfer, M. R. Molecular distinctions between the stasis and telomere attrition senescence barriers demonstrated by long-term culture of normal human mammary epithelial cells. Cancer Res. 69, 7557-7568 (2009).
- Chanson, L., Brownfield, D., Garbe, J. C., Kuhn, I., Stampfer, M. R., Bissell, M. J., LaBarge, M. A. Self-organization is a dynamic and lineage-intrinsic property of mammary epithelial cells. Proc. Natl. Acad. Sci. U.S.A. 108, 3264-3269 (2011).
- Stampfer, M. R., Bartley, J. C. Induction of transformation and continuous cell lines from normal human mammary epithelial cells after exposure to benzo(a)pyrene. Proc. Natl. Acad. Sci. U.S.A. 82, 2394-2398 (1985).
- Brenner, A. J., Stampfer, M. R., Aldaz, M. Increased p16 expression with first senescence arrest in human mammary epithelial cells and extended growth capacity with inactivation. Oncogene. 17, 199-205 (1998).
- Olsen, C. L., Gardie, B., Yaswen, P., Stampfer, M. R. Raf-1-induced growth arrest in human mammary epithelial cells is p16-independent and is overcome in immortal cells during conversion. Oncogene. 21, 6328-6339 (2002).
- Stampfer, M. R., Garbe, J., Nijjar, T., Wigington, D., Swisshelm, K., Yaswen, P. Loss of p53 function accelerates acquisition of telomerase activity in indefinite lifespan human mammary epithelial cell lines. Oncogene. 22, 5238-5251 (2003).
- Chin, K., Ortiz de Solorzano, C., Knowles, D., Jones, A., Chou, W., Rodriguez, E. G., Kuo, W. -L., Ljung, B. -M., Chew, K., Myambo, K., Miranda, M., Krig, S., Garbe, J., Stampfer, M., Yaswen, P., Gray, J. W., Lockett, S. J. In situ analysis of genome instability in breast cancer. Nat Gene. 36, 984-988 (2004).
- Li, Y., Pan, J., Li, J. -L., Lee, J. -H., Tunkey, C., Saraf, K., Garbe, J. C., Whitley, M. Z., Jelinsky, S. A., Stampfer, M. R., Haney, S. A. Transcriptional changes associated with breast cancer occur as normal human mammary epithelial cells overcome senescence barriers and become immortalized. Mol. Cancer. 6, (2007).
- Garbe, J. C., Holst, C. R., Bassett, E., Tlsty, T., Stampfer, M. R. Inactivation of p53 function in cultured human mammary epithelial cells turns the telomere-length dependent senescence barrier from agonescence into crisis. Cell Cycle. 6, 1927-1936 (2007).
- Novak, P., Jensen, T. J., Garbe, J. C., Stampfer, M. R., Futscher, B. W. Step-wise DNA methylation changes are linked to escape from defined proliferation barriers and mammary epithelial cell immortalization. Cancer Res. 69, 5251-5258 (2009).
- Vrba, L., Garbe, J. C., Stampfer, M. R., Futscher, B. W. Epigenetic regulation of normal human mammary cell type specific miRNAs. Genom Res. 21, 2026-2037 (2011).
- LaBarge, M. A., Nelson, C. M., Villadsen, R., Fridriksdottir, A., Ruth, J. R., Stampfer, M. R., Petersen, O. W., Bissell, M. J. Human mammary progenitor cell fate decisions are products of interactions with combinatorial microenvironments. Integr. Biol. 1, 70-79 (2009).
- Garbe, J. C., Pepin, F., Pelissier, F., Sputova, K., Fridriksdottir, A. J., Guo, D. E., Villadsen, R., Park, M., Petersen, O. W., Barowsky, A., Stampfer, M. R., Labarge, M. A. Accumulation of multipotent progenitors with a basal differentiation bias during aging of human mammary epithelia. Cancer Res. 72, 3687-3701 (2012).
- Hammond, S. L., Ham, R. G., Stampfer, M. R. Serum-free growth of human mammary epithelial cells: rapid clonal growth in defined medium and extended serial passage with pituitary extract. Proc. Natl. Acad. Sci. U.S.A. 81, 5435-5439 (1984).
Reprints and Permissions
