Fermentors are used to increase culture yield and productivity of bioengineered cells. After screening multiple microbial or animal cell culture candidates in shake flasks, the next logical step is to increase the selected culture’s biomass with the fermentor. This video demonstrates the setup and operation of a typical benchtop bioreactor system.
In This Article
Summary
Abstract
Fermentation systems are used to provide an optimal growth environment for many different types of cell cultures. The ability afforded by fermentors to carefully control temperature, pH, and dissolved oxygen concentrations in particular makes them essential to efficient large scale growth and expression of fermentation products. This video will briefly describe the advantages of the fermentor over the shake flask. It will also identify key components of a typical benchtop fermentation system and give basic instruction on setup of the vessel and calibration of its probes. The viewer will be familiarized with the sterilization process and shown how to inoculate the growth medium in the vessel with culture. Basic concepts of operation, sampling, and harvesting will also be demonstrated. Simple data analysis and system cleanup will also be discussed.
Introduction
Basic fermentation technology is an extension of the simple shake flask technique for growing cultures. It grew out of the desire to control growth environments for live cultures in a more complete and quantitative way. Batch culture shake flasks are usually limited by imprecise control of temperature. Temperature uniformity in an incubated shaker or warm room is highly variable, sometimes straying 5 °C or more from the intended setpoint. Since the shake flask is normally agitated at a fixed speed, oxygen uptake and gas exchange is limited. Once the available ambient oxygen is depleted, most cultures fail to thrive. There is no pH control in shake flasks. In many cases, if the culture is not limited by feed stock, it becomes acidic to the point of detriment to the culture and respiration slows dramatically. Most shake flask cultures are also run as a 'batch', which means that they are fed only once at or near the beginning of the cultures inoculation. After this initial carbon source is consumed, the culture stops growing. In some cases its metabolism may shift and begin to consume other metabolites in the culture broth, sometimes changing the characteristics of the resultant biomass or protein. Shake flasks are also usually subject to media evaporative loss in warmer culture environments, typically 10% of volume per 24 hr at 37 °C. This loss changes the density of the culture and prohibits longer term operation of the system. Finally, the user may encounter foaming from the media after agitation. The occurrence of foam in the headspace above the culture will limit gas exchange and further stifle growth.
The basic fermentation system is designed to address all of these limitations. Careful temperature control is achieved in fermentation vessels by the use of impeller agitation and a heating jacket. A sensor inserted into the vessel and feedback control of heating and cooling of this jacket usually results in temperature control ±0.1 °C around the setpoint. Benchtop fermentors generally provide control of pH via liquid reagent addition through a pump. The pH value is continuously monitored in an effort to keep the environment optimal for cell growth. Proper aeration is maintained by the aforementioned mixing impeller or by the infusion of air or oxygen supplemented gas directly into the culture. With shear-sensitive cultures, oxygen supplemented gas is the primary mechanism for maintenance of oxygen level in the culture. Measurement of oxygen in solution is usually achieved by a polarographic probe which is not normally available for use in shake flasks. It is also possible to continuously or periodically add feed to the vessel to maintain growth in a linear or exponential fashion. The exit gas condenser provides a cold surface for vapor in the exhaust gas flow to condense, thus preserving culture volume and density. Periodic addition of antifoam surfactant is actuated by a conductivity probe in the culture, reducing foam on the surface and allowing gas exchange.
The vessel, with all probes, fittings, impellers, harvest pipes, and tubes, is assembled and sterilized in a standard autoclave. After final probe calibrations and stabilization to operating environment, the culture is added to the vessel. The system can then be used to characterize the culture in a way that is more quantitative and precise than with a shake flask method. Tight control of temperature, pH, oxygen content, feed consumption, liquid evaporation, and foam levels all contribute to a much higher biomass and better protein yield.
Protocol
- Begin operation with vessel setup. A conventional fermentor has the following components that need to be installed (Figure 1):
- pH probe - for measurement of pH in the live culture. Calibrate probe before installation and sterilize with the vessel. Install probe in the headplate.
- pO2 probe - for measurement of dissolved oxygen content inside the vessel during fermentation. Install in the headplate.
- Harvest pipe for sampling the culture. Install this adjustable height component in the headplate.
- Gas sparger - resides at the bottom of the vessel and provides gas infusion to the culture. Hook sparger up to the gas source on the fermentor and mount in the headplate.
- Impeller shaft and impeller - the impeller stirs the culture and is critical for maintaining culture uniformity in the vessel.
- Exhaust gas condenser - for curbing evaporative loss in the vessel by cooling the exhaust gas path.
- Reagent pump lines for pH control or feed addition.
- Clean the vessel and headplate with soap and water. A soft brush is recommended for scrubbing the vessel and headplate. Bleach or cleaners with chlorine cannot be used to clean the vessel.
- If the media is not heat labile, add it to the clean vessel. Only add until maximum working volume is reached. In this instance, maximum working volume is 3.3 L for a 5 L total volume vessel.
- Mount the vessel headplate, ensuring that the o-ring seal is properly seated.
- Install the exhaust gas condenser.
- Install the antifoam probe into its 10 mm port.
- Install the harvest pipe into its 10 mm port. Put a piece of tubing on the top of it and clamp it off.
- Install tubing and a 0.20 μm filter on the sparge inlet and then clamp this off.
- Calibrate the pH probe:
- Gather 2 reference buffers in small beakers, a wash bottle, and a spare wash beaker.
- Hook the pH probe up to the fermentor and turn the fermentor on.
- Scroll to the pH parameter and using the menu button, scroll to the 'Cal' option, and press 'Enter'.
- Select '2' for 2 point calibration.
- Wash off the probe tip and submerge in the low reference buffer. The value on the fermentor will stabilize. Using the + and - keys, adjust the displayed value to match the value of the pH reference buffer. Once it stops blinking, press 'Enter'.
- Wash the probe off and insert it into the second reference buffer. Allow the value to stabilize and then use the keypad to make the displayed value match the high reference buffer value. Press 'Enter' to confirm.
- Wash the probe tip off and disconnect it from the fermentor. Put the protective cap on the connection and install it in the headplate.
- Open the pO2 probe tip and check to ensure that there is enough electrolyte to cover the tip. If not, add some to the reservoir and close it back up.
- Install the pO2 probe in the headplate and make sure that the autoclave cap is put on to protect its electrical connections. It will be calibrated after sterilization.
- Obtain a bottle for reagent feed with a dip tube and air filter. Add pump tubing to the dip tube port and attach the other end to the inlet port on the fermentor.
- Place tubing on all unused ports then clamp tubing off.
- Install a 0.45 μm filter on the exhaust gas condenser. This filter ensures that the vessel does not pressurize in the autoclave.
- Check that all tubes that go below the level of the media are clamped off to prevent media from coming out.
- Put the vessel in the autoclave for 25 - 30 min at 121 °C, liquid cycle. Caution: When it comes out it will be very hot.
- Install the vessel on the fermentor base.
- Hook up the pH probe cable.
- Attach the pO2 probe cable.
- Hook the sparger up to the gas addition rotameter.
- Sterilely add 1 M NaOH reagent to the bottle with the dip tube and install the pump head on the base pump head spindle.
- Put the temperature sensor in the thermowell on the headplate. Ensure that it goes all of the way to the bottom of the thermowell.
- Lower the agitation arm onto the vessels impeller coupling.
- Make sure that the fermentor is on.
- Check that water is available to the fermentor.
- Turn on the air supply to the fermentor.
- Scroll to the temperature parameter and set the temperature to 37 °C. Press the 'Enter' button to start the temperature control. The vessel will heat up in 15 min or less.
- Turn the gas flow to 1 vessel volume of media per minute or less. For this set up, gas flow is 3 L/min. Bubbles should appear at the bottom.
- Scroll to the agitation parameter and set to 300 rpm. Press 'Enter' to turn on the agitation.
- Once the temperature has reached 37 °C, scroll to the pH parameter and set it to 6.8. Turn the pH control on by pressing the 'Enter' button.
- Set agitation to the maximum speed of 1,000 rpm for the run.
- Ensure that the pO2 probe is polarized properly to display proper values. After 2 hr, scroll to the pO2 parameter and use the 'Menu' button to select the 'Calibrate Function' and select the 1 point calibration.
- After 15 min, use the cursors to set the value to 100 and press 'Enter.' This will calibrate pO2.
- Scroll to agitation and set to 300 rpm.
- Using the 'Menu' button, turn the 'Cascade' to 'on' in the agitation menu. This will increase the speed of agitation in an effort to chop up air bubbles and force more oxygen into solution as growth demand increases.
- Scroll to the pO2 parameter and set the value to 30. Press the 'Enter' button to start pO2.
- Start the control software package on the PC.
- Once the probes are calibrated, agitation is stable at 300 rpm, temperature is at 37 °C and pH is close to 6.8, it is time to inoculate. Using alcohol, sterilize the port that will be used for inoculation.
- Draw the inoculum into a syringe and add it into the sterilized port. Close the port.
- Mark the time of inoculation in a log book.
- It is also important to take a sample at sterilization time. Sterilize the end of the harvest pipe tube with alcohol.
- Open the clamp covering the harvest port and use a syringe to draw a sample. This first sample is usually discarded because it has been sitting in the pipe.
- Use another syringe to pull another sample.
- With a third syringe, push air back through the pipe to remove as much dead volume from the line and clamp the line off.
- Determine the cell density and pH and record the values. With microbial cultures, it is useful to log values every hour. Interval is culture dependent.
- Harvest methodology depends upon the intent for the culture after growth is completed. In this case, sample the culture a final time to receive endpoint values for cell density and possible pH or measurement of wet cell weight. Open the headplate disposed of the contents in a designated "kill tank" with bleach or other antimicrobial agents.
Results
The bioreactor can be run with or without the IRIS software. However to capture data, it is best to use the software. Before addition of bacteria, the pH and oxygen sensors must be calibrated, the impeller speed set and the temperature set. In Figure 2, the data output for a bioreactor run is presented. The temperature was set to 30 °C, the impeller speed at 200 rpm. The parameters may be different for each experiment but before addition of bacteria, the system should be at steady state. In Figure 3, the change in oxygen concentration with the addition of the bacterial culture is shown. The set-points for this experiment are 37 °C, stirrer at 200 rpm, O2 at 70%. At time 19:20, the feed pump delivers the bacterial seed culture at an OD of 0.1 causing an immediately drop in the O2 level. The bioreactor responds to the changing O2 level with an increase in the airflow and impeller speed. The set-points for the increases are set in the cascade (step 35). The reactor pH was monitored in real time, with the pH decreasing then increasing as demonstrated by the pH line fluctuation over time (Figure 4). The entire run can be analyzed and parameters adjusted for subsequent experiments.
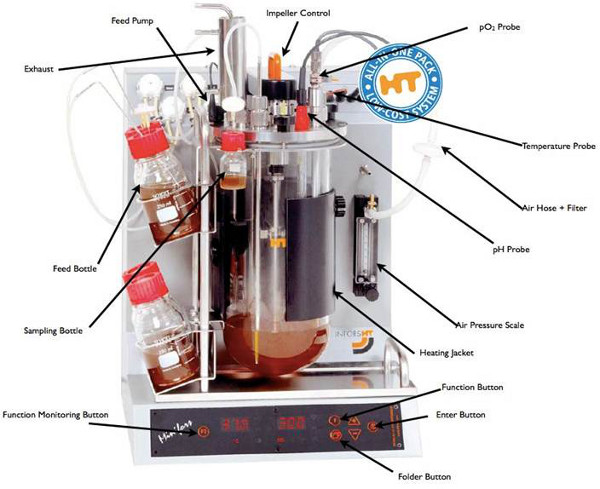
Figure 1. Benchtop bioreactor with all parts labeled and connected. This figure shows the stirred tank reactor at the beginning of a run. The parts of the reactor are labeled and include the sensors, impeller, temperature gauge, feed & sampling bottles, exhaust port, air pressure gauge, heating jacket, condenser tower, and control panel.
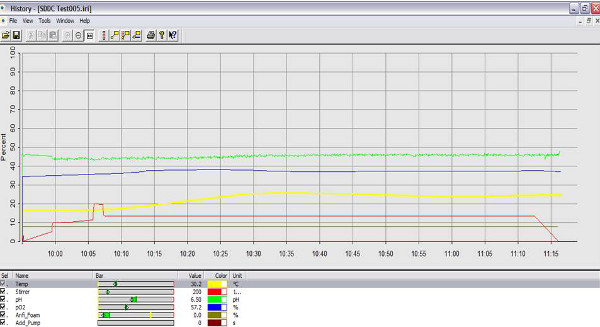
Figure 2. Screen image of bioreactor software at the beginning of run. At the start of a stirred tank run, the temperature was set at 30 °C (yellow line), impeller speed at 200 rpm (red line), pH at 6.5 (green line), and pO2 at 57.2% (blue line). Click here to view larger figure.
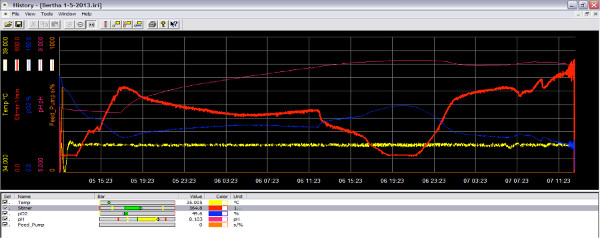
Figure 3. Screen image of bioreactor software during the run as oxygen decreases. When the culture is in active growth phase, it consumes oxygen and the amount of oxygen in the reactor is decreased (blue line). By increasing the impeller speed, more oxygen can be added to the culture (red line). Click here to view larger figure.
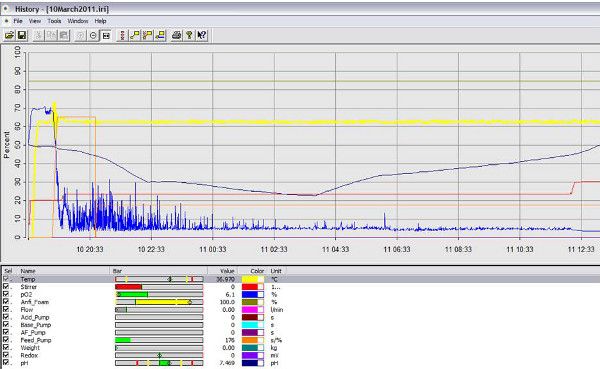
Figure 4. Screen image of bioreactor software showing pH change over time. The pH of the culture is monitored continuously and over time it decreases as lactic acid is produced and then increases as base is added to the bioreactor (blue line). Click here to view larger figure.
Discussion
Stirred tank bioreactors are the standard in the Biotechnology industry and have been used for over 40 years 1. The small stirred tank has been important for scale-up, scale-down, strain optimization, characterization, and process development. It may also have an important role in the development of individualized medicine 2. The small scale bioreactor is most similar to in situ conditions for cell growth because it can be monitored and optimized throughout a run. Most often, initial experiments are performed using shake flasks but the conditions in the small scale bioreactor differ significantly from the shake flask. In one experiment we found that the conditions for optimal growth of E. coli and production of Green Fluorescent Protein (GFP) in the shake flask did not translate to the stirred tank (unpublished data).
Other methods of growing cells in large scale include roller bottles, single use rocking platform bioreactors 3 and larger single use bioreactors with working volumes from 50 to 5,000 L. Each method provides challenges for scale-up, but has found a place in production. The single use rocking platform bioreactor is similar to the stirred tank, and provides a regulated environment. It differs from the stirred tank in that mixing occurs due a rocking motion to generate waves to prevent cell settling and provide oxygenation. The hydrodynamics for this method are different from the stirred tank and maximum volume is limited to 1,000 L. The differences can affect cell growth and product production. Other single use systems combine the stirred tank with the disposable reactor to, provide a platform with a minimum of infrastructure and associated overhead, and the capability for high-throughput bioprocessing 4.
New users of benchtop Bioreactors may have trouble determining initial setpoints for pH, pO2 and temperature; however, published research can be referenced for this information 5, 6, 7, 8, 9. With bacterial cultures in particular, it is recommended to start agitation at the same speed as the shaker flask and the temperature at the same setpoint. Culture pH from previous shake flasks runs can also be used as a starting point. Setting of the pO2 value is more difficult and is typically determined empirically. However, beginning with 50% pO2 is a recommended starting point.
Disclosures
Author A. Magno is an employee of ATR Biotech that produces reagents and instruments used in this article.
Acknowledgements
This project was support in part by Johns Hopkins University, Office of the Provost through the Gateway Science Initiative.
Materials
| Name | Company | Catalog Number | Comments |
|---|---|---|---|
| LB broth | Sigma | L3022 | |
| ampicillin | Sigma | A1593-25G | |
| LB broth | Sigma | L3022 | |
| antifoam 204 | Sigma | A8311 | |
| 1 M Sodium Hydroxide | Sigma | 38215-1EA-R | |
| Reference Buffer, pH 4.00 | Sigma | B5020 | |
| Reference Buffer, pH 7.00 | Sigma | B4770 | |
| pO2 probe electrolyte | Broadley James | AS-3140-C30-0025 | |
| 0.45 micron filter | Cole Parmer | EW-02915-22 | |
| 0.22 micron filter | Cole Parmer | EW-29950-40 | |
| Luer Lock syringe, 10 mL | Cole Parmer | EW-07940-12 | |
| Minifors Bioreactor | Infors HT | B-Pack 5.0 | |
| Air Admiral air pump | Cole Parmer | EW-79202-00 | |
| 1175 PD Chilling circulator | VWR | 13721-204 |
References
- Shuler, M., Kargi, F. Bioprocess Engineering Basic Concepts. , 2nd, Prentice Hall. Upper Saddle River, NJ. (2002).
- Hambor, J. Bioreactor Design and Bioprocess Controls for Industrialized Cell Processing. BioProcess International. 10 (6), 22-33 (2012).
- Wave [Internet]. , GE Life Sciences. Available from: http://www.gelifesciences.com/webapp/wcs/stores/servlet/catalog/en/GELifeSciences-US/brands/wave (2012).
- Xcellerex [Internet]. , GE Life Sciences. Available from: http://www.xcellerex.com/platform-xdr-single-use-bioreactors.htm (2012).
- Julien, C., Whitford, W. Bioreactor, Monitoring, Modeling and Simulation. BioProcess International. 5 (01), S10-S17 (2007).
- Fike, R. Nutrient Supplementation Strategies for Biopharmaceutical Production. Part 1: Identifying a Formulation. BioProcess International. 7 (11), 46-52 (2009).
- Jana, S., Deb, J. K. Strategies for efficient production of heterologous proteins in Escherichia coli. Appl Microbiol Biotechnol. 67, 289-298 (2005).
- Wang, Z., Ly, M., Zhang, F., Zhong, W., Suen, A., Hickey, A. M., Dordick, J. S., Linhardt, R. J. E. coli K5 fermentation and the preparation of heparosan, a bioengineered heparin precursor. Biotechnol. Bioeng. 107, 964-973 (2010).
- Baltz, R. H., Demain, A. L., Davies, J. E. Manual of Industrial Microbiology and Biotechnology. , 3rd, ASM Press. Washington DC. (2010).
- Bioreactors [Internet]. , Applied Technical Resources. Available from: http://www.atrbiotech.com/pdfs/bioreactors.pdf (2012).
- Infors, H. T. Minifors operating Manual and user guide. , Bottmingen, Switzerland. Forthcoming.
Reprints and Permissions
