Mast cell degranulation, the release of allergic mediators, is important in allergy, asthma, and parasite defense. Here we demonstrate techniques1 for assessing effects of drugs and toxicants on degranulation, methodology recently utilized to exhibit the powerful inhibitory effect of antibacterial agent triclosan2.
A subscription to JoVE is required to view this content. Sign in or start your free trial.
Method Article
A Microplate Assay to Assess Chemical Effects on RBL-2H3 Mast Cell Degranulation: Effects of Triclosan without Use of an Organic Solvent
* These authors contributed equally
In This Article
Summary
Abstract
Mast cells play important roles in allergic disease and immune defense against parasites. Once activated (e.g. by an allergen), they degranulate, a process that results in the exocytosis of allergic mediators. Modulation of mast cell degranulation by drugs and toxicants may have positive or adverse effects on human health. Mast cell function has been dissected in detail with the use of rat basophilic leukemia mast cells (RBL-2H3), a widely accepted model of human mucosal mast cells3-5. Mast cell granule component and the allergic mediator β-hexosaminidase, which is released linearly in tandem with histamine from mast cells6, can easily and reliably be measured through reaction with a fluorogenic substrate, yielding measurable fluorescence intensity in a microplate assay that is amenable to high-throughput studies1. Originally published by Naal et al.1, we have adapted this degranulation assay for the screening of drugs and toxicants and demonstrate its use here.
Triclosan is a broad-spectrum antibacterial agent that is present in many consumer products and has been found to be a therapeutic aid in human allergic skin disease7-11, although the mechanism for this effect is unknown. Here we demonstrate an assay for the effect of triclosan on mast cell degranulation. We recently showed that triclosan strongly affects mast cell function2. In an effort to avoid use of an organic solvent, triclosan is dissolved directly into aqueous buffer with heat and stirring, and resultant concentration is confirmed using UV-Vis spectrophotometry (using ε280 = 4,200 L/M/cm)12. This protocol has the potential to be used with a variety of chemicals to determine their effects on mast cell degranulation, and more broadly, their allergic potential.
Introduction
Mast cells are highly granulated immune effector cells that serve as key mediators in asthma, allergies, parasite defense and carcinogenesis13-16. They reside in nearly every vascularized tissue15, where they safely store allergic and inflammatory mediators in cytoplasmic granules until activated to degranulate. Degranulation is the exocytosis of membrane-bound granules, which results in the release of pharmacologically active mediators such as histamine, tryptase, and leukotrienes15. This process results in the initiation of type I hypersensitivity reactions that are critical in mounting defense against parasites as well as initiating allergic, asthmatic, and carcinogenic responses15.
Mast cells and basophils express FcεRI receptors, the high-affinity receptors for immunoglobulin E (IgE)17. Exposure to an allergen or antigen causes aggregation of multiple IgE-bound FcεRI receptors17, and it is this so-called "crosslinking" of IgE-bound Fc receptors that initiates the degranulation process: a cascade of tyrosine phosphorylation events, the activation of phospholipase C, efflux of calcium from internal stores, and influx of calcium into the cell18. This calcium influx is necessary for degranulation, and, further, signals granule fusion with the membrane before causing granule exocytosis15. Experimentally, a calcium ionophore can be used to shuttle calcium directly across the cell membrane19, which essentially bypasses all signal transduction steps prior to the calcium influx step20, allowing for the identification of a pathway target by a toxicant as being upstream or downstream of calcium signaling20.
Degranulation can be measured rapidly and effectively by monitoring the release of β-hexosaminidase into cell supernatant, which is released linearly from the granules alongside histamine6, but is much easier to detect using a simple enzyme-substrate reaction and a microplate reader to assay the fluorescent product. This microplate assay, as detailed in the protocol section, is based upon a robust method originally developed by Naal et al.1, which quantifies the cleavage of the fluorogenic substrate 4-methylumbelliferyl-N-acetyl-β-D-glucosaminide by β-hexosaminidase. We have modified the assay to test effects of drugs and toxicants, with triclosan highlighted here. This method reliably quantifies degranulation, is an inexpensive alternative to, for example, flow cytometric-based detection methods21, and has the potential to lend itself nicely to high-throughput screening of a wide variety of anti-allergy drugs, as well as immunotoxic or allergenic chemicals. This last point is particularly important in light of the 2007 National Research Council report "Toxicity Testing in the 21st Century: A Vision and a Strategy" (http://www.nap.edu/openbook.php?record_id=11970), which advocates for the development of high-throughput toxicology tests that utilize cell culture to reduce the costly use of traditional lab animals such as mice. The degranulation protocol developed by Naal et al.1 and modified by us2, utilizes the RBL-2H3 cell line, which is a well-accepted model homologous to human mucosal mast cells or basophils3-5. (Methods for culturing RBL-2H3 cells are detailed in Hutchinson et al.22). This assay could likely be adapted to any attached mast cell type.
Triclosan (TCS) is a broad-spectrum antimicrobial that has been used for more than 30 years in hospitals, personal care products, and consumer goods23,24. The mode of action for TCS’s antimicrobial characteristic is the inhibition of fatty-acid biosynthesis, likely by inhibiting enoyl-acyl carrier protein reductase25,26. It is found worldwide in a wide range of consumer products such as shower gel, hand lotion, toothpaste, mouthwash, and in hand soaps at concentrations up to 0.3% or 10 mM24. Widespread use of TCS has resulted in detectable levels in humans27-29 and in rivers and streams30. A study done by Allmyr et al.27 demonstrated that TCS and its metabolites are present in both the plasma and milk from nursing mothers. Importantly, TCS is readily absorbed into the skin31-37. Queckenberg et al.37 found ~10% absorption of an ~70 mM TCS cream into human skin within 12 hr, resulting in significant concentration in the skin, where mast cells reside.
TCS has been shown clinically to manage human allergic skin disease7-11, but the mechanism by which TCS alleviates allergic skin diseases has been unknown38. Using the fluorescent microplate assay detailed in this video, we recently demonstrated that TCS, at concentrations as low as 2 μM, significantly dampens mast cell function and degranulation, providing a potential explanation for these clinical data2. In addition to providing an explanation for these clinical data, our findings in Palmer et al.2 suggest that TCS targets signaling molecules downstream of calcium influx. Due to the importance of calcium signaling in many immunological and other biological processes, TCS could potentially have adverse effects on a wide variety of necessary biological processes. In fact, Udoji et al.39 showed that TCS suppresses human natural killer cell lytic activity, another important innate immune function.
Beyond its potential as a therapeutic aid in allergic skin disease (or, conversely, as an immunotoxicant), TCS may also be an endocrine disruptor40-49. Thus, a clear procedure on how to prepare this chemical in solution is of interest to toxicologists. Because TCS is a small hydrophobic molecule, organic vehicles are often used to make it more soluble in water. In most toxicity studies where TCS has been tested, preparation has involved dissolution in water with the aid of an organic solvent such as ethanol, acetone, or oil2,50,51. However, often times these solvents are biologically active themselves, thereby complicating interpretation of the test chemical data51. In fact, according to Rufli et al.52 and others53, it is recommended that test solutions for aquatic toxicity experiments are prepared using physical methods over chemical methods, due to the potential of chemical solvents to create toxicity artifacts. We have previously shown that TCS dissolved in 0.24% ethanol/water (vol/vol) and sonicated for 30 min dampens RBL mast cell degranulation2. Ethanol at higher concentrations than 0.24% has been shown to dampen mast cell degranulation54,55 -examples of the potentially confounding effects of organic solvents on toxicity studies.
Not only is it important to consider the effect of solvents on the organism or cells used for study, but also it is important to monitor the effect of a solvent on the test chemical itself. For example, Skaare et al.51 found that dissolving TCS in polyethylene glycol (commonly found in toothpastes and mouthwash) weakened anti-bacterial and anti-plaque effects in healthy female women while dissolution in oils caused a complete loss of function. Therefore, the ability of different solvents to modulate toxicant and drug, including TCS, effects should be considered in assay design. Use of oils or flavor additives may interfere with the effects of TCS in various products50,51.
In an effort to eliminate the need to use organic solvents, we improved upon our method for dissolving TCS2 by eliminating the use of an organic solvent. In the present protocol, we dissolve TCS granules directly into aqueous buffer with heat (≤50 °C), and then verify the concentration of this TCS stock by UV-Vis spectrophotometry. These improvements are possible because TCS is soluble in water up to 40 µM (http://www.epa.gov/oppsrrd1/REDs/2340red.pdf) and has been shown to resist degradation when heated to 50 °C (http://oehha.ca.gov/prop65/public_meetings/052909coms/triclosan/ciba3.pdf)56,57. We also have the added benefit of UV-Vis spectrophotometry, as TCS also is known to strongly absorb at 280 nm58 with a molar extinction coefficient of 4,200 L/mol/cm12.
This protocol provides a simple, yet effective way to dissolve TCS granules into a buffer without the aid of an organic solvent, including low cost and rapid verification of concentration, and describes a powerful fluorescent microplate assay for monitoring chemical effects on mast cell degranulation.
Access restricted. Please log in or start a trial to view this content.
Protocol
Note that all buffer recipes are included in a table at the end of the protocol text.
DAY 1:
1. Preparation of Cells
- Plan out 96-well plate setup scheme, centering test samples on the layout in order to avoid edge effects. Allocate three replicates for each TCS concentration tested (± degranulation stimulant of antigen or ionophore), as well as triplicates for spontaneous release (no degranulation stimulant), maximum release (0.2% Triton X-100 [TX] detergent lysis), as well as wells reserved for background samples (which will contain no cells). For each replicate experimental day, choose a new randomized layout of the TCS sample concentrations.
- Warm RBL media (recipe provided in table) and trypsin in 37 °C water bath.
- Check RBL cells in T-25 flask (2-4 days since last passage and less than 3-4 months since they were thawed) for general signs of good health: proper pH indicated by color of media, and lack of cloudiness. Place the flask under a light microscope to confirm that the flask is free of contamination and that the cells appear healthy, properly confluent, and mostly attached. Note that cells should be checked for mycoplasma contamination approximately every six weeks22.
| Treatment | Triplicates |
| Stimulated, 0 µM TCS | A7, B7, C7, F4, G4, H4 |
| Stimulated, 0.001 µM TCS | F6, G6, H6 |
| Stimulated, 0.1 µM TCS | A4, B4, C4 |
| Stimulated, 1 µM TCS | A6, B6, C6 |
| Stimulated, 5 µM TCS | F5, G5, H5 |
| Stimulated, 10 µM TCS | A3, B3, C3 |
| Stimulated, 15 µM TCS | A5, B5, C5 |
| Stimulated, 20 µM TCS | F7, G7, H7 |
| Stimulated, plus highest [TCS] | F3, G3, H3 |
| Spontaneous, No TCS (includes mocks) | A10, A11, A12, B10, B11, B12 A1, A2, A8, B1, B2, B8, C1, C2, C8, F1, F2, F8, G1, G2, G8, H1, H2, H8 |
| TX-100, No TCS | D10, D11, D12, E10, E11, E12 |
| No Cells, Background, plus highest [TCS] | G10, G11, G12, H10, H11, H12 |
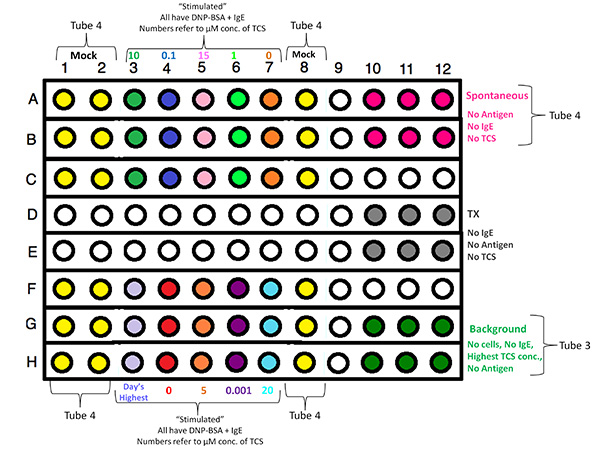
Click here to view larger image.
- Take the RBL cell flask into the sterile tissue culture (TC) hood. The cells are attached to the bottom of the flask. Working under the TC hood and using standard sterile technique, remove all media from flask with sterile pipette; the cells remain attached to the bottom of the flask. Next, rinse flask with 2 ml trypsin, then discard this wash.
- Add exactly 2 ml trypsin to cover bottom of the flask. Put into 37 °C incubator for 5 min to allow the cells to detach from the bottom of the flask.
- After 5 min, hit the side of the flask with an open palm to loosen cells. Immediately, add 18 ml RBL media to wash cells off the flask and to quench the trypsin. Immediately take the cell-media-trypsin mixture out of the flask and transfer to a new, sterile 50 ml tube (the total volume in this tube is now 20 ml).
- After mixing gently but thoroughly, remove 50 µl of cell suspension from this tube, and transfer to a 1.5 ml sterile microcentrifuge tube, which is a sample to be counted. Take this sample, as well as the 50 ml tube containing the cell-media-trypsin mixture out of the TC hood to the benchtop.
- Spin the 50 ml tube in centrifuge (with appropriate balance) for 8 min at 500 x g; this force pellets cells effectively.
- During the spin time, count the cells in the sample that were isolated before spinning. To do this, first add 50 µl of trypan blue dye to 50 µl of cells in 1.5 ml tube, and gently but thoroughly pipette up and down 5x to mix. Immediately, transfer 10 µl of this mixture to the glass hematocytometer, and count cells in the grid area following manufacturer instructions. Count at least 100 cells for reasonable statistical results.
- Back in the TC hood, remove supernatant from cells that were spun down.
- Cap the cell tube, and flick pellet at the bottom of the tube to loosen cells.
- Add media to trypsinized cells to yield a density of 0.5 x 10⁶ cells/ml, based on the cell count.
- Mix well but gently to keep cells suspended during the plating procedure. Using a Pipetman, put 100 µl cells/well in a 96-well plate (flat, black bottom), following the plate template sheet. Randomize how cells are added to wells to avoid systematic error, and mix after each set of three wells is added. Be sure not to put cells into the wells labeled for the background samples.
- Once all cells have been transferred, place the plate lid onto the plate, and transfer to the incubator (37 °C/5% CO2) overnight. Clean up following standard sterile technique.
DAY 2:
2. Preparation of Triclosan
- Using a graduated cylinder, measure 250 ml Tyrodes Buffer (recipe provided in table) into a 500 ml Erlenmeyer flask labeled "TCS-buffer." Add stir bar. Use glassware, stir bar, thermometer designated for use with TCS only.
- Also at this time, measure 250 ml Tyrodes into a separate 500 mL Erlenmeyer flask, labeled "control buffer." Use glassware, stir bar, thermometer that are NOT designated for TCS. Add stir bar.
- Weigh out 0.0022 g of TCS granules and transfer to "TCS-buffer" flask (which contains 250 ml Tyrodes Buffer). In order to efficiently transfer granules to Erlenmeyer flask, use 10 ml from the measured 250 ml Tyrodes to wash off weigh boat, making sure all TCS has been transferred.
- Place "TCS-buffer" flask onto a combination hotplate/magnetic stir plate, and set it to stir at a manageably high speed. Once well mixed, this TCS stock will nominally be 30 µM (actual concentration will be calculated after heating). (Do all mixing in a chemical fume hood.)
- Also at this time, place the "control buffer" flask (containing no TCS) onto a second combination hotplate/magnetic stir plate, and set it to stir at a similar speed.
- Turn on UV/Vis Lamp to warm up the lamp for later use.
- Heat the "TCS-buffer" solution to 50 °C while stirring constantly. Once up to temperature, time for 90 min. During the 90 min, continue to monitor 50 °C temperature and appropriate stirring speed frequently.
- Simultaneously, heat the "control buffer" solution (which is just 250 ml of plain Tyrodes buffer) to 50 °C with continuous stirring. Upon reaching 50 °C, time for 90 min, during which time temperature (keeping at 50 °C) and stirring are both monitored.
- At end of the 90 min, take both Erlenmeyer flasks off the hot plates and transfer to the benchtop.
- Using the wavelength scan function on a UV/Vis spectrophotometer, blank the machine on 1 ml of the heated "control buffer" solution before scanning 1 ml of heated "TCS-buffer" solution. Check the shape of the spectrum, and record Absorbance value at 280 nm. To determine the concentration, use the Beer-Lambert equation (A280=ε280ℓc) using an ε280 of 4200 L/mol/cm12 and ℓ of 1 cm.
- After determining the TCS concentration, add 0.249 g bovine serum albumin (BSA) to the remaining 249 ml of the "TCS-buffer" solution, and mix well.
- Simultaneously, add 0.249 g BSA to the remaining 249 ml of "control buffer" solution, and mix well.
DAY 2:
3. Antigen-stimulated Degranulation Assay Using RBL-2H3 Cells
- Before starting, check the pH of all buffers being used, and ensure that they are clear and not cloudy: this includes Tyrodes buffer, sodium acetate buffer, and glycine carbonate buffer (recipes provided in table).
- Warm RBL media and trypsin in 37 °C water bath.
- Make BT (1 mg/ml BSA in Tyrodes buffer): 0.05 g BSA + 50 ml Tyrodes Buffer (X2). Put into 37 °C water bath.
- Make 0.2% Triton X-100: 3.136 ml of BT + 64 µl of 10% Triton X-100 (final concentration of Triton X-100 is 0.2%). Mix well by inversion, but do not vortex. Put into 37 °C water bath.
- Start preparation of the TCS and heated Tyrodes buffer (steps "2," above). Note: Do not start the next step (IgE exposure) until the "TCS-buffer" and "control buffer" solutions reach 50 °C and stir for the first 70 min of the 90 min heat/stirring time.
- Once both solutions have been stirred at 50 °C for 70 min, make up 0.1 µg/ml anti-DNP mouse IgE (Sigma) in RBL media for sample wells to be sensitized (100 µl/well). IgE stock should not be older than 30 days when stored at 4 °C; record how old the stock is. Flick to mix, but do not vortex IgE.
- Under a TC hood, add 0.6 µl IgE stock (stock is 1 mg/ml) to 6 ml RBL media in a 50 ml tube. In a second 50 ml tube, add 6 ml of plain RBL media only (which is intended for nonsensitized samples).
- Dump all media from 96-well plate (that was prepared on Day 1) into sink, and bring the plate under the TC hood.
- Randomly add 100 µl media/IgE mixture to wells that should be stimulated (48 wells total). This mixture is not intended for "spontaneous", "TX," and "background" samples.
- Randomly add 100 µl plain RBL media only to "TX," "spontaneous," and "background" wells.
- Put plate lid on plate, and then move plate into 5% CO2 /37 °C incubator for 1 hr.
- During 1 hr incubation, follow steps 3.13 - 3.24.
- On the benchtop, prepare the antigen dilutions. Add 0.53 µl of 1.6 mg/ml stock DNP-BSA + 850 µl BT to get an antigen concentration of 1 µg/ml. Vortex and invert this stock to mix.
- Once "TCS-buffer" and "control buffer" have been heated and then stirred for 90 min at 50 °C, continue on with the rest of the preparation for the TCS protocol (go to steps 2.6 - 2.8.1). After the BSA is dissolved into both solutions, continue below.
- Begin preparing the exposure buffers, with ± Ag, ± TCS. First, from the 249 ml sample of "TCS-buffer" solution (that has already been heated and stirred for 90 min), transfer 50 ml to a new 50 ml conical tube. Remove 20 µl of this 50 ml aliquot and replace it with 20 µl of the 1 µg/ml antigen prepared earlier for a final antigen concentration of 0.0004 µg/ml DNP-BSA. Vortex and invert.
- Label this "Tube 1, High TCS/+Ag/+BT." It is used for dilutions and highest TCS concentration exposure.
- From the 249 ml sample of "control buffer" solution, transfer 50 ml to a new 50 ml tube. Remove 20 µl of this new 50-ml aliquot and replace with 20 µl of the 1 µg/ml antigen prepared earlier for a final antigen concentration of 0.0004 µg/ml DNP-BSA. Vortex and invert.
- Label this "Tube 2, No TCS/+Ag/+BT". Used for TCS dilutions and 0 µM TCS concentration exposure.
- Now take out 50 ml of "TCS-buffer" solution and put into another 50-ml tube. Remove 20 µl from this new 50-ml aliquot and replace it with 20 µl of plain BT. Vortex and invert. No antigen is added.
- Label this "Tube 3, High TCS/No Ag/+BT." This is used for background.
- Transfer 50 ml of "control buffer" solution to another 50-ml tube. Take out 20 µl from this new 50-ml aliquot and replace it with 20 µl of plain BT. Vortex and invert. (No Ag is added.)
- Label this "Tube 4, No TCS/No Ag/+BT." This is used for background and spontaneous samples.
| BSA | TCS | Antigen | |
| Tube 1 |  | High [ ] | |
| Tube 2 | | NO | |
| Tube 3 | | High [ ] | NO |
| Tube 4 | | NO | NO |
- Calculate and record volumes for dilutions after determining the concentration of the "TCS-buffer" stock. Total volume for each dilution concentration should be 1 ml and should be prepared in a sterile microcentrifuge tube. Use calibrated P2 and P1000 Pipetman.
| Concentration | High Triclosan+Tyrodes+BSA+0.0004 µg/ml Ag (Tube 1 from above) | Heated BT+0.0004 µg/ml Ag (Tube 2 from above) |
| 20 µM | ||
| 15 µM | ||
| 10 µM | ||
| 5 µM | ||
| 1 µM | ||
| 0.1 µM | ||
| 0.001 µM | ||
| 0 µM (top of plate) | ----------------------- | 500 µl plus another 500 µl |
| 0 µM (bottom of plate) | ----------------------- | 500 µl plus another 500 µl |
- After 1-hr IgE incubation, take plate out of incubator and toss all media into sink. (Note: if test chemicals are known to be more toxic than the consumer product TCS, hazardous waste disposal may be necessary.)
- Using a Combitip, randomly wash cells in the 96-well plate with BSA-Tyrodes Buffer (200 µl/well). Release the wash buffer onto the sides of the wells, rather than directly onto the attached cells, in order to avoid disturbing the attached cells. Repeat the process a second time.
- To prepare treatments for application, vortex and invert dilutions right before addition to the plate.
- Starting with the top section of the plate: Randomly add triplicates of 200 µl each of the antigen solutions (with correct concentrations of TCS) to the corresponding wells. Continue to bottom of plate. Add "control buffer" solution plus Ag (from "Tube 2" above) to all "mocks" on the plate.
- Add 200 µl of appropriate solutions to corresponding wells:
- Add 200 µl of 0.2% Triton X-100 to "TX"-designated wells.
- Next, add 200 µl of Tube 3 to the 3 wells labeled "Background (BkgD)-Highest TCS" on the plate.
- Finally, add 200 µl of Tube 4 to 6 wells labeled "Spontaneous."
- Incubate the plate for 1 hr in 37 °C/5% CO2.
- During 1 hr incubation: Get two buckets of ice (one for "old" plate in incubator and one for new plate). Thaw 4-methylumbelliferyl-N-acetyl-beta-D-glucosaminide (4-MU) at room temperature for up to 40 min, keeping in foil because it is light sensitive.
- Once 4-MU stock is thawed, make up 4-MU working solution: 150 µl stock + 14.85 ml of cold acetate buffer (recipe given in table); vortex and invert. Keep in 50 ml centrifuge tube, wrapped in foil, and on ice until use.
- Using Combitip, randomly add 100 µl cold 4-MU working solution into the very bottom of each well of a NEW Grenier black 96-well plate (on ice bucket #2). Start first by adding the working solution randomly within the top of the plate, randomly within the bottom of the plate, randomly within Triton X-100 wells, and finally randomly within background wells.
- Get out new box of P200 tips for next step.
- At the end of 1-hr incubation, put cell plate from incubator onto ice bucket #1, pipette supernatant up and down 4-5x (gently, not introducing bubbles), going around the well for good mixing but not touching the cells while mixing. Systematically, take out 25 µl sample from each well and place into the new plate with substrate (same ordering of samples, as originally planned out). Pipette up and down to mix sample thoroughly when in new well, without introducing bubbles.
- Incubate for 30 min at 37 °C/5% CO2.
- After 30 min incubation, randomly add 200 µl of cold glycine-carbonate buffer per well (using Combitip) to fill wells up to 325 µl total. (Make this addition to the Triton X-100 samples last, to avoid Triton X-100 spillover). Check for bubbles before reading plate (poke with clean P10 pipette tip to pop any bubbles).
- Run the plate in the fluorescence plate reader (go to section 4).
DAY 2:
4. Fluorescent Plate Reader Instructions and Data Analysis
- Open Gen5 program, and open experiment section.
- Turn on plate reader and insert plate (upper left corner is A1).
- Protocol
 Procedure Read to set custom readings. Do not add anything about samples, replicates, etc., in order to collect raw fluorescence data from each well.
 - Under "Read" choose "fluorescence," "Endpoint," "Normal Speed," "Gain 40," "Excitation 360/40," "Emission 460/40," Optics position: Top 50%. Top optical offset: 7mm. No shake, no delay, no kinetics, no monitor well, temperature: incubator off.
- Choose flat black bottom, 96-well plate (Grenier 96-well, Flat Bottom).
- Deal with the plate layout: Protocol plate layout. Set up samples without indicating repeats, dilutions, etc.
- Plate read.
- Save file: Click the "Excel" button, which will export data file to Excel. Do this for plate layout and for matrix. Save the file on the computer and on a USB drive.
- In Excel, subtract the average background reading from every sample, including Triton X-100 wells.
- Calculate relative % degranulation by dividing each value (already having had background subtracted) by the average Triton X-100 value, and then multiply by 100 to make it a percentage.
- Average all triplicates, and calculate standard deviation. Graph data in excel as mean values ± standard deviation. For statistical testing, move now to Prism software by GraphPad.
DAY 2:
5. Ionophore Stimulated Degranulation Assay Using RBL-2H3 Cells
- Follow protocol for "Preparation of cells" (Section 1, Day 1) and "Preparation of triclosan" (Section 2, Day 2), as instructed above. The plate layout example for ionophore stimulation is shown below.
| Treatment | Triplicates |
| Stimulated, 0 µM TCS | A7, B7, C7, F4, G4, H4 |
| Stimulated, 0.001 µM TCS | F6, G6, H6 |
| Stimulated, 0.01 µM TCS | F3, G3, H3 |
| Stimulated, 0.1 µM TCS | A4, B4, C4 |
| Stimulated, 1 µM TCS | A6, B6, C6 |
| Stimulated, 5 µM [TCS | F5, G5, H5 |
| Stimulated, 10 µM TCS | A3, B3, C3 |
| Stimulated, 15 µM TCS | A5, B5, C5 |
| Stimulated, 20 µM TCS | F7, G7, H7 |
| Spontaneous, with DMSO, no TCS (includes mocks) | A10, A11, A12, B10, B11, B12 A1, A2, A8, B1, B2, B8, C1, C2, C8, F1, F2, F8, G1, G2, G8, H1, H2, H8 |
| TX-100, with DMSO, no TCS | D10, D11, D12, E10, E11, E12 |
| No cells background, with DMSO, plus highest [TCS] | G10, G11, G12, H10, H11, H12 |
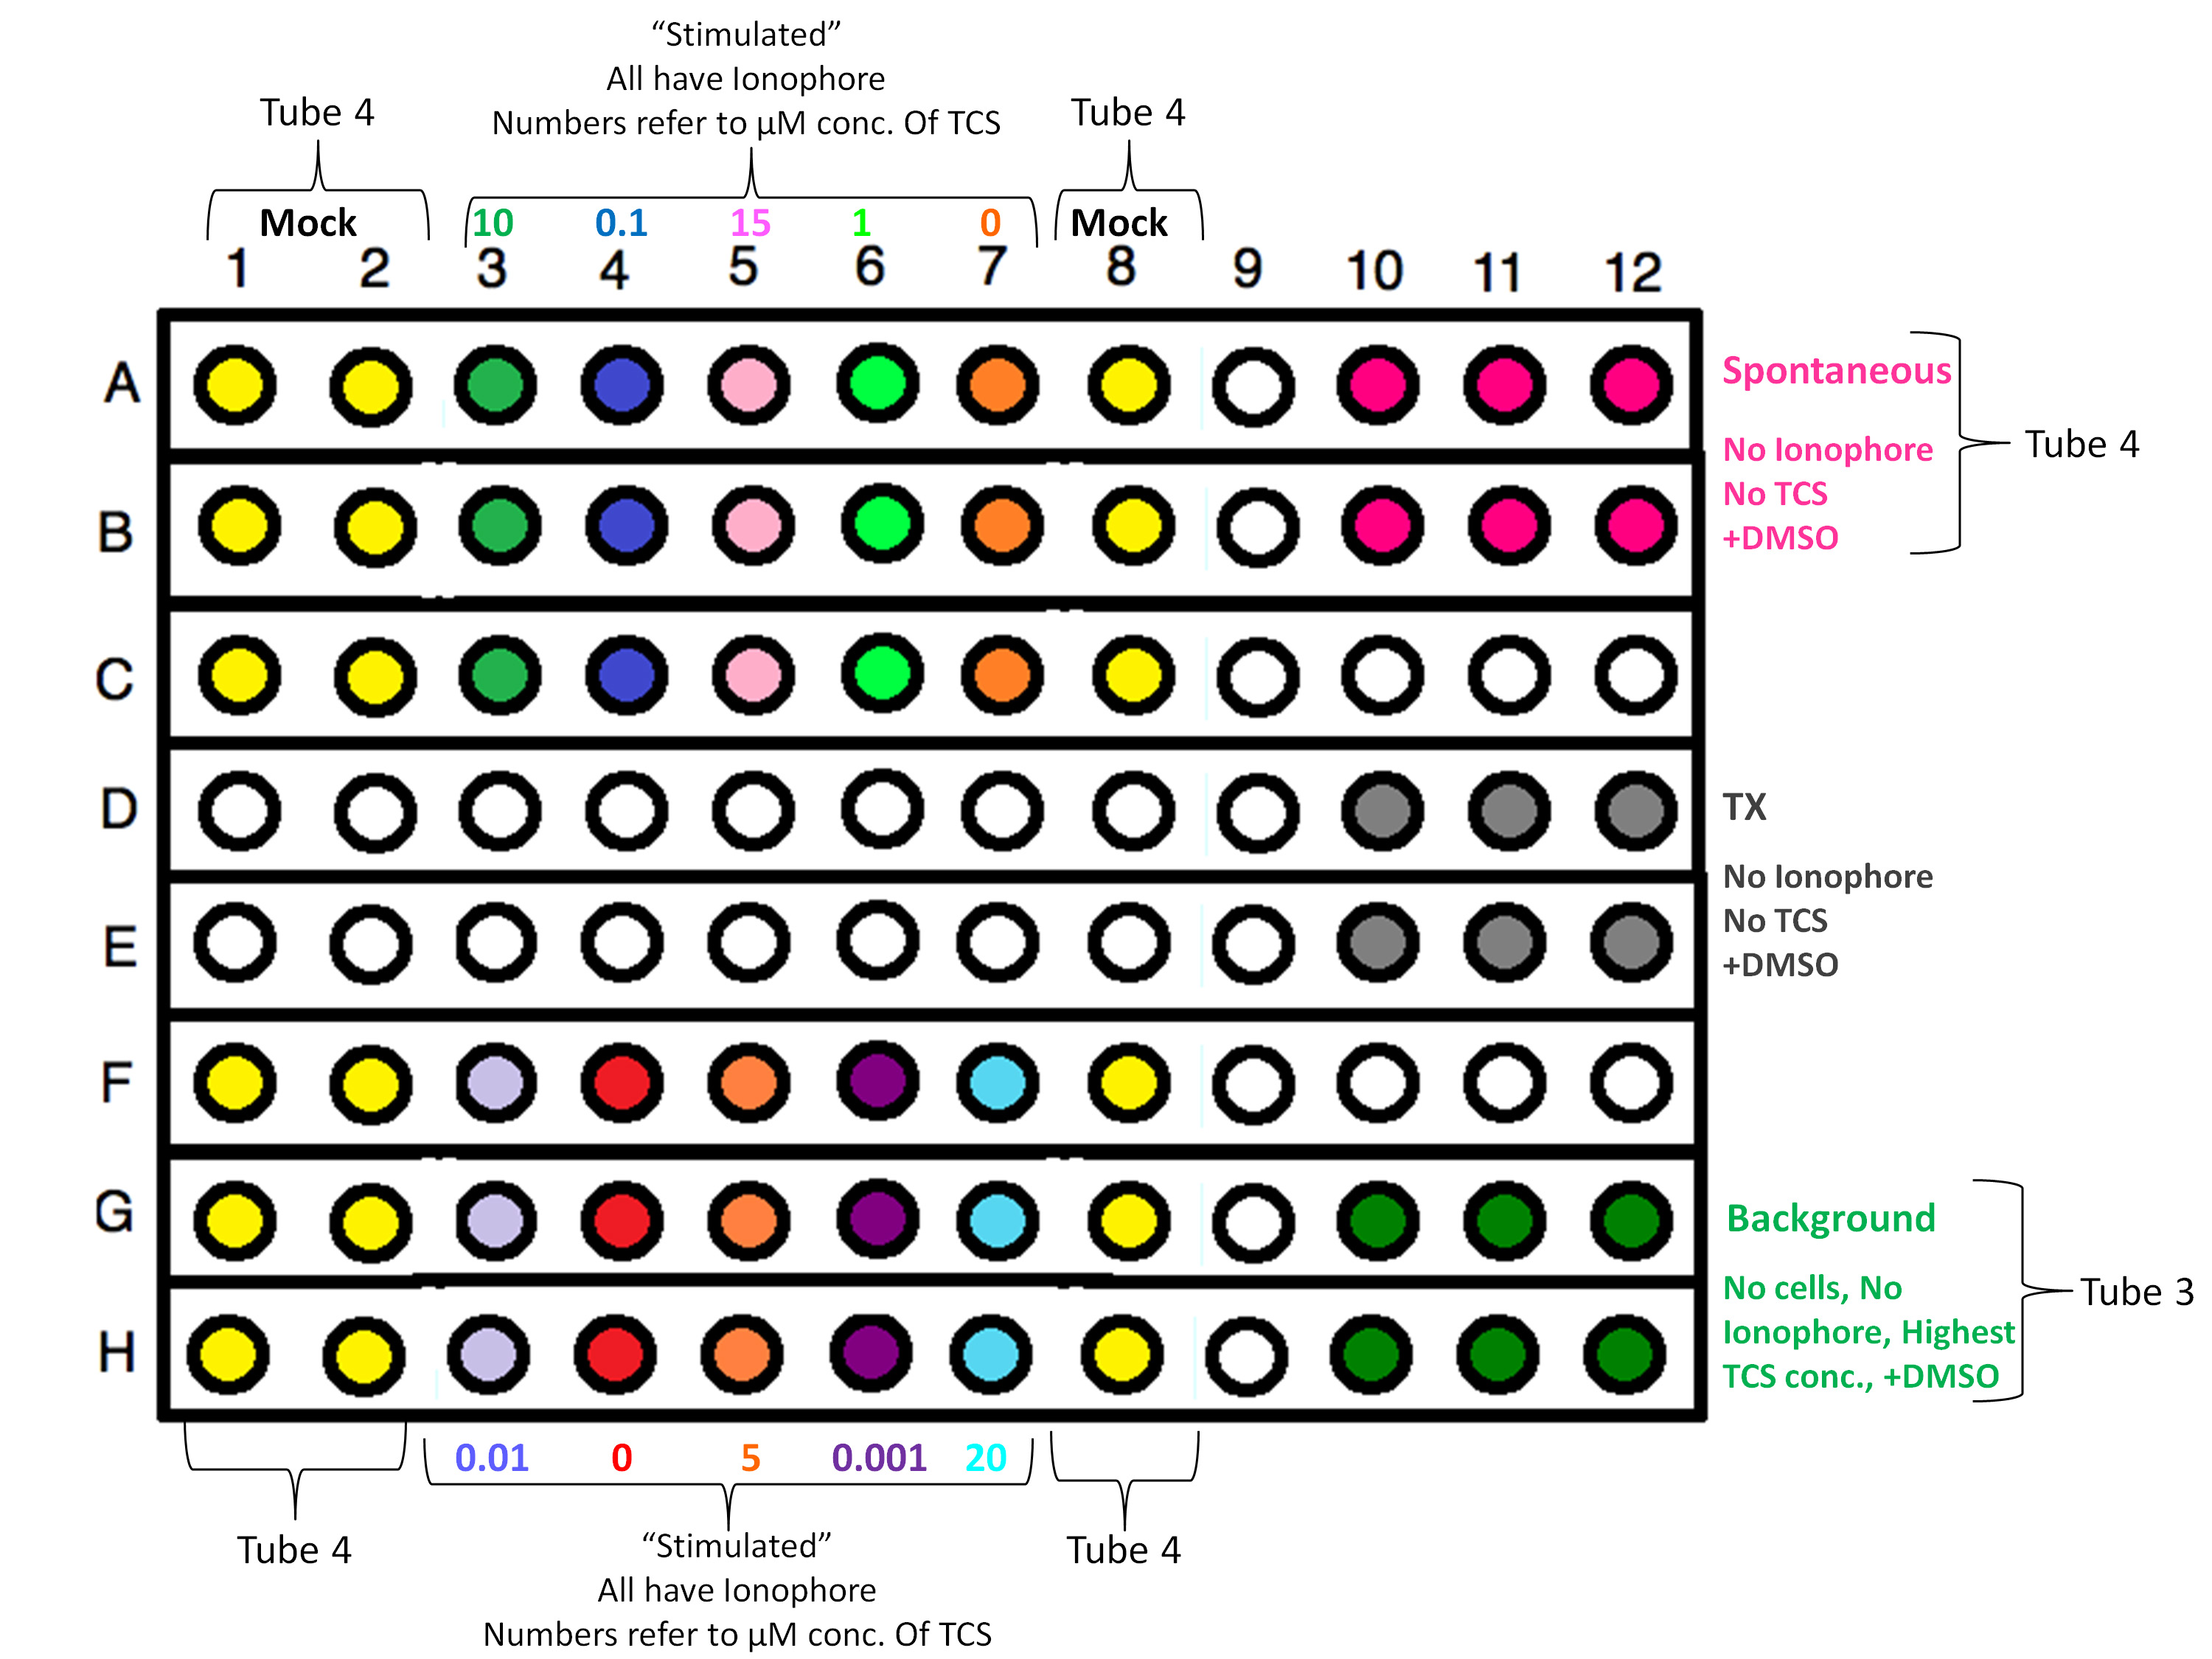
Click here to view larger image.
- Before starting, check the pH of all buffers being used, and ensure that they are clear and not cloudy. Tyrodes, sodium acetate buffer, and glycine carbonate buffer (recipes provided in table).
- Prepare one 50 ml conical tube of BT by adding 0.05 g BSA to 50 ml tyrodes buffer and by vortexing to mix well. Incubate in 37 °C water bath.
- Make 0.2% Triton X-100 with 0.0032% DMSO (the final calcium ionophore vehicle concentration) by adding 96 μl of 10% Triton X-100 to 4.704 ml BT. Mix well. Next, take out 0.155 μl of this solution and discard. Now add back in 0.155 μl of 100% DMSO.
- Prepare a 5 mM stock (2.5 mg/ml) of A23187 ionophore from powder by adding 400 μl of fresh 100% DMSO into the ionophore vial and vortexing to mix. Once in solution, transfer to a 1.5-ml conical tube, record contents and today’s date and expiry (3 months from preparation when stored properly at -20 °C).
- Alternatively, if using a frozen stock today, thaw on ice, and check that the 5 mM A23187 ionophore is well mixed and clear. Vortex, flick, and invert this stock before using. Record date of preparation and Lot # of this A23187.
- Once "TCS-buffer" and "control buffer" have been heated and stirred for 90 min, continue the rest of the preparation for TCS protocol (go to steps 2.6-2.8.1). After the BSA is well mixed into both solutions, continue with the remaining protocol steps.
- From the 249 ml sample of "TCS-buffer" solution, transfer 50 ml to a new 50 ml conical tube. Remove 1.8 µl of the 50 ml aliquot and add 1.8 µl of 5 mM ionophore stock. Vortex 3x for 8 sec and invert 3x. Final ionophore concentration is 180 nM. Note that this concentration of A23187 will vary depending on stock potency, and an A23187 ionophore dose response is recommended to identify a concentration of A23187 that elicits a degranulation level of roughly 20% maximal release, which has been identified as a noncytotoxic to RBL-2H3 cells by cytotoxicity assay (see2).
- Label this "Tube 1, High TCS/+Ionophore/+BT." Used for dilutions and highest TCS concentration exposure.
- From the 249 ml sample of "control buffer" solution, transfer 50 ml to a new 50 ml conical tube. Take out 1.8 µl of the 50 ml aliquot and add back in 1.8 µl of 5 mM ionophore stock. Vortex 3x for 8 sec and invert 3x. Final ionophore concentration is 180 nM.
- Label this "Tube 2, No TCS/+Ionophore/+BT." This is used for dilutions and 0 µM TCS concentrations.
- From the 249 ml sample of "TCS-buffer" solution, transfer 50 ml to a new 50 ml conical tube. Take out 1.8 µl of the new 50 ml aliquot and add 1.8 µl of 100% DMSO. Vortex 3x for 8 sec and invert 3x; no ionophore is added.
- Label this "Tube 3, High TCS/No Ionophore/+BT/+DMSO"; used for background.
- From the 249 ml sample of "control buffer" solution, transfer 50 ml to a new 50 ml conical tube. Take out 1.8 µl from the new 50 ml aliquot and add 1.8 µl of 100% DMSO. Vortex 3x for 8 sec and invert 3x. No Ionophore is added.
- Label this "Tube 4, No TCS/No Ionophore/+ BT/+DMSO"; used for spontaneous release samples.
| BSA | TCS | Ionophore | Added 100% DMSO | |
| Tube 1 | | High [ ] | | NO |
| Tube 2 | | NO | | NO |
| Tube 3 | | High [ ] | NO | |
| Tube 4 | | NO | NO | |
- Calculate and record volumes for dilutions after determining the concentration of the "TCS-buffer" stock. Use calibrated P2 and P1000 Pipetman. Total volume for each dilution concentration should be 1 ml, and should be prepared in a sterile microcentrifuge tube:
| Concentration | High Triclosan+Tyrodes+BSA+180 nM A23187 (Tube 1 from above) | Heated BT+180 nM A23187 (Tube 2 from above) |
| 20 µM | ||
| 15 µM | ||
| 10 µM | ||
| 5 µM | ||
| 1 µM | ||
| 0.1 µM | ||
| 0.001 µM | ||
| 0 µM (top of plate) | ---------------------------------- | 500 µl plus another 500 µl |
| 0 µM (bottom of plate) | ---------------------------------- | 500 µl plus another 500 µl |
- Take the cells plated yesterday out of the incubator, and empty the media into the sink. Using a Combitip, randomly wash cells in the 96-well plate with BT (200 μl/well). Repeat the wash a second time.
- To prepare treatments for application, vortex and invert dilutions right before addition to the plate. Starting with the top section of the plate: Randomly add triplicates of 200 µl each of the correct concentration of TCS to the corresponding well. Continue to bottom of plate. Add "control buffer" solution plus A23187 (from "Tube 2" above) to all "mocks" on the plate.
- Add 200 µl of appropriate solutions to corresponding wells:
- Add 200 µl of 0.2% Triton X-100 to "TX"-designated wells.
- Next, add 200 µl of Tube 3 to the 3 wells labeled "Background (BkgD)-Highest TCS" on the plate.
- Finally, add 200 µl of Tube 4 to six wells labeled "Spontaneous."
- Incubate the plate for 1 hr in 37 °C/5% CO2.
- During the 1 hr incubation: Get two buckets of ice (one for "old" plate in incubator and one for new plate). Thaw 4-methylumbelliferyl-N-acetyl-beta-D-glucosaminide (4-MU) at room temperature for up to 40 min, keeping in foil because it is light sensitive.
- Once 4-MU stock is thawed, make up 4-MU working solution: 150 µl stock + 14.85 ml of cold acetate buffer (recipe given in table); vortex and invert. Keep in 50 ml centrifuge tube, wrapped in foil, and on ice until use.
- Using Combitip, randomly add 100 µl cold 4-MU working solution into the very bottom of each well of a NEW Grenier black 96-well plate (on ice bucket #2): start first by adding the working solution randomly within the top of the plate, randomly within the bottom of the plate, randomly within Triton X-100 wells, and finally randomly within background wells.
- Get out new box of P200 tips for next step.
- At the end of 1-hr incubation, put cell plate from incubator on ice bucket #1, pipette supernatant up and down 4-5x (gently, not introducing bubbles), going around the well for good mixing but not touching the cells while mixing. Systematically, take out 25 µl sample from each well and place into the new plate with substrate (same ordering of samples, as originally planned out). Pipette up and down to mix sample thoroughly when in new well, without introducing bubbles.
- Incubate for 30 min at 37 °C/5% CO2.
- After 30 min incubation, randomly add 200 µl cold glycine-carbonate buffer per well (using Combitip) to fill wells up to 325 µl total (make this addition to the Triton X-100 samples last, to avoid Triton X-100 spillover). Check for bubbles before reading plate (poke with clean P10 pipette tip to pop any bubbles).
- Run the plate in the fluorescence plate reader (Follow all steps in section 4).
Access restricted. Please log in or start a trial to view this content.
Results
When heated to 50 °C for 90 min, the UV-Vis absorbance spectrum for TCS produces a strong, smooth curve between ~260 and 300 nm, with a peak at 280 nm, as shown in Figure 1. UV-Vis spectrophotometry is, therefore, an important tool that can be utilized to calculate concentration, since the published molar absorption coefficient at 280 nm is 4,200 L/mol/cm12. We have found that TCS does not fall out of solution during the time frame of the entire degranulation experiment, following the 50 °C heating (data not shown...
Access restricted. Please log in or start a trial to view this content.
Discussion
In 2004, Naal et al.1 developed a mast cell biosensor for high-throughput testing of degranulation. It is a robust assay that we have adapted for our TCS studies and detailed in this video. Prior to the Naal et al.1 assay, mast cell degranulation had been routinely assessed via β-hexosaminidase59-61, but these early methods utilized fluorometers in which one sample was read at a time. Importantly, Naal et al. established direct concordance between their mor...
Access restricted. Please log in or start a trial to view this content.
Disclosures
We have nothing to disclose.
Acknowledgements
L.M.W. and R.H.K are supported by UMaine’s Graduate School of Biomedical Science and Engineering (GSBSE); R.H.K. was also supported by the Maine Agricultural & Forest Experiment Station. Additional funding was provided by the National Institute of General Medical Sciences (NIH P20-GM103423), the Maine Agricultural & Forest Experiment Station (Grant Number ME08004-10, J.A.G.), the University of Maine ADVANCE Rising Tide Center (NSF Grant # 1008498), and a Research Starter Grant in Pharmacology/Toxicology from the PhRMA foundation (J.A.G.). We thank Drs. David Holowka and Barbara Baird for the antigen and cells. We are grateful to Hina Hashmi, Alejandro Velez, and Andrew Abovian for help with equipment and orders. This is Maine Agricultural & Forest Experiment Station publication number 3311.
Access restricted. Please log in or start a trial to view this content.
Materials
| Name | Company | Catalog Number | Comments |
|---|---|---|---|
| RBL-2H3 Cells | ATCC | CRL-2256 | The cells we used were a gift, but they are also available from ATCC |
| Triclosan/Irgasan | Sigma | 72779 CAS# 3380-34-5 | Should be stored in a low humidity environment |
| Trypsin | Gibco | 25300-054 CAS# 3380-34-5 | |
| EMEM | Lonza | 12-611F | |
| Fetal Bovine Serum | Atlanta Biologicals | S11150 | |
| Gentamycin Sulfate | Lonza Biological Sciences | 17-518 | |
| Albumin, Bovine Serum | Calbiochem | 12659 CAS# 9048-46-8 | |
| Surfact-Amps X-100 (Triton X-100; 10% solution) | Pierce | 28314 CAS# 9002-93-1 | |
| HEPES | J.T Baker | 4153-01 CAS# 75277-39-3 | |
| Magnesium Chloride | VWR | BDH0244-500G CAS# 7791-18-6 | |
| D-(+)-Glucose | Biomedicals | 152527 CAS# 50-99-7 | |
| Potassium Chloride Crystal | J.T Baker | 3046-01 CAS# 7447-40-7 | |
| Calcium chloride dihyrdate | Acros Organics | 207780010 CAS# 10035-04-8 | |
| Glycine | Sigma | G8898 CAS# 56-40-6 | |
| 4-Methylumbelliferyl-N-acetyl-β-D-glucosaminide (4-MU) | EMD Biosciences | 474502-250MG CAS # 37067-30-4 | Wrap in foil – is light-sensitive |
| Anti-DNP Mouse IgE | Sigma | D8406 | Reagent has concentration of 1 mg/ml. Aliquot 25 µl of reagent into separate microcentrifuge tubes and Parafilm. Store aliquots at -20 °C that are not being used and store aliquot that is being used at 2-8 °C for no longer than 1 month. |
| DNP-BSA | Gift from Dr. David Holowka and Dr. Barbara Baird, Cornell University | Suggest: life technologies DNP-BSA catalog# A23018 | |
| Calcium Ionophore A23187 | Sigma | C75-22-1mg | Ionophore was made from a powder by adding 400 µl of fresh 100% DMSO into the ionophore vial and is kept at -20 °C Note: we have used the ionophore past its 3 month expiration date successfully |
| DMSO | Sigma | D2650 CAS# 67-68-5 | |
| Acetic Acid | VWR | BDH3094-2 CAS# 64-19-7 | |
| Anhydrous Sodium Carbonate | Sigma | 222321 CAS# 497-19-8 | |
| Sodium Chloride | Sigma | 71376 CAS# 7647-14-5 | |
| Hydrochloric Acid | VWR | BDH3026 CAS# 7647-01-0 | |
| Reference Buffer, pH 7 | VWR | BDH5046 | |
| Reference Buffer, pH 10 | VWR | BDH5072 | |
| Reference Buffer, pH 4 | VWR | BDH5018 | |
| pH electrode storage solution | VWR | 14002-828 | |
| Equipment: | |||
| DU 7500 Spectrophotometer | Beckmann | No longer sold | |
| Synergy 2 plate reader Uses Gen5 Microplate Data Collection and Analysis Software | BioTek | Module S | |
| Hematocytometer | Hausser Scientific | 3110 | |
| 7 x 7 CER HOT/STIR 120 V Combination hot plate/magnetic stir plate | VWR | 97042-634 | |
| Centrifuge | Eppendorf | 5430 | |
| Tissue culture water bath | VWR | Model# 89032-206 | |
| Tissue Culture biological safety cabinet SafeGARD (TC hood) | The Baker Company | Model# SG403A-HE | |
| Tissue culture incubator | ThermoScientific | Model# 3598 | |
| Pipetman | VWR | Range: P2-P1000 | |
| Balance | Mettler Toledo | Model# AG204 | |
| pH meter | Symphony/VWR | Model# SB70P | |
| Pipet-Aid | Drummond Scientific | 4-000-100 | |
| Combitip dispenser | Eppendorf | 4981 000.019 | |
| Recipes: | |||
| Acetate Buffer, pH 4.4 | Make 0.12 M acetic acid and titrate to pH 4.4 with 10 N NaOH. This is 5.3 ml glacial acetic acid into 1 L of MilliQ water: (1 L)*(0.12 mol/L)*(60 g/mol)*(ml/1.37 g) = 5.3 ml because density of glacial is 1.37 g/ml | Sterile Filter into autoclaved glass bottle | |
| Substrate (4-MU) | Sigma M-2133, 250 mg, C18H21NO8, FW 379.4 CAS (37067-30-4) Store in -20°C Stock: 0.12 M in DMSO (46 mg in 1 ml DMSO), warm to 37 °C, vortex, sonicate 10 min. in water-bath sonicator with warm water, vortex again | For each experiment, make fresh solution of substrate in acetate buffer (100x dilution), for final concentration of 1.2 mM in acetate buffer | |
| Glycine Carbonate Buffer, pH 10 | 26.7 g glycine 47.1 g anhydrous sodium carbonate Add deionized water for 1 L, and adjust pH to 10 | Sterile filter into autoclaved glass bottle | |
| Tyrodes (2 L), pH 7.4 | 135 mM NaCl: 15.78 g (or 270 ml of 1 M) 5 mM KCl: 10 ml of 1 M stock 1.8 mM CaCl2: 7.20 ml of 0.5 M stock 1 mM MgCl2: 4.00 ml of 0.5 M stock 5.6 mM glucose: 2.02 g (11.2 ml of 1 M) 20 mM HEPES: 40 ml of 1 M stock Using concentrated HCl pH from ~9.7-7.4 | Sterile filter into autoclaved glass bottle | |
| RBL Cell Media | Thaw fetal bovine serum (FBS, stored at -20 °C) for about 4 hours in 37 °C water bath Follow standard sterile technique Get out 1 L minimum essential medium (MEM) with L-glutamine (with Earle’s salts) Pour off some MEM to have 800 ml MEM, add 200 mL warm FBS Add 1 ml gentamicin sulfate antibiotic to 1 L of media with sterile pipette Only use media bottles that have been autoclaved and marked for cell culture use only. | Sterile filter (0.2 mm) into autoclaved glass bottle | |
| Plastic material used: | |||
| 200 µl Disposable sterile pipet tips with graduations in 96 rack | VWR | 53509-009 | polypropylene |
| 1,000 µl Sterile aerosol pipet tips with HighRecovery | VWR | 89003-420 | polyethylene |
| 10 µl micro tip low binding sterile | VWR | 14217-704 | polypropylene |
| Disposable/conical Microcentrifuge tubes for high G-force | VWR | 20170-038 | polypropylene |
| Disposable/graduated/conical/sterile 50 ml centrifuge tubes with screw caps | VWR | 21008-178 | polypropylene |
| Disposable/graduated/conical/sterile 15 ml centrifuge tubes with screw caps | VWR | 21008-103 | polypropylene |
| CELLSTAR Tissue Culture Treated T-25 Flask w/ Filter Cap | Greiner Bio One | 690175 | polystyrene |
| CELLSTAR Tissue Culture Treated T-75 Flask w/ Filter Cap | Greiner Bio One | 658175 | polystyrene |
| CELLSTAR 10 ml Paper/Plastic Wrapped Serological Pipette | Greiner Bio One | 607180 | polystyrene |
| CELLSTAR 2 ml Paper/Plastic Wrapped Serological Pipette | Greiner Bio One | 710180 | polystyrene |
| CELLSTAR 5 ml Paper/Plastic Wrapped Serological Pipette | Greiner Bio One | 606180 | polystyrene |
| CELLSTAR 25 ml Paper /Plastic Wrapped Serological Pipette | Greiner Bio One | 760180 | polystyrene |
| 1 cm cuvettes | N/A | N/A | polystyrene |
| CELLSTAR, 96W Microplate, Tissue-Culture Treated, Black, with Lid 96-well Plate | Greiner Bio One | 655086 | polystyrene |
| Combitips | Eppendorf | 022266501 | Polypropylene/ polyethylene |
References
- Naal, R., Tabb, J., Holowka, D., Baird, B. In situ measurement of degranulation as a biosensor based on RBL-2H3 mast cells. Biosens. Bioelectron. 20, 791-796 (2004).
- Palmer, R. K., et al. Antibacterial agent triclosan suppresses RBL-2H3 mast cell function. Toxicol. Appl. Pharmacol. 258, 99-108 (2012).
- Fewtrell, C., Kessler, A., Metzger, H. Comparative aspects of secretion from tumor and normal mast cells. Adv. Inflam. Res. 1, 205-221 (1979).
- Metzger, H., et al. The receptor with high-affinity for immunoglobulin-E. Annu. Rev. Immunol. 4, 419-470 (1986).
- Seldin, D. C., et al. Homology of the rat basophilic leukemia-cell and the rat mucosal mast-cell. Proc. Natl. Acad. Sci. U.S.A. 82, 3871-3875 (1985).
- Schwartz, L. B., Austen, K. F., Wasserman, S. I. Immunological release of beta-hexosaminidase and beta-glucuronidase from purified rat serosal mast-cells. J. Immunol. 123, 1445-1450 (1979).
- Kjaerheim, V., Barkvoll, P., Waaler, S. M., Rolla, G. Triclosan inhibits histamine-induced inflammation in human skin. J. Clin. Periodontol. 22, 423-426 (1995).
- Barkvoll, P., Rolla, G. Triclosan reduces the clinical symptoms of the allergic patch test reaction (APR) elicited with 1-percent nickel sulfate in sensitized patients. J. Clin. Periodontol. 22, 485-487 (1995).
- Tan, W. P., Suresh, S., Tey, H. L., Chiam, L. Y., Goon, A. T. A randomized double-blind controlled trial to compare a triclosan-containing emollient with vehicle for the treatment of atopic dermatitis. Clin. Exp. Dermatol. 35, e109-e112 (2010).
- Sporik, R., Kemp, A. S. Topical triclosan treatment of atopic dermatitis. J. Allergy Clin. Immunol. 99, 861(1997).
- Wohlrab, J., Jost, G., Abeck, D. Antiseptic efficacy of a low-dosed topical triclosan/chlorhexidine combination therapy in atopic dermatitis. Skin Pharmacol. Physiol. 20, 71-76 (2007).
- Wong-Wah-Chung, P., Rafqah, S., Voyard, G., Sarakha, M. Photochemical behaviour of triclosan in aqueous solutions: Kinetic and analytical studies. J. Photochem. Photobiol. A Chem. 191, 201-208 (2007).
- Blank, U., Essig, M., Scandiuzzi, L., Benhamou, M., Kanamaru, Y. Mast cells and inflammatory kidney disease. Immunol. Rev. 217, 79-95 (2007).
- Gri, G., et al. Mast cell: an emerging partner in immune interaction. Frontiers in Immunology. 3, (2012).
- Kuby, J. Immunology. , W.H. Freeman. (1997).
- Farrell, D. J., et al. Intrahepatic mast-cells in chronic liver-diseases. Hepatology. 22, 1175-1181 (1995).
- Cookson, W. The alliance of genes and environment in asthma and allergy. Nature. 402, 5-11 (1999).
- Ferris, C. D., Huganir, R. L., Supattapone, S., Snyder, S. H. Purified inositol 1,4,5-triphosphate receptor mediates calcium flux in reconstituted lipid vesicles. Nature. 342, 87-89 (1989).
- Foreman, J. C., Mongar, J. L., Gomperts, B. D. Calcium ionospheres and movement of calcium ions following physiological stimulus to a secretory process. Nature. 245, 249-251 (1973).
- Siraganian, R. P., Kulczycki, A., Mendoza, G., Metzger, H. Ionophore A-23187 induced histamine-release from mast-cells and rat basiphil leukemia (RBL-1) cells. J. Immunol. 115, 1599-1602 (1975).
- Demo, S. D., et al. Quantitative measurement of mast cell degranulation using a novel flow cytometric annexin-V binding assay. Cytometry. 36, 340-348 (1999).
- Hutchinson, L. M., et al. Inorganic arsenite inhibits IgE receptor-mediated degranulation of mast cells. J. Appl. Toxicol. 31, 231-241 (2011).
- Dann, A. B., Hontela, A. Triclosan: environmental exposure, toxicity and mechanisms of action. J. Appl. Toxicol. 31, 285-311 (2011).
- Jones, R. D., Jampani, H. B., Newman, J. L., Lee, A. S. Triclosan: A review of effectiveness and safety in health care settings. Am. J. Infect. Control. 28, 184-196 (2000).
- Levy, C. W., et al. Molecular basis of triclosan activity. Nature. 398, 383-384 (1999).
- McMurry, L. M., Oethinger, M., Levy, S. B. Triclosan targets lipid synthesis. Nature. 394, 531-532 (1998).
- Allmyr, M., Adolfsson-Erici, M., McLachlan, M. S., Sandborgh-Englund, G. Triclosan in plasma and milk from Swedish nursing mothers and their exposure via personal care products. Sci. Total Environ. 372, 87-93 (2006).
- Allmyr, M., et al. The influence of age and gender on triclosan concentrations in Australian human blood serum. Sci. Total Environ. 393, 162-167 (2008).
- Geens, T., Neels, H., Covaci, A. Distribution of bisphenol-A, triclosan and n-nonylphenol in human adipose tissue, liver and brain. Chemosphere. 87, 796-802 (2012).
- Kolpin, D. W., et al. Pharmaceuticals, hormones, and other organic wastewater contaminants in US streams, 1999-2000: A national reconnaissance. Environ. Sci. Technol. 36, 1202-1211 (2002).
- Black, J. G., Howes, D. Percutaneous absorption of triclosan from toilet preparations. J. Soc. Cosmet. Chem. 26, 205-215 (1975).
- Black, J. G., Howes, D., Rutherford, T. Percutaneous absorption and metabolism of Irgasan DP300. Toxicology. 3, 33-47 (1975).
- Kanetoshi, A., et al. Acute toxicity, percutaneous-absorption and effects on hepatic mixed-function oxidase activities of 2,4,4'-trichloro-2'-hydroxydiphenyl ether (Irgasan(R) DP300) and its chlorinated derivatives. Arch. Environ. Contam. Toxicol. 23, 91-98 (1992).
- Sandborgh-Englund, G., Adolfsson-Eric, M., Odham, G., Ekstrand, J. Pharmacokinetics of Triclosan in man. J. Dental Res. 81, 0937(2002).
- Sandborgh-Englund, G., Adolfsson-Erici, M., Odham, G., Ekstrand, J. Pharmacokinetics of triclosan following oral ingestion in humans. J. Toxicol. Environ. Health A. 69, 1861-1873 (2006).
- Lin, Y. J. Buccal absorption of triclosan following topical mouthrinse application. Am. J. Dent. 13, 215-217 (2000).
- Queckenberg, C., et al. Safety of Triclosan after Dermal Administration. Antimicrob. Agents Chemother. 54, 570-572 (2010).
- Breneman, D. L., Hanifin, J. M., Berge, C. A., Keswick, B. H., Neumann, P. B. The effect of antibacterial soap with 1.5% triclocarban on Staphylococcus aureus in patients with atopic dermatitis. Cutis. 66, 296-300 (2000).
- Udoji, F., Martin, T., Etherton, R., Whalen, M. M. Immunosuppressive effects of triclosan, nonylphenol, and DDT on human natural killer cells in vitro. J. Immunotoxicol. 7, 205-212 (2010).
- Ahn, K. C., et al. In vitro biologic activities of the antimicrobials triclocarban, its analogs, and triclosan in bioassay screens: Receptor-based bioassay screens. Environ. Health Perspect. 116, 1203-1210 (2008).
- Foran, C. M., Bennett, E. R., Benson, W. H. Developmental evaluation of a potential nonsteroidal estrogen: triclosan. Mar. Environ. Res. 50, 153-156 (2000).
- Gee, R. H., Charles, A., Taylor, N., Darbre, P. D. Oestrogenic and androgenic activity of triclosan in breast cancer cells. J. Appl. Toxicol. 28, 78-91 (2008).
- Helbing, C. C., van Aggelen, G., Veldhoen, N. Triclosan Affects Thyroid Hormone-Dependent Metamorphosis in Anurans. Toxicol. Sci. 119, 417-418 (2011).
- Ishibashi, H., et al. Effects of triclosan on the early life stages and reproduction of medaka Oryzias latipes and induction of hepatic vitellogenin. Aquat. Toxicol. 67, 167-179 (2004).
- Kumar, V., Chakraborty, A., Kural, M. R., Roy, P. Alteration of testicular steroidogenesis and histopathology of reproductive system in male rats treated with triclosan. Reprod. Toxicol. 27, 177-185 (2009).
- Matsumura, N., et al. Effects of nonylphenol and triclosan on production of plasma vitellogenin and testosterone in male South African clawed frogs (Xenopus laevis. Biol. Pharm. Bull. 28, 1748-1751 (2005).
- Veldhoen, N., et al. The bactericidal agent triclosan modulates thyroid hormone-associated gene expression and disrupts postembryonic anuran development. Aquat. Toxicol. 80, 217-227 (2006).
- Raut, S. A., Angus, R. A. Triclosan has endocrine-disrupting effects in male western mosquitofish, Gamusia affins. Environ. Toxicol. Chem. 29, 1287-1291 (2010).
- Park, H. G., Yeo, M. K. The toxicity of triclosan, bisphenol A, bisphenol A diglycidyl ether to the regeneration of cnidarian, Hydra magnipapillata. Mol. Cell. Toxicol. 8, 209-216 (2012).
- Vandhanaa, S., Deepa, P. R., Aparna, G., Jayanthi, U., Krishnakumar, S. Evaluation of suitable solvents for testing the anti-proliferative activity of triclosan - a hydrophobic drug in cell culture. Indian J. Biochem. Biophys. 47, 166-171 (2010).
- Skaare, A. B., Kjaerheim, V., Barkvoll, P., Rolla, G. Does the nature of the solvent affect the anti-inflammatory capacity of triclosan? An experimental study. J. Clin. Periodontol. 24, 124-128 (1997).
- Rufli, H. Introduction of moribund category to OECD fish acute test and its effect on suffering and LC50 values. Environ. Toxicol. Chem. 31, 1107-1112 (2012).
- Hutchinson, T. H., Shillabeer, N., Winter, M. J., Pickford, D. B. Acute and chronic effects of carrier solvents in aquatic organisms: A critical review. Aquat. Toxicol. 76, 69-92 (2006).
- Toivari, M., Maki, T., Suutarla, S., Eklund, K. K. Ethanol inhibits IgE-induced degranulation and cytokine production in cultured mouse and human mast cells. Life Sci. 67 (00), 2795-2806 (2000).
- Kennedy, R. H., Pelletier, J. H., Tupper, E. J., Hutchinson, L. M., Gosse, J. A. Estrogen mimetic 4-tert-octylphenol enhances IgE-mediated degranulation of RBL-2H3 mast cells. J. Toxicol. Environ. Health A. 75, 1451-1455 (2012).
- Fort, D. J., et al. Triclosan and Thyroid-Mediated Metamorphosis in Anurans: Differentiating Growth Effects from Thyroid-Driven Metamorphosis in Xenopus laevis. Toxicol. Sci. 121, 292-302 (2011).
- Fiori, J., et al. Macromolecular Symposia. in Brazilian Polymer Congress. Pinto, J. C. 299-300, 26-33 (2011).
- Mezcua, M., et al. Evidence of 2,7/2,8-dibenzodichloro-p-dioxin as a photodegradation product of triclosan in water and wastewater samples. Anal. Chim. Acta. 524, 241-247 (2004).
- Soto, E. O., Pecht, I. A monoclonal-antibody that inhibits secretion from rat basophilic leukemia-cells and binds to a novel membrane component. Journal of Immunology. 141, 4324-4332 (1988).
- Pierini, L., Harris, N. T., Holowka, D., Baird, B. Evidence supporting a role for microfilaments in regulating the coupling between poorly dissociable IgE-Fc epsilon RI aggregates and downstream signaling pathways. Biochemistry. 36, 7447-7456 (1997).
- Aketani, S., Teshima, R., Umezawa, Y., Sawada, J. Correlation between cytosolic calcium concentration and degranulation in RBL-2H3 cells in the presence of various concentrations of antigen-specific IgEs. Immunol. Lett. 75, 185-189 (2001).
- Koo, N., Kim, K. M. Distinct effects on M-2-type pyruvate kinase are involved in the dimethylsulfoxide-induced modulation of cellular proliferation and degranulation of mast cells. Arch. Pharmacal Res. 32, 1637-1642 (2009).
- Senyshyn, J., Baumgartner, R. A., Beaven, M. A. Quercetin sensitizes RBL-2H3 cells to polybasic mast cell secretagogues through increased expression of Gi GTP-binding proteins linked to a phospholipase C signaling pathway. J. Immunol. 160, 5136-5144 (1998).
- Yang, C. Z., Yaniger, S. I., Jordan, V. C., Klein, D. J., Bittner, G. D. Most Plastic Products Release Estrogenic Chemicals: A Potential Health Problem that Can Be Solved. Environ. Health Perspect. 119, 989-996 (2011).
Access restricted. Please log in or start a trial to view this content.
Reprints and Permissions
