

Summary
Afferent sensory neurons signal sensory information from the periphery to the central nervous system. Identifying specific afferent neurons will help in understanding their physiology. We describe a method of retrograde labeling to identify afferent neurons, and study the voltage-gated ion channels in these neurons using patch clamp electrophysiology and immunocytochemistry.
Abstract
Sensory neurons transmit signals from various parts of the body to the central nervous system. The soma for these neurons are located in the dorsal root ganglia that line the spinal column. Understanding the receptors and channels expressed by these sensory afferent neurons could lead to novel therapies for disease. The initial step is to identify the specific subset of sensory neurons of interest. Here we describe a method to identify afferent neurons innervating the muscles by retrograde labeling using a fluorescent dye DiI (1,1'-dioctadecyl-3,3,3',3'-tetramethylindocarbocyanine perchlorate). Understanding the contribution of ion channels to excitation of muscle afferents could help to better control excessive excitability induced by certain disease states such as peripheral vascular disease or heart failure. We used two approaches to identify the voltage dependent ion channels expressed by these neurons, patch clamp electrophysiology and immunocytochemistry. While electrophysiology plus pharmacological blockers can identify functional ion channel types, we used immunocytochemistry to identify channels for which specific blockers were unavailable and to better understand the ion channel distribution pattern in the cell population. These techniques can be applied to other areas of the nervous system to study specific neuronal groups.
Introduction
Dorsal root ganglia (DRG) are comprised of soma from afferent neurons innervating various parts of the body, and important insights can be gained from studying sensory neurons with different innervation targets1. Various indirect or invasive methods are used to isolate and identify afferent neurons for e.g. injecting the nerve with markers like fluorogold1, injecting dye into the muscles by surgical method2. Of the different dyes that have been successfully used to label neurons and neuronal tracts, fluorescent dyes like DiI are widely used in neuroanatomical tracings owing to their rapid uptake by neuron terminals, long term retention in neurons, and the lack of transfer between neurons3. The afferent neurons labeled with DiI can be easily visualized using a fluorescent microscope for detailed study. However, one limitation is that markers such as DiI can be lost from cells during cell permeabilization needed for immunocytochemistry with intracellular epitopes4. Here we describe a method that uses DiI injected into skeletal muscle to identify muscle afferent neurons in the DRG. We also describe a cell permeabilization method that retains DiI in the neuron while permitting antibody access to intracellular epitopes. We demonstrate use of both patch clamp electrophysiology and immunocytochemistry to study these identified neurons, as well as describe the distinct advantages of each technique in studying ion channels that control neuronal excitability. Finally, we describe potential problems that can hinder interpretation of electrophysiological data. We have used these methods to identify muscle and cutaneous afferent neurons and determine the voltage-gated sodium (NaV) channels expressed in these identified neurons8. However, these methods can be adapted to a variety of preparations for studying identified subsets of neurons innervating a particular target tissue or brain nucleus.
Subscription Required. Please recommend JoVE to your librarian.
Protocol
Note: All animal work must be carried out according to institutional and animal care guidelines.
1. Preparation of Animal and Labeling
- Anesthetize rats: Anesthetize a rat (typically 150-400 g) using an intraperitoneal injection of a mixture of ketamine (50 mg/kg body weight), xylazine (5 mg/kg) and acepromazine (1 mg/kg). Check for reflexes by pinching the foot, wait till there is no response. Since the anesthesia response varies between animals, it is best to determine the effect of the anesthetics by testing pain reflexes.
- DiI Solution: Weigh DiI powder and dissolve in sterile 100% DMSO to achieve a 1.5% solution (15 mg/ml). Store the solution at room temperature in a dry atmosphere until use.
- DiI Injections: shave the hair over the calf area on both legs of the anesthetized rat using an electric razor.
- Fill a 1 ml sterile syringe (1¼ in 27 G needle) with 200 µl of 1.5% DiI solution. Slowly insert the needle parallel to the long-axis of each gastrocnemius muscle, and inject 100 µl DiI into the muscle while slowly backing the needle out of the muscle (~10 sec) without withdrawing from the muscle.
- Prior to withdrawing the needle from the muscle, pull back on the syringe plunger to ensure the dye no longer flows from the tip, wait 10 sec, and then withdraw the needle from the muscle. This step prevents the leakage of DiI from the needle onto the skin, which could label cutaneous afferents.
- Repeat for other leg.
- Allow 4-5 days for the DiI to be transported from muscle to the DRG.
2. Dissection and Neuronal Isolation
- Solutions:
- Prepare Hank’s Balanced Salt Solution (HBSS) and Earle’s Balanced Salt Solution (EBSS) according to manufacturer’s instructions, filter sterilize and store at 4 °C.
- Culture media (MEM Plus): Mix 89 ml minimal essential media (MEM), 10 ml fetal bovine serum (FBS), 1 ml penicillin-streptomycin solution, filter sterilize and store at 4 °C.
- Polylysine solution: dissolve poly-L-lysine hydrobromide powder (10 mg/100 ml) in 0.1 M sodium borate solution, pH 8.4, filter sterilize and store aliquots at -20 °C.
- Coating coverslips
- Clean the glass coverslips (12 mm round) in 70% ethanol for 3-4 hr and air dry in sterile culture hood.
- Place the dried coverslips in the polylysine solution O/N.
- Remove from polylysine solution and wash in sterile distilled water 2x for 5 min each to remove any excess polylysine.
- Separate the coverslips, dry in culture hood, and store at 4 oC.
- Setting up for dissection
- Place on ice a beaker with 10 ml HBSS, a 35 mm Petri dish and a 100 mm Petri dish.
- Weigh out enzymes: 7 mg collagenase, 1 mg of DNAse and 10 mg of trypsin.
- Preheat a shaking water bath to 37 oC and place into the bath a 15 ml centrifuge tube containing 10 ml of EBSS to warm up.
- Dissection:
- Sacrifice rat according to an IACUC approved protocol. Carbon dioxide was used to euthanize the rat.
- Quickly remove the back by cutting open the skin on the back, remove the connective and muscle tissue along the spinal column for better exposure and remove the lumbar section of the vertebral column (end of the thoracic region to the iliac bone; Figure 1).
- Place the isolated vertebral column into the 100 mm Petri dish, and using a sterile Pasteur pipette apply chilled HBSS solution to keep the preparation moist and cold.
- Cut the muscles from the sides of the vertebral column. Perform a dorsal laminectomy, using rongeurs or scissors, and gently remove the bone enclosing the recesses containing the DRG.
- Repeatedly apply ice cold HBSS (~1 ml) during this procedure.
- Isolate the DRG by cutting the peripheral and central nerves (leaving 1-2 mm of nerve to facilitate handling of the ganglia)
- Place the isolated DRG into the 35 mm Petri dish containing ice-cold HBSS buffer.
- Repeat until all L-4 and L-5 DRG have been isolated. Thoracic DRG can be isolated and processed separately as a negative control for DiI labeling.
- Place the dish with isolated DRG under a dissection microscope and remove the excess nerves and blood vessels using micro scissors and forceps.
- Cut open the DRG for better exposure to the enzymes, but do not desheath the DRG.
- DRG neuron dissociation:
- Add the enzymes into the warm EBSS media (kept in the water bath). Shake briefly to dissolve, and filter sterilize.
- Using a sterile Pasteur pipette, place all DRG into the enzyme solution. Minimize the volume of HBSS that is added with DRG since the HBSS will dilute the enzyme mixture. Gas the flask with 95% O2 and 5% CO2 for 60 sec before tightly capping the flask.
- Incubate the flask in the shaking water bath set at 37 °C for 60 min at 240 rpm.
- At the end of incubation, vigorously shake the flask 50x to dissociate the DRG5.
- Under sterile conditions, add 5 ml of MEM Plus to the flask to stop the enzymes.
- Transfer flask contents to a sterile 15 ml centrifuge tube and centrifuge at 16 x g for 6 min.
- Remove and discard the supernatant, add 5 ml of MEM Plus to the sample. Triturate gently with pipette to break up the pellet.
- Repeat centrifugation step, remove and discard the supernatant and add 500 µl of MEM Plus. Gently triturate with a 1 ml pipette tip on a pipette to make a cell suspension.
- Place one poly-lysine coated glass coverslip into an empty sterile 35 mm dish. Add a drop (~50 µl) of the cell suspension to the center of the coverslip.
- Repeat until cell solution is exhausted.
- Place the 35 mm dishes into a 37 °C and 5% CO2 incubator for 1 hr to allow the neurons to adhere to the coverslips.
- Add an additional 2 ml of media into each dish and return to the incubator.
3. Patch Clamp Recording
- Solutions for recording: these solutions are for recording NaV currents. Examples of solutions with differing composition can be found in these references5-7.
- External solution: (in mM) 45 NaCl, 100 N-methyl-d-glucamine (NMG)•Cl, 4 MnCl2, 10 Na•HEPES and 10 glucose, with pH = 7.4 and osmolarity = 320 mOsm.
- Internal solution: (in mM) 104 NMG•Cl, 14 Creatine•PO4, 6 MgCl2, 10 NMG•HEPES, 5 Tris•ATP, 10 NMG2•EGTA, and 0.3 Tris2•GTP with pH 7.4 and osmolarity = 300 mOsm.
- Measurement of ionic currents:
- Pull recording electrodes from glass capillaries on an electrode puller and heat-polish the tips using a microforge. The resistance of the electrodes is typically 2-3 MΩ
- Identify the DiI labeled DRG neurons using a microscope with epifluorescence and a TRITC cube. DiI has an excitation wavelength of 550 nm and emission wavelength of 570 nm.
- Fill the glass electrode with internal solution (only filing ~ 1 cm of the electrode tip) and gently tap to remove any trapped bubbles. Place in electrode holder and move to cell using a micromanipulator.
- Once the electrode touches the cell, apply gentle suction via the suction tube, until a tight seal is formed ( determined by the increase in electrode resistance).
- Clamp the membrane voltage at the desired holding potential (typically -60 to -120 mV).
- Obtain the whole-cell patch clamp configuration by applying stronger suction to remove the membrane patch at the tip of the electrode. The transition to whole-cell configuration is observed electrically as an increase in capacitative current8-10.
- Compensate the series resistance using the compensation circuitry of the patch clamp amplifier (use at least 80% compensation)8,10.
4. Immunocytochemistry
- Fix the neurons on the coverslips with 4% paraformaldehyde for 1 hr and then permeabilize with 2% Tween 20 in phosphate buffered saline (PBS) for 10 min.
- Incubate the fixed cells O/N in a blocking solution (normal serum or Bovine Serum Albumin) plus the primary antibody, which is an antibody developed to bind to a specific antigen of interest.
- Incubate a control set of neurons O/N in blocking solution that lacks the primary antibodies.
- Wash the coverslips with PBS buffer 3x for 5 min followed by 2 washes of 5 min each with 1% Tween 20 to remove unbound primary antibody.
- Incubate test and control coverslips with the appropriate fluorescent tagged secondary antibody, which binds to the primary antibody to permit visualization.
- Wash the coverslips with PBS 3x for 5 min to remove excess secondary antibody.
- Mount the coverslips on a clean glass slide using mounting media.
- Apply clear nail polish to edge of the coverslip to fix it place. Once dry, visualize the neurons and capture images using the software accompanying the fluorescence microscope.
Note: In this work, a Nikon Microscope was used with NIS-elements BR 3.2 software. The exposure time was optimized and kept the same for control and test slides. - Measure fluorescence intensity and cell size from individual neurons using imaging software such as ImageJ (rsbweb.nih.gov/ij/index.html).
Subscription Required. Please recommend JoVE to your librarian.
Representative Results
Using the method described here, we identified muscle afferent neurons in DRG and went on to determine the voltage-gated sodium channels (NaV) expressed by these neurons. DiI labeled muscle afferent neurons (Figure 1C) comprised a small fraction of the total population of neurons in the DRG with an average of 16% of neurons (167/1047) labeled. The quantification was done by first measuring the fluorescence using ImageJ and plotting histograms of the intensity data to determine the threshold for positively labeled neurons. The threshold was determined by fitting a Gaussian distribution to the large peak of unlabeled neurons, which provided mean intensity and standard deviation (SD) (Figure 1D). The threshold level was set to the mean intensity plus 2x SD so that any neurons with intensity > threshold are marked as labeled11,12 .
Electrophysiology:
For patch clamp recordings, we selected brightly labeled, isolated neurons with no obvious neurites (neuronal outgrowths). Neurites cause space clamp problems that make the neurons difficult or impossible to properly voltage clamp since the ion channels in neurites are several space constants away from the current passing electrode. Thus, the decay of the injected current is too large to control the membrane voltage at these distant locations. Other problems that can erode voltage clamp performance are large membrane capacitance (large cells), high series resistance, and large currents. Figure 2 shows an example of sodium currents recorded from two neurons. The current in the first neuron (Figure 2A) is smaller and membrane voltage control is good as seen from the correspondence of peak currents over the three voltages (-20 to 0 mV) and steady increase in current from -30 to +10 mV in the current–voltage (I-V) relationship. The membrane voltage control in the second neuron (Figure 2B) is very poor as seen from the sigmoidal activation and late peak of the current at -20 mV (bold trace). The I-V also shows a threshold-like behavior between -20 and -10 mV where the current jumps from a low level to peak in 10 mV. Note also the very slow deactivation of current at -40 mV in Figure 2B (compare with Figure 2A). All of these are signs of very poor voltage control and the neuron in Figure 2B is not suitable for study8-10.
Immunocytochemistry:
The ion channels that we studied had intracellular facing antigenic sites. Thus, the neurons needed to be permeabilized so that the antibodies could gain access to these sites. However, this is a problem since DiI can be lost from neurons upon permeabilization4. By permeabilizing the DRG neurons with Tween 20, we were able to get good antibody labeling and retain DiI for identification of muscle afferent neurons11,12.
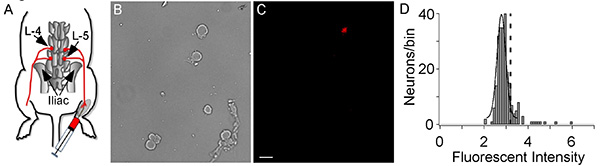
Figure 1. DiI Injection and cell labeling. (A) A representation of DiI injection into the gastrocnemius muscle and retrograde transportation from muscle to DRG. The L-4 and L-5 DRG are labeled. (B, C) Afferent neurons are shown in the bright field image (B) and a fluorescent image shows the one DiI labeled muscle afferent neuron (C). The white bar indicates 50 µm. (D) A histogram of the DiI fluorescent intensity of sensory neurons. The large peak is from unlabeled neurons and is fit with a Gaussian equation to determine mean intensity and the standard deviation (SD). The dashed vertical line represents the threshold for DiI labeling, which was the mean Gaussian peak plus 2 x SD. The histogram comprises data from 1047 neurons with 167 being labeled with DiI (Intensity > threshold). Click here to view larger image.
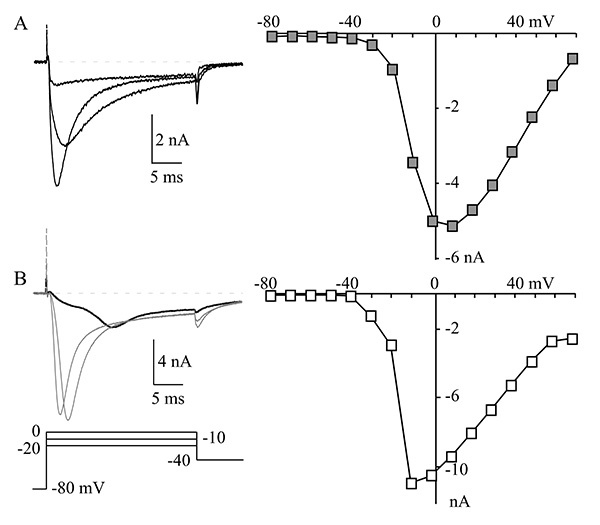
Figure 2. Voltage clamp in a cell. (A) A representative muscle afferent neuron with good control of membrane voltage. The NaV currents at -20, -10, and 0 mV are shown on the left and the current-voltage relationship (I-V) is shown on the right. The I-V relationship was generated by measuring peak NaV current at each indicated voltage. (B) Currents are shown (left) from a neuron with large NaV currents and very poor voltage control, which is characterized by the late peak of the NaV current at -20 mV (bold trace) and the increase from small to maximum current of the I-V (right) between -20 mV to -10 mV. Compare that with the relatively even incremental increases in current between -30 and +10 mV for the I-V shown in panel A. Click here to view larger image.
Subscription Required. Please recommend JoVE to your librarian.
Discussion
Muscle afferents originating from triceps surae muscles (e.g. gastrocnemius) have been used in multiple studies to investigate the exercise pressor reflex (EPR)13. Given the interest in studying sensory neurons mediating the EPR, the gastrocnemius muscles were selected for dye injection. DiI was chosen due to its lipophilic nature and since it is not lost from the neuron by diffusion through the intact plasma membrane3,14. Using this method as a guide, one can inject the dye into any target organ of interest to identify the innervating afferent neurons. A literature search will provide the information needed to locate the best injection site and the DRGs to be isolated 13,15,16.
The injection of DiI needs to be done with care to inject only the intended tissue. It is also important to ensure that the dye is well distributed within the tissue. We optimized our dye distribution in the muscle by injecting along the longitudinal muscle axis. The needle is inserted into the muscle and the injection is done while withdrawing the needle along the muscle. Leakage is prevented by gently pulling back the syringe plunger prior to removing the needle from the muscle, which avoids dye contact with skin. However, in cases of accidental skin labeling, we exclude those rats from our recordings. As a further safeguard, the cutaneous dermatomes covering our injection area are primarily L6 and S117, so there is a low probability of unnoticed DiI leaks labeling cutaneous afferents in L4 and L5.
We have also used DiI to label cutaneous afferents by injecting the DiI just under the skin within the L4-L5 dermatomes11,17. DiI labeling can also be used to label neuronal tracts either in vivo or in post-mortem tissue14.
Speed is essential to obtain viable neurons following isolation. Thus, the dissection of the DRG from the animal should be done very quickly, but gently. There is trade off in that one can damage the neurons if the dissection is done too quickly. We generally complete the dissection within 20 min. Another key to maintaining good cell viability is to keep the tissue cold and moist during the dissection. We apply chilled HBSS solution about every 60-90 sec during the dissection procedure. Speed is less important once the DRG are placed in ice cold HBSS (35 mm dish) for debridement.
For electrophysiology recordings, the recording solutions are critical in determining which types of ionic currents can be observed. The solutions that we describe here are the ones we use to record NaV currents. Examples of solutions with differing composition can be found in these references5-7. One problem for recording NaV currents is the large size of the currents. We addressed this by lowering the external Na+ concentration. A normal mammalian extracellular Na+ concentration is 145 mM, but we use a Na+ concentration of 50 mM NaCl to reduce the current amplitude and greatly improve voltage clamp control. Other Na+ concentrations can be used. The goal is to reduce the current size sufficiently to maintain proper control of membrane voltage, while maintaining sufficient current amplitude to clearly resolve the NaV current from background (i.e. signal to noise). In our solutions, the Na+ and K+ are replaced with NMG, which is a monovalent cation that does not permeate active ion channels18. The Ca2+ in the solution is replaced with Mn2+, which maintains membrane surface charge screening 18 while not readily permeating calcium channels11. Removal of K+ and Ca2+ from the solution prevents contamination of our NaV current by KV and CaV currents.
Another problem for voltage clamp recordings is the resistance of the pipette, which produces a problem for patch clamp amplifiers in controlling membrane voltage. The problem is that the pipette tip resistance is in series with the membrane resistance so that part of the voltage drop occurs at the pipette tip instead of the complete voltage drop occurring at the membrane. The larger the pipette resistance, the larger the voltage drop at the pipette tip, instead of the cell membrane. This problem can be controlled for by the series resistance compensation circuitry of the patch clamp amplifier 8-10. However, this circuitry can induce oscillations when the series resistance is too high, which will prevent proper compensation9,10. There is no absolute resistance that will trigger oscillations, but we generally encounter problems with series resistances >8 MΩ.
Electrophysiology is often used to examine functional ion channels in neurons19, but one limitation is that this technique generally allows one to record from only one cell at a time, which can make it difficult to gauge expression of ion channels in a population of neurons. Immunocytochemistry has the advantage of labeling all neurons in a population that express a particular channel type. Thus, electrophysiology and immunocytochemistry are synergistic techniques that facilitate the identification of ion channels in a diverse population of neurons, such as those found in the DRG. The immunocytochemistry labeling method described here can be used to label any channel of interest.
The labeling method described here can be used to identify any afferent neurons of interest to facilitate their study16. The neuronal isolation protocol can be adapted to isolate DRG neurons from other regions and neurons from other ganglia16,20 . The combination of patch clamp electrophysiology and immunocytochemistry are complimentary to enhance our knowledge and understanding of the expressed ion channels11,12. The study of neuronal subtypes is critical for better understanding of the differences in receptor and ion channel expression that govern excitability, which could lead to the identification of targets that selectively impact the excitability of these neurons to treat disease.
Subscription Required. Please recommend JoVE to your librarian.
Disclosures
The authors declare no conflicts of interest.
Acknowledgments
This work was funded by National Institutes of Health Grant AR059397 (KSE).
Materials
| Name | Company | Catalog Number | Comments |
| NaV 1.8 | Abcam | Ab93616 | |
| NaV 1.1 / 1.6/ 1.7 and 1.9 | Alamone Labs, Jerusalem, Israel | ASC- 001/ 009 /008 /017 | |
| Alexa Fluor secondary antibodies | Invitrogen | ||
| Normal goat serum | |||
| Fluoro-Gel | Electron Microscopy Sciences | 17985 |
References
- Hu, P., McLachlan, E. M. Selective reactions of cutaneous and muscle afferent neurons to peripheral nerve transection in rats. J. Neurosci. 23, 10559-10567 (2003).
- Wang, H. J., et al. Endogenous reactive oxygen species modulates voltage-gated sodium channels in dorsal root ganglia of rats. J. Appl. Physiol. 110, 1439-1447 (2011).
- Köbbert, C., et al. Current concepts in neuroanatomical tracing. Prog. Neurobiol. 62, 327-351 (2000).
- Matsubayashi, Y., Iwai, L., Kawasaki, H. Fluorescent double-labeling with carbocyanine neuronal tracing and immunohistochemistry using a cholesterol-specific detergent digitonin. J. Neurosci. Methods. 174, 71-81 (2008).
- Ikeda, S. R., Schofield, G. G., Weight, F. F. Na+ and Ca2+ currents of acutely isolated adult rat nodose ganglion cells. J. Neurophysiol. 55, 527-539 (1986).
- Yarotskyy, V., Elmslie, K. S. Roscovitine Inhibits CaV3.1 (T-Type) Channels by Preferentially Affecting Closed-State Inactivation. J. Pharmacol. Exp.Ther. 340, 463-472 (2012).
- Ganapathi, S. B., Kester, M., Elmslie, K. S. State-dependent block of HERG potassium channels by R-roscovitine: implications for cancer therapy. Am. J. Physiol. Cell Physiol. 296, 701-710 (2009).
- Jones, S. W. Neuromethods Vol. 14 Neurophysiological Techniques: Basic Methods and Concepts. Baker, G. B., Vanderwolf, C. H., Boulton, A. A. , The Humann Press, Inc. 143-192 (1990).
- Penner, R. Single-Channel Recording. Sakmann, B., Neher, E. rwin 1, Plenum Press. 3-30 (1995).
- Marty, A. aN., Erwin, Single-Channel Recording. Sakmann, B., Neher, E. rwin 2, Plenum Press. 31-52 (1995).
- Ramachandra, R., McGrew, S. Y., Baxter, J. C., Kiveric, E., Elmslie, K. S. Tetrodotoxin-resistant voltage-dependent sodium (NaV) channels in identified muscle afferent neurons. J. Neurophysiol. , (2012).
- Ramachandra, R., McGrew, S. Y., Baxter, J. C., Howard, J. R., Elmslie, K. S. NaV1.8 channels are expressed in large, as well as small, diameter sensory afferent neurons. Channels. 7, 0-1 (2013).
- Smith, S. A., Mitchell, J. H., Garry, M. G. The mammalian exercise pressor reflex in health and disease. Exp. Physiol. 91, 89-102 (2006).
- Honig, M. G., Hume, R. I. Dil and diO: versatile fluorescent dyes for neuronal labelling and pathway tracing. Trends Neurosci. 12, 333-335 (1989).
- von Bartheld, C. S., Cunningham, D. E., Rubel, E. W. Neuronal tracing with DiI: decalcification, cryosectioning, and photoconversion for light and electron microscopic analysis. J. Histochem. Cytochem. 38, 725-733 (1990).
- Fuller, B. C., Sumner, A. D., Kutzler, M. A., Ruiz-Velasco, V. A novel approach employing ultrasound guidance for percutaneous cardiac muscle injection to retrograde label rat stellate ganglion neurons. Neurosci. Lett. 363, 252-256 (2004).
- Takahashi, Y., Nakajima, Y. Dermatomes in the rat limbs as determined by antidromic stimulation of sensory C-fibers in spinal nerves. Pain. 67, 197-202 (1996).
- Zhou, W., Jones, S. W. Surface charge and calcium channel saturation in bullfrog sympathetic neurons. J Gen Physiol. 105, 441-462 (1995).
- Hamill, O. P., Marty, A., Neher, E., Sakmann, B., Sigworth, F. J. Improved patch-clamp techniques for high-resolution current recording from cells and cell-free membrane patches. Pflugers Arch. 391, 85-100 (1981).
- Margas, W., Mahmoud, S., Ruiz-Velasco, V. Muscarinic Acetylcholine Receptor Modulation of Mu ({micro}) Opioid Receptors in Adult Rat Sphenopalatine Ganglion Neurons. J. Neurophysiol. 103, 172-182 (2010).
