We describe the production and characterization of nanoparticles and microparticles composed of poly(lactic-co-glycolic acid) using vitamin E-TPGS as an emulsifier. By varying formulation parameters such as the concentration of emulsifier, it is possible to produce nanoparticles with mean diameters ranging from 220 nm to 1.98 µm.
Method Article
PLGA Nanoparticles Formed by Single- or Double-emulsion with Vitamin E-TPGS
In This Article
Summary
Abstract
Poly(lactic-co-glycolic acid) (PLGA) is a biocompatible member of the aliphatic polyester family of biodegradable polymers. PLGA has long been a popular choice for drug delivery applications, particularly since it is already FDA-approved for use in humans in the form of resorbable sutures. Hydrophobic and hydrophilic drugs are encapsulated in PLGA particles via single- or double-emulsion. Briefly, the drug is dissolved with polymer or emulsified with polymer in an organic phase that is then emulsified with the aqueous phase. After the solvent has evaporated, particles are washed and collected via centrifugation for lyophilization and long term storage. PLGA degrades slowly via hydrolysis in aqueous environments, and encapsulated agents are released over a period of weeks to months. Although PLGA is a material that possesses many advantages for drug delivery, reproducible formation of nanoparticles can be challenging; considerable variability is introduced by the use of different equipment, reagents batch, and precise method of emulsification. Here, we describe in great detail the formation and characterization of microparticles and nanoparticles formed by single- or double-emulsion using the emulsifying agent vitamin E-TPGS. Particle morphology and size are determined with scanning electron microscopy (SEM). We provide representative SEM images for nanoparticles produced with varying emulsifier concentration, as well as examples of imaging artifacts and failed emulsifications. This protocol can be readily adapted to use alternative emulsifiers (e.g. poly(vinyl alcohol), PVA) or solvents (e.g. dichloromethane, DCM).
Introduction
Polymers have become increasingly popular drug delivery vehicles in the last several decades for applications ranging from targeted tumor therapy1 to modulation of the immune system2. Polymer-encapsulated or conjugated drugs are frequently more effective than their freely delivered counterparts, since polymer-associated drug is protected from degradation. This protection translates to a longer biological half-life and potentially improved efficacy with reduced systemic side effects3-5.
Poly(lactic-co-glycolic acid) (PLGA) exhibits many of the ideal properties of a nanoscale delivery system, providing long term release of the encapsulated agent and degrading into the biocompatible products of lactic and glycolic acid . Small molecules, proteins, and nucleic acids that are encapsulated in PLGA have demonstrated enhanced activity in a variety of disease applications8. Importantly, the material platform facilitates easy customization of features such as size, charge, and surface display of ligands for targeting particles to specific tissues or for imaging purposes. Because PLGA is already used in humans in the form of biodegradable sutures (e.g. Purasorb, Purac Biomaterials, and Vicryl, Ethicon Inc.), the potential for clinical translation is high.
Oil-water (single) or water-oil-water (double) emulsion is one method by which PLGA can be used to encapsulate hydrophobic and hydrophilic drugs in micro- or nano-scale form. Briefly, PLGA is dissolved into an organic phase (oil) that is emulsified with a surfactant or stabilizer (water). Hydrophobic drugs are added directly to the oil phase, whereas hydrophilic drugs (water) may be first emulsified with the polymer solution prior to formation of particles. High intensity sonication bursts facilitate the formation of small polymer droplets. The resulting emulsion is added to a larger aqueous phase and stirred for several hours, which allows the solvent to evaporate. Hardened nanoparticles are collected and washed by centrifugation (Figure 1).
Here, we describe a technique for making PLGA nanoparticles using single and double emulsion, with ethyl acetate (EtAc) as the solvent and vitamin E- D-α-Tocopherol polyethylene glycol succinate (TPGS) as the emulsifying agent. The use of vitamin E-TPGS offers several possible advantages over other types of stabilizing agents (e.g. poly(vinyl alcohol), PVA), including improved emulsification and encapsulation efficiency. Other groups have reported advantages of Vitamin E-TPGS, including the inhibition of P-gp, a transmembrane efflux protein, which is commonly overexpressed on cancer cells and known to contribute to drug resistance by shuttling drugs out of target cells. Additionally, we demonstrate how to characterize and size the particles using scanning electron microscopy (SEM) and provide further guidance on size modification via alteration of the protocol.
Protocol
1. Nanoparticle Preparation
All steps involving solvent or dissolved/emulsified polymer should be performed in a chemical fume hood.
- Weigh 100 mg (+/- 5 mg) of poly(lactic-co-glycolic acid) (PLGA) and place in a 13 mm x 100 mm test tube.
- Transfer 1 ml solvent (ethyl acetate (EtAc) or dichloromethane (DCM)) to the sample with a glass serological pipette.
- Cover the top of the tube with a small piece of aluminum foil, and Parafilm the foil securely, being sure to wrap the Parafilm tightly across the top edge of the vial as well as the bottom edge of the foil.
- Mark the level of the solvent on the outside of the test tube. Let the polymer dissolve overnight, adding additional solvent the next day if evaporation occurs.
Note: Polymer can also be dissolved the day of nanoparticle preparation, if needed. Follow steps 1.1-1.3, then vortex on high until all polymer is completely dissolved (~10 min). - Prepare a work area in the fume hood with the following equipment/materials next to the ultrasonicator: a vortexer, two small glass Pasteur pipettes with rubber bulbs, and a magnetic stir plate. Place a large beaker full of ice water on a stand below the ultrasonicator.
- Add 45 ml of 0.3% w/v Vitamin E-TPGS to a 200 ml glass beaker with a magnetic stir bar and set stirring speed to 360 rpm.
- Add 2 ml of 0.3% w/v Vitamin E-TPGS to a 13 mm x 100 mm glass test tube.
- Add drug:
For hydrophobic agents: add encapsulant directly to the polymer solution (being careful to avoid the walls of the test tube) and vortex the tube until encapsulant is homogenously dispersed.
For hydrophilic agents: emulsify encapsulant with the polymer solution before proceeding. Add up to 50 μl of drug in water or buffer to the surface of the polymer solution. Ultrasonicate briefly to emulsify the drug with polymer (typically 10 sec, or as necessary to achieve a homogenous, opaque solution). This sonication step should be performed on ice. - Place the open tube polymer/encapsulant near the vortexer. While holding the test tube containing Vitamin E-TPGS vertically and on high vortex, use a glass Pasteur pipette to add the polymer/encapsulant solution dropwise. Be careful to avoid the sides of the tube and drop the polymer solution directly onto the surface of the vortexing emulsifier. After the entire 1 ml of polymer solution has been added to the Vitamin E-TPGS, continue vortexing the solution (now an emulsion) for an additional 15 sec.
- Immediately transfer the emulsified polymer to the ultrasonicator. Keep the test tube immersed in ice water and sonicate the emulsion in three 10 sec bursts (40% amplitude for a 700 W sonicator, 1/8 in probe tip size). Move the emulsion up and down the probe to ensure even sonication, being careful to avoid touching the probe to the sides or bottom of the test tube. Pause between each ten second sonication to allow the solution to cool before proceeding.
- Add 1-2 ml of 0.3% Vitamin E-TPGS from the stirring solution to the emulsion with a glass Pasteur pipette, which thins the emulsified polymer so that it will pour more easily. Empty the emulsion into the stirring solution. Repeat this step to wash out any remaining solution from the test tube into the stirring solution.
- Allow nanoparticles to harden while stirring for three hours. If the encapsulant is light-sensitive, the beaker may be wrapped in aluminum foil, leaving the top open to facilitate solvent evaporation.
2. Nanoparticle Collection
- Split the hardened nanoparticles into two Oak Ridge centrifuge tubes (30 ml nominal volume) and balance to within 0.1 g.
- Centrifuge nanoparticles in a fixed-angle rotor for 15 min at 17,000 x g. Longer centrifugation times will result in the collection of a higher fraction of smaller nanoparticles.
- Discard the supernatant, being careful not to disturb the nanoparticle pellet (water may be poured or pipetted off). Add 15 ml diH2O and use a water bath sonicator and/or vortexer to completely resuspend the nanoparticles.
- Combine the contents of the two centrifuge tubes into one and repeat steps 2.1-2.3 2x more, for a total of three washes in 30 ml of diH2O each time. The fluid volume of the last pellet resuspension should be 4-5 ml.
A weight ratio of 1:2 trehalose:polymer may be added at this point as a cryoprotectant (freeze a small aliquot of nanoparticles without trehalose for SEM imaging). Ice crystals that form during the freezing process may damage the particle surface and induce aggregation, and inclusion of trehalose has been shown to improve the uniform and complete resuspension of PLGA nanoparticles13. - Transfer the nanoparticles to a preweighed 5 ml centrifuge tube and freeze at -80 °C for a minimum of 30 min.
- Moving quickly so as not to let the frozen contents melt, uncap the tube and cover the top by securing lab tissue across the top with a rubber band. **If any melting occurs, refreeze before placing in the lyophilizer.
- Lyophilize 72 hr for a 5 ml volume. Store lyophilized particles in Parafilm-wrapped tube at -80 °C.
3. Sizing and Surface Morphology
Scanning Electron Microscopy
- Samples for SEM should be prepared the day of imaging. Place a strip of double-sided carbon tape on an SEM stub. Permanent marker may be used to label the metal portion of the stub for later reference.
- Use a metal spatula to collect a small quantity of lyophilized nanoparticles and gently spread them across the surface of the tape. Brush the surface of the stub with a lab tissue or use compressed air to remove loose nanoparticles.
- Sputter coat the sample with gold-paladium for 30-120 sec. A longer sputter time will produce a smoother surface for imaging, although this may result in the loss of fine surface details.
- Typical parameters for visualizing particles are a working distance of 5-15 mm, beam strength of 5-12 kV, and a spot size of 1-3. Higher beam strengths may result in regional heating of the sample, which will alter the surface morphology of the particles. Microparticles are observed at 100X magnification and nanoparticles will be distinguishable at 3,000X magnification.
- The ideal sample will consist of a uniform coating of particles across the flat surface of the stub. Occasionally, secondary structures (including flakes or spheres) may result from lyophilization. Focusing on the edge of a flake, where the flake meets tape, or the top of a sphere will help to locate particles that can be easily visualized with SEM. Collect at least three images per batch in order to obtain a representative sample of particle size and morphology.
Results
Representative SEM images of PLGA microparticles and nanoparticles prepared using this protocol are shown in Figures 2a and 2b. Particles will appear as individual, nonfused spheres, with a smooth surface morphology and broad range of sizes distributed throughout the sample.
To determine the average diameter of each batch, measurements are taken directly from the SEM images using the "measure" function in ImageJ. A minimum of 150 measurements of the diameter of particles selected randomly from the field of view should be taken to acquire a representative size distribution. The average size of a batch of particles depends on formulation parameters. For example, in Figure 2a, microparticles (average diameter of 730 nm±370) were formed with 1 ml of solvent to 100 mg of PLGA, using 0.05% Vitamin E-TPGS in the emulsifying phase, whereas in Figure 2b, nanoparticles (average diameter of 340 nm±70) were formed with 4 ml of solvent to 200 mg of PLGA, encapsulating the hydrophobic drug camptothecin and using 0.3% Vitamin E-TPGS in the emulsifying phase (full formulation parameters are described in the figure caption). Generally speaking, higher concentration of emulsifier will produce smaller particles, with average diameters ranging between 220-2,000 nm being achievable by varying emulsifier concentration from 0.3-0.01% (Figure 3).
Our yields range from 74-98% (22 batches of nanoparticles with varying solvents, emulsifiers, and emulsification conditions, prepared by a single experimenter). Better yields may be observed for larger (>150 nm) batches, since small nanoparticles are lost easily during the centrifugation and wash step, particularly when the wash supernatant is poured off the pellet. Careful pipetting of the fluid can help to avoid this issue. Higher speeds and/or longer centrifugation can also improve yield both by improving the collection of the ultra-small fraction of nanoparticles and also by compacting to the pellet so that less is lost in the wash step. The protocol described here is focused on producing particles with TPGS as the emulsifying agent and EtAc as the solvent, however, alternative solvents and/or emulsifying agents are possible. In general, we find that EtAc produces smaller and more uniformly sized nanoparticles than DCM (e.g. diameters of 540 nm±190 versus 2,160 nm±1,530 for EtAc versus DCM, 100 mg/ml PLGA in solvent, emulsified into 2 ml 0.1% TPGS), presumably because EtAc is water-miscible, whereas DCM is not. PVA is a popular emulsifying agent that has been used extensively by us and other groups. We have observed variability in nanoparticles prepared from different batches of commercially available PVA. It is advisable, therefore, to consider utilizing the same stock of PVA when possible to improve reproducibility. In our hands, we find that PVA is a more effective emulsifier at much higher concentrations than TPGS (e.g. diameter of 140 nm±48, 100 mg/ml PLGA in DCM, emulsified into 2 ml 5% PVA).
Characterizing nanoparticles with SEM can be challenging due to differences in equipment and imaging process. It is therefore important to distinguish morphological features that indicate problems with particle formation versus artifacts that are introduced inadvertently while imaging. Fusing (Figures 4a and 4b), dimpling (Figure 4c), or cracking (Figure 4f) of particles is sometimes observed in the SEM images. These artifacts sometimes indicate poorly formed particles (e.g. in Figure 4a, the emulsifier concentration was too high to form discrete particles) but also could result from artifacts introduced by the characterization method (e.g. in Figure 4b, the sample heated during sputter coating, and in Figure 4c, local heating from the SEM beam altered the surface morphology of the particles while imaging). To avoid imaging artifacts, sputter coating time should be minimized and beam power kept low. Smoother morphologies are observed for longer sputter times, however, this can induce fusing of particles. Sputter times that are too short may make imaging difficult, as particles will become charged and move during image capture. Capturing images quickly will help to avoid prolonged beam exposure and distortion of images (Figures 4d and 4e). High beam exposures can also result in expansion and cracking of the nanoparticle surface (Figure 4f). If morphology artifacts cannot be minimized by altering the characterization parameters, it is possible that they represent true issues with the nanoparticles themselves. During the fabrication process, fusing may result from overheating due to high ultrasonication power, incomplete evaporation of solvent, incomplete resuspension during the wash phase, or failed lyophilization.
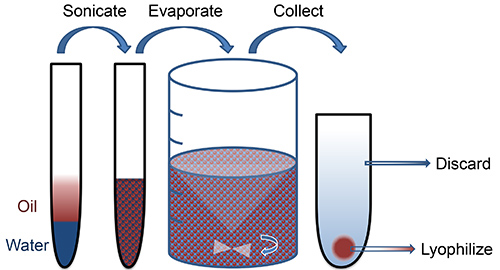
Figure 1. Schematic of nanoparticle fabrication. Click here to view larger image.
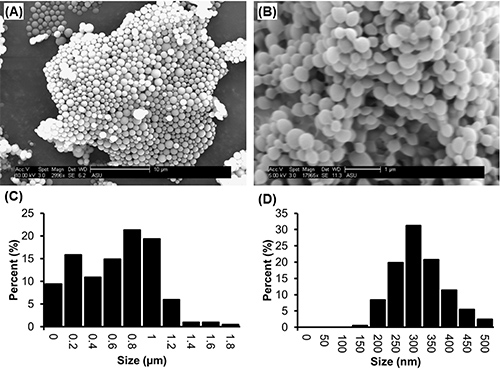
Figure 2. SEM images and corresponding size distributions of PLGA microparticles and nanoparticles produced by the single emulsion method. In (A), particles were formed by emulsifying 100 mg PLGA dissolved in 1ml ethyl acetate into 2 ml of 0.05% Vitamin E-TPGS, and hardened in 45 ml 0.01% Vitamin E-TPGS. The corresponding size distribution is shown in (C). In (B), particles were formed by emulsifying 200 mg PLGA and 40mg of camptothecin dissolved in 4mL ethyl acetate into 4 ml 0.3% Vitamin E-TPGS, and hardened in 90 ml 0.3% Vitamin E-TPGS. The corresponding size distribution is shown in (D). Click here to view larger image.
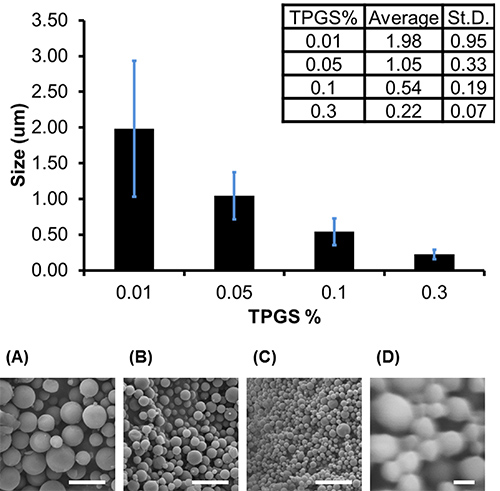
Figure 3. Particle size depends on emulsifier concentration. Increasing Vitamin E-TPGS concentration resulted in smaller nanoparticles. Average diameters and corresponding SEM images are shown of particles prepared by emulsifying 100 mg of PLGA dissolved in 1 ml of ethyl acetate into (A) 0.01%, (B) 0.05%, (C) 0.1%, or (D) 0.3% Vitamin E-TPGS and hardened in 45 ml 0.3% Vitamin E-TPGS. Error bars represent standard deviation of 200 diameter measurements made from 2 images on a single batch. Scale bar represents 5 μm (A-C) and 200 nm (D).Click here to view larger image.
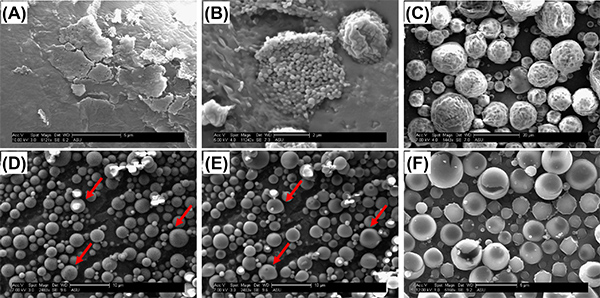
Figure 4. Surface morphology artifacts observed with SEM. In (A), heavy fusing and sheet-like structures were present throughout the entire sample. The concentration of Vitamin E-TPGS was too high (1%) to form discrete particles. In (B), some regions of the sample were fused, however, large pockets of discrete nanoparticles existed, particularly where there were gaps in the sputter coat. We believe these fusing artifacts are due to heating during the sputter coat process. In (C), particles initially appeared smooth, however, sustained exposure of the sample to the SEM beam resulted in dimpling and ruffling. (D) shows a poor resolution image that was captured with minimal exposure of the sample to the SEM beam; particles appear smooth with a round morphology. In (E), the same sample is exposed for a longer period of time, and obvious distortion of their original morphology is observed. In (F), a long beam exposure at a high voltage setting (12 kV) produced heating and cracking of the particles. Click here to view larger image.
Discussion
PLGA particles are commonly prepared by single- or double-emulsion, a method that provides the ability to customize particle characteristics such as size, encapsulant, and surface properties7. These properties and others depend on many variables, including solvent type, feed ratios, emulsification method, and emulsifier type. However, in our experience, it is possible for a single experimenter to produce particles with consistent properties. Using the same protocol, a well-trained experimenter produced seven separate batches of nanoparticles with the following mean diameters: 317 nm±99, 342 nm±112, 298 nm±104, 361 nm±110, 339 nm±115, 360 nm±123, and 364 nm±110. Averaging the well-trained experimenter's batches yields a mean diameter of 340 nm±25 and mean within-batch standard deviation of 110 nm±8. A second experimenter, trained by the first, used the same protocol to produce nanoparticles with an average diameter of 328 nm±138. However, a third experimenter, who had been making nanoparticles independently for several months, followed the same protocol to produce nanoparticles with an average diameter of 220 nm±70. Thus, it is possible to make particles with an expected range of diameters, but this depends on exact replication of subtle experimental technique. Pooling batches may enable production of large quantities of nanoparticles with identical aggregate properties. For example, when we surface modify nanoparticles for in vitro or in vivo study, multiple (up to 6) 200 mg batches are prepared, washed, collected, mixed into a single tube, and then divided for surface modification. This ensures that nanoparticle size, drug loading, charge, and fraction of surface sites available for modification will be comparable between two treatment groups. In another example, if the variable of interest is drug efficacy with different agents being loaded into different batches of nanoparticles, it is important to measure and control for variability in drug loading. It is critical that particle properties be measured for each batch of particles produced, and experiments to be designed and replicated to control for batch-to-batch variability.
Complete emulsion of the organic and aqueous phases is critical for forming small particles. Poly(vinyl alcohol) (PVA) is perhaps the most commonly used emulsifier. We and others have used a variety of emulsifying and stabilizing agents, including vitamin E-TPGS9, PVA14, spans15, and poloxamers16 (for thorough discussion of the wide range of agents used for production of PLGA particles, see review by Wischke et al.17). Properly emulsified polymer will appear as a homogenous, milky-white/opaque solution. A poor (or "broken") emulsion will show macroscopic heterogeneity or granularity, and it may even separate into two visually distinct layers in the tube. This generally indicates a failure to form nanoparticles. The emulsion may break following step 1.9 if it is not immediately transferred to the ultrasonicator. If this occurs, vortex again until homogenous and immediately proceed to the sonicator. Separation should not occur following the sonication step (1.10). Once the particles have been dispersed into a larger aqueous volume (step 1.11), the solution should be uniformly opaque to slightly translucent. The translucent quality will increase as particle size decreases, and a blue hue may be observed for very small nanoparticles. This hue might not be observed if particles encapsulate a drug. If the emulsion fails to disperse uniformly into the large aqueous volume or appears granular, the experiment should not proceed. It is normal to observe some variation in the appearance of the particle pellet, as well as its cohesion. Some pellets may resuspend upon mild vortexing, while others may take several minutes of water bath sonication. Resuspension should not take longer than 5 min. Lyophilized particles may take a variety of textures from cotton-like to free-flowing.
One of the many advantages of PLGA as a nanoparticle material is the ability to optimize the fabrication process to create the desired size of particle for the intended application. Larger nanoparticles will encapsulate a higher fraction of hydrophobic drug (relative to weight of polymer) than small nanoparticles, however, drug release kinetics may also be affected18-20. The size of nanoparticles has a direct effect on mechanisms of particle internalization by cells, as well as their distribution in tissue, which can result in dramatic differences in delivery effectiveness . For example, the mononuclear phagocyte system will tag and remove agents in systemic circulation that are larger than 1 μm. Small nanoparticles may be of interest for direct infusion into the brain, where larger nanoparticles would be trapped in the tight extracellular matrix; delivery of small nanoparticles might also facilitate passive targeting of tumors via the enhanced permeation and retention effect. Drug encapsulation efficiency varies widely, depending on the properties of the specific drug, the size of the particle, and the emulsifier (i.e. its solubility in water versus solvent). Single versus double emulsion will also affect drug loading and nanoparticle size. Encapsulation of hydrophobic agents via single emulsion may aid in the production of ultra-small nanoparticles, compared to the double emulsion method. We direct the reader to other resources for extensive discussion of this topic23-28. Lastly, alternative emulsification methods are available, including high-speed homogenization, and these other approaches may provide advantages for specific types of drugs or drug delivery applications29.
The single emulsion method presents an opportunity for variation of a wide range of formulation variables, each of which are capable of altering nanoparticle properties. For example, using dichloromethane (DCM) as a solvent instead will generally produce larger nanoparticles with a broader size distribution. Since ethyl acetate (EtAc) is miscible in water, the surface tension of the polymer droplet in the primary emulsion is decreased, producing smaller nanoparticles. DCM may be substituted for the same volume of EtAc. Alternative solvents or blends of solvents may be used to optimize drug encapsulation and particle properties. Other formulation parameters are also capable of altering particle size: for example, increasing solvent volume, solvent:polymer ratio, sonication intensity, or speed/duration of centrifugation will all result in a decrease in the size of collected particles. It is possible to size fractionate particles by performing sequential centrifugation (e.g. a quick, low speed centrifugation to first remove larger particles, followed by a longer spin to collect ultra-small particles) or filtering .
Here, we describe formulation parameters that enable preparation of PLGA particles with average diameters ranging from 220 nm to 1.98 μm. These methods for producing particles composed of PLGA may be used to optimize particle design (size, encapsulant, and surface properties) for future drug delivery application in vitro or in vivo.
Disclosures
Authors have nothing to disclose.
Acknowledgements
The authors have no acknowledgements.
Materials
| Name | Company | Catalog Number | Comments |
|---|---|---|---|
| Poly(lactic co-glycolic acid) (PLGA) |  Lactel Lactel | B6010-2P | Inherent Viscosity: 0.55-0.75 dl/g |
| Ethyl acetate (EtAc) | Sigma | 270989 | |
| Methylene chloride (DCM) | |||
| Vitamin E TPGS | Sigma | 57668 | |
| Poly(vinyl alcohol) | 87-89% hydrolized, 30,000-70,000 Da | ||
| Equipment | |||
| Sonic Dismembrator | Fisher Scientific | Model 705 | 700 W (Ultrasonicator) |
| Sonicator tip | Fisher Scientific | 1/8 in | |
| Vortexer | VWR | 58816-121 | |
| Multiposition stirrer | Corning | MP5I | |
| Ultracentrifuge | Beckman-Coulter | L8-80M | |
| Fixed angle rotor | Beckman-Coulter | 50.2TI | |
| Water bath sonicator | Fisher Scientific | FS30 | |
| Lyophilizer | Millrock | BT85 |
References
- Peer, D., et al. Nanocarriers as an emerging platform for cancer therapy. Nat. Nanotechnol. 2, 751-760 (2007).
- Jiang, W., Gupta, R. K., Deshpande, M. C., Schwendeman, S. P. Biodegradable poly(lactic-co-glycolic acid) microparticles for injectable delivery of vaccine antigens. Adv. Drug Deliv. Rev. 57, 391-410 (2005).
- Haag, R., Kratz, F. Polymer therapeutics: Concepts and applications. Angew. Chem. 45, 1198-1215 (2006).
- Tong, R., Cheng, J. Anticancer polymeric nanomedicines. Polym. Rev. 47, 345-381 (2007).
- Kumari, A., Yadav, S. K., Yadav, S. C. Biodegradable polymeric nanoparticles based drug delivery systems. Colloids and Surf. B Biointerfaces. 75, 1-18 (2010).
- Anderson, J. M., Shive, M. S. Biodegradation and biocompatibility of PLA and PLGA microspheres. Adv. Drug Deliv. Rev. 28, 5-24 (1997).
- Jain, R. A. The manufacturing techniques of various drug loaded biodegradable poly(lactide-co-glycolide) (PLGA) devices. Biomaterials. 21, 2475-2490 (2000).
- Danhier, F., et al. PLGA-based nanoparticles: An overview of biomedical applications. J. Control. Rel. 161, 505-522 (2012).
- Mu, L., Feng, S. S. A novel controlled release formulation for the anticancer drug paclitaxel (Taxol): PLGA nanoparticles containing vitamin E TPGS. J. Control. Rel. 86, 33-48 (2003).
- Mu, L., Feng, S. S. PLGA/TPGS nanoparticles for controlled release of paclitaxel: effects of the emulsifier and drug loading ratio. Pharm. Res. 20, 1864-1872 (2003).
- Collnot, E. M., et al. Vitamin E TPGS P-glycoprotein inhibition mechanism: influence on conformational flexibility, intracellular ATP levels, and role of time and site of access. Mol. Pharm. 7, 642-651 (2010).
- Dintaman, J. M., Silverman, J. A. Inhibition of P-glycoprotein by D-alpha-tocopheryl polyethylene glycol 1000 succinate (TPGS). Pharm. Res. 16, 1550-1556 (1999).
- Zhou, J., et al. Highly-penetrative, drug-loaded nanocarriers improve treatment of glioblastoma. Proc. Natl. Acad. Sci. U.S.A.. , (2013).
- Cartiera, M. S., Johnson, K. M., Rajendran, V., Caplan, M. J., Saltzman, W. M. The uptake and intracellular fate of PLGA nanoparticles in epithelial cells. Biomaterials. 30, 2790-2798 (2009).
- Niwa, T., Takeuchi, H., Hino, T., Nohara, M., Kawashima, Y. Biodegradable submicron carriers for peptide drugs: Preparation of dl-lactide/glycolide copolymer (PLGA) nanospheres with nafarelin acetate by a novel emulsion-phase separation method in an oil system. Int. J. Pharm. 121, 45-54 (1995).
- Ameller, T., et al. Polyester-poly(ethylene glycol) nanoparticles loaded with the pure antiestrogen RU 58668: physicochemical and opsonization properties. Pharm. Res. 20, 1063-1070 (2003).
- Wischke, C., Schwendeman, S. P. Principles of encapsulating hydrophobic drugs in PLA/PLGA microparticles. Int. J. Pharm. 364, 298-327 (2008).
- Batycky, R. P., Hanes, J., Langer, R., Edwards, D. A. A theoretical model of erosion and macromolecular drug release from biodegrading microspheres. J. Pharm. Sci. 86, 1464-1477 (1997).
- Panyam, J., et al. Polymer degradation and in vitro release of a model protein from poly(D,L-lactide-co-glycolide) nano- and microparticles. J. Control. Rel. 92, 173-187 (2003).
- Siepmann, J., Faisant, N., Akiki, J., Richard, J., Benoit, J. P. Effect of the size of biodegradable microparticles on drug release: Experiment and theory. Journal of Controlled Release. 96, 123-134 (2004).
- Desai, M. P., Labhasetwar, V., Walter, E., Levy, R. J., Amidon, G. L. The mechanism of uptake of biodegradable microparticles in Caco-2 cells is size dependent. Pharm. Res. 14, 1568-1573 (1997).
- Alexis, F., Pridgen, E., Molnar, L. K., Farokhzad, O. C. Factors affecting the clearance and biodistribution of polymeric nanoparticles. Mol. Pharm. 5, 505-515 (2008).
- Barichello, J. M., Morishita, M., Takayama, K., Nagai, T. Encapsulation of hydrophilic and lipophilic drugs in PLGA nanoparticles by the nanoprecipitation method. Drug Dev. Ind. Pharm. 25, 471-476 (1999).
- Mundargi, R. C., Babu, V. R., Rangaswamy, V., Patel, P., Aminabhavi, T. M. Nano/micro technologies for delivering macromolecular therapeutics using poly(d,l-lactide-co-glycolide) and its derivatives. J. Control. Rel. 125, 193-209 (2008).
- Niwa, T., Takeuchi, H., Hino, T., Kunou, N., Kawashima, Y. Preparations of biodegradable nanospheres of water-soluble and insoluble drugs with D,L-lactide/glycolide copolymer by a novel spontaneous emulsification solvent diffusion method, and the drug release behavior. J. Control. Rel. 25, 89-98 (1993).
- Yang, Y. Y., Chia, H. H., Chung, T. S. Effect of preparation temperature on the characteristics and release profiles of PLGA microspheres containing protein fabricated by double-emulsion solvent extraction/evaporation method. J. Control. Rel. 69, 81-96 (2000).
- Yang, Y. Y., Chung, T. S., Ping Ng, N. Morphology, drug distribution, and in vitro release profiles of biodegradable polymeric microspheres containing protein fabricated by double-emulsion solvent extraction/evaporation method. Biomaterials. 22, 231-241 (2001).
- Zhang, Z., Feng, S. S. The drug encapsulation efficiency, in vitro drug release, cellular uptake and cytotoxicity of paclitaxel-loaded poly(lactide)-tocopheryl polyethylene glycol succinate nanoparticles. Biomaterials. 27, 4025-4033 (2006).
- Astete, C. E., Sabliov, C. M. Synthesis and characterization of PLGA nanoparticles. J. Biomater. Sci. Polym. Ed. 17, 247-289 (2006).
- Gaumet, M., Gurny, R., Delie, F. Fluorescent biodegradable PLGA particles with narrow size distributions: Preparation by means of selective centrifugation. Int. J. Pharm. 342, 222-230 (2007).
Reprints and Permissions
