Drug resistance testing for HIV-1 infected individuals failing antiretroviral therapy (ART) can guide future therapies and improve treatment outcomes. Optimizing individual and population health outcomes in high HIV prevalence but resource-limited settings will ultimately require affordable and accessible drug resistance genotyping and interpretation methods.
Method Article
An Affordable HIV-1 Drug Resistance Monitoring Method for Resource Limited Settings
In This Article
Summary
Abstract
HIV-1 drug resistance has the potential to seriously compromise the effectiveness and impact of antiretroviral therapy (ART). As ART programs in sub-Saharan Africa continue to expand, individuals on ART should be closely monitored for the emergence of drug resistance. Surveillance of transmitted drug resistance to track transmission of viral strains already resistant to ART is also critical. Unfortunately, drug resistance testing is still not readily accessible in resource limited settings, because genotyping is expensive and requires sophisticated laboratory and data management infrastructure. An open access genotypic drug resistance monitoring method to manage individuals and assess transmitted drug resistance is described. The method uses free open source software for the interpretation of drug resistance patterns and the generation of individual patient reports. The genotyping protocol has an amplification rate of greater than 95% for plasma samples with a viral load >1,000 HIV-1 RNA copies/ml. The sensitivity decreases significantly for viral loads <1,000 HIV-1 RNA copies/ml. The method described here was validated against a method of HIV-1 drug resistance testing approved by the United States Food and Drug Administration (FDA), the Viroseq genotyping method. Limitations of the method described here include the fact that it is not automated and that it also failed to amplify the circulating recombinant form CRF02_AG from a validation panel of samples, although it amplified subtypes A and B from the same panel.
Introduction
The HIV epidemic in southern Africa has been evolving rapidly1 with a concomitant exponential increase in individuals on antiretroviral therapy (ART), especially in South Africa2,3. As evidence on the epidemiologic impact of large scale treatment programs in reducing incidence4 and increasing life expectancy in resource-limited settings (RLS)5 continues to accumulate, efforts to increase ART coverage will be intensified. The evolution of guidelines towards the use of treatment as a prevention tool6,7 under the test and treat programs means that the absolute number of individuals on treatment will further increase. Large numbers of individuals will be on ART for longer periods of time as the average life expectancy of individuals on ART nears that of the HIV uninfected population8. The development and transmission of HIV drug resistance has always been considered a threat to the achievements of ART9-12. Thus, there is a need for more rigorous surveillance and monitoring of drug resistance as more individuals are initiated onto ART.
Genotypic drug resistance testing (GRT) has been used successfully in developed countries, both for surveillance as well as monitoring of HIV-1 drug resistance in individuals receiving ART. In these settings, GRT has been integrated into the continuum of care for HIV-1 infected individuals. Most international guidelines recommend GRT for adult or pediatric patients failing ART (first-line and second-line)13-15, pediatric patients exposed to prevention of mother-to-child transmission (pMTCT) regimens but subsequently infected16, and in settings with high-levels of transmitted drug resistance among acutely infected individuals13-15. However, the cost, technology, and infrastructure requirements have limited the implementation of similar approaches to drug resistance monitoring in RLS.
The South African HIV treatment and monitoring guidelines do not currently recommend the use of GRT in guiding choice of ART for individuals failing first-line regimens17. Individuals are switched based primarily on virological (HIV-1 RNA viral load) parameters. However in 2012, the Southern African HIV Clinicians Society published the first Southern African ARV drug resistance testing guidelines18. These guidelines recommend GRT testing for all adults failing first-line and second-line ART and for infected infants and children exposed to pMTCT18. However, GRT is not recommended18 for acutely infected individuals because there is no current evidence for high levels of transmitted drug resistance in southern Africa19-29. It is expected that some of these recommendations will be integrated over time into the national treatment and monitoring guidelines of the various countries in the region. Already, in the 2013 South African treatment guidelines there is now recommendation of GRT at time of second-line failure for adults and at time of first- or second-line PI-based regimen failure for children30.
It has been shown that incorporating GRT into treatment guidelines in South Africa would be potentially cost-neutral. Considering the cost of the second line regimen drugs which are relatively more expensive than the first line drugs, using GRT to identify patients who truly need to be switched to second line therapy will not result any additional cost to the program. In addition, GRT can also identify other reasons for failure, conserve treatment options and generate information about emerging resistance patterns31. Therefore, it is necessary to reduce the cost of drug resistance monitoring methods even further in order to improve access, quality of care and outcomes.
Here, we present a GRT method designed to use generic (open source) primers for reverse transcription, polymerase chain reaction (PCR) and sequencing (Table 1), as well as mostly open source software for drug resistance interpretation. For clinical management, the protocol is complimented by a comprehensive review and reporting method with specialist interpretation of the laboratory drug resistance report with close adherence to the national treatment guidelines. The protocol is divided into four different components; 1) HIV Ribonucleic Acid (RNA) Extraction, 2) Reverse Transcription and Polymerase Chain Reaction (PCR) amplification of viral targets, 3) Sequencing and 4) Bioinformatics methods for analysis of chromatograms, alignment, curation and interpretation of sequence data.
Protocol
1. Ethylenediaminetetraacetic Acid (EDTA) Whole Blood Processing
Note: Blood can be processed immediately after collection of can be stored at 4 °C for no more than 24 hr.
- Working in a biosafety cabinet, allow the EDTA whole blood sample to reach room temperature.
- For each sample, label enough cryovials with the sample identification (ID), storage material (plasma), and date.
- Centrifuge the samples for 10 min at 1,000 x g. Do not use brakes to stop centrifuge. This will yield three layers (from top to bottom): plasma, leucocytes (buffy coat) - a very thin layer - and erythrocytes, including platelets.
- Carefully aspirate the supernatant (plasma) and aliquot 500 ml into each cryovial. Take care not to disrupt the cell layer (buffy coat) or transfer any cells.
- Store at -80 °C until needed for RNA extraction or proceed to RNA extraction immediately.
2. RNA Extraction
- Prepare an extraction worksheet with the IDs of the samples to be extracted including positive and negative plasma controls.
- For each sample to be extracted, label a 1.5 ml sterile microcentrifuge tube with the sample ID, extraction date and “RNA”. Also label an assembled column and collection tube as well as a 2 ml microcentrifuge tube containing working lysis solution with corresponding numbers from the extraction worksheet.
- Working in the Bio-Safety Cabinet, add 200 µl sample to the corresponding 2 ml microcentrifuge tube of working lysis solution.
- Vortex well and incubate for 10 min at room temperature.
- After 10 min, centrifuge the tube briefly.
- Add 800 ml of absolute ethanol to each of the tubes.
- Mix by pulse vortexing and briefly centrifuge.
- Transfer 600 µl of this solution to the corresponding column/collection tube assembly. Centrifuge at 6,000 x g for 1 min.
- Transfer column to a new collection tube and discard the old collection tube containing the filtrate. Repeat the above step 2.8 (above) twice more.
- Add 500 µl wash buffer AW1 to each column and centrifuge at 6,000 x g for 1 min.
- Discard the filtrate and collection tube and transfer the column to a new collection tube.
- Add 500 µl was buffer AW2 and centrifuge at 20,000 x g for 3 min. Repeat step 2.11.
- Centrifuge in a new collection tube at 20,000 x g for an additional 2 min.
- Discard filtrate and place column in 1.5 ml microcentrifuge tube.
- Add 60 µl Buffer AVE (RNase free water) to the middle of the column ensuring that you do not dispense the liquid on the side of the column.
- Incubate at room temperature for 1 min.
- Centrifuge at 6,000 x g for 2 min.
- Discard the column and cap the 1.5 ml microcentrifuge tubes.
- The samples are now ready for reverse transcription.
- If testing is to be performed immediately, store at 4 °C for up to 6 hr. However, if testing is to be delayed then place at -80 °C immediately. NB: do not freeze/thaw the samples more than 3x.
3. Reagent Preparation for Reverse Transcription
- Before starting, calculate the volumes of each of the reagents required for the number of samples being processed including, the positive and negative plasma controls. Also add a reagent control.
- Using the calculated volumes from step 3.1 (above), prepare the deoxyribonucleotide triphosphate (dNTP)-primer mix in a clean, sterile 200 µl PCR tube followed by briefly pulse vortexing. Each sample should have 0.5 µl of the reverse primer RT21 and 0.5 µl of the dNTP, see Table 2.
- Aliquot 1.0 µl of the dNTP-primer mix to 200 µl PCR tubes.
- Prepare reverse transcriptase (RT) enzyme mix by adding 1 µl of the 10x reverse transcription buffer, 1 µl of 0.1M DTT and 2 µl of 25mM MgCl2 to a sterile tube followed by vortexing and briefly centrifuging, see Table 3.
- Add 0.5 µl each of the enzymes RNAseOUT and Superscript III reverse transcriptase to the enzyme mix tube then tap the tube gently to mix.
- Keep the tubes with the dNTP-primer mixes and enzyme mix on a cold block and move to the RNA station.
4. Reverse Transcription
- Add 6 µl of the RNA sample to the dNTP-primer mix tube followed by briefly vortexing to mix.
- After the addition of the RNA, move to the PCR room with both dNTP/primer/RNA mix and RT Enzyme mix tubes on a cold block or ice.
- Briefly centrifuge the dNTP/primer/RNA mix tubes (from step 4.2) and place them into a thermocycler.
- Heat at 65 °C for 5 min to denature the RNA.
- Rapidly cool to 4 °C, hold for 2 min.
- Pause the thermocycler while still at 4 °C; take out the tubes.
- Quickly add 5 µl of the enzyme mix while keeping the tubes on a cold block.
- Mix gently by tapping the tube then briefly centrifuge the tubes and return to the thermocycler.
- Hold the tubes at 50 °C for 60 min to reverse transcribe the RNA followed by enzyme denaturation at 85 °C for 5 min to stop the reverse transcription.
- Cool to 37 °C. As soon the temperature gets to 37 °C, pause and take the tube out of the thermocycler.
- Quickly add 0.5 µl of RNAse H to the tubes and return to the thermocycler.
- Hold at 37 °C for 20 min and then cool to 4 °C.
- The complementary DNA (cDNA) can be used immediately or can be stored at -20 °C or colder until needed. However, the long term storage of cDNA should be at -80 °C.
5. Reagent Preparation for PCR
- Before starting, calculate the volumes of each of the reagents required for the number of samples being processed and the controls. In addition to the three controls (Positive, Negative, and Reagent), you can also add a PCR control (HIV DNA). The first and second round PCR mixes can be prepared simultaneously and the second master mix stored at -20 °C until needed. Mixes can be stored for approximately 8 hr.
- Add 18.4 µl water, 2.5 µl 10x buffer, 1.0 µl MgCl2, 0.5 µl dNTPs, and 0.25 µl of each of the primers as shown on Table 4 and vortex.
- Add 0.1 µl of Platinum Taq polymerase (5U/µl) and gently mix the tube by tapping it.
- Aliquot 23 μl of the master mix to 200 μl PCR tubes.
- With the master mix tubes on a cold block or ice move to the PCR room.
6. Nested PCR
- Add 2 µl of the cDNA to 23 µl of the 1st round PCR master mix.
- Close the tubes, put the samples in the thermocycler and use the following PCR cycling conditions: 94 °C for 2 min, 30 cycles of 95 °C for 30 sec, 58 °C for 20 sec, and 72 °C for 2 min, followed by a final extention at 72 °C for 10 min as shown on Figure 1.
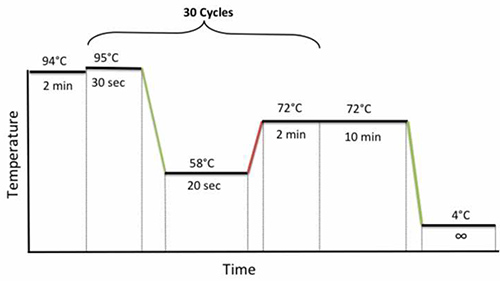
Figure 1. Nested PCR cycling conditions. Click here to view larger image.
- Continue to the 2nd round PCR stage or store the 1st round PCR products at -20 °C or colder until required at a later stage.
- For 2nd round PCR, add 2 µl of the 1st round PCR product to 23 µl of the 2nd round PCR master mix and use the same PCR program on Figure 1.
7. Gel Electrophoresis
- Gel preparation
- Add a 0.5 g of agarose tablet to a 250 ml glass flask and add 50 ml of 1x TBE buffer to the flask.
- Heat in microwave to boiling; swirl frequently (approximately every 30 sec) until completely solubilized. Use a silicone grip or silicone oven glove to grasp the hot flask. The agarose solution can boil out of the flask very easily so closely monitor this process.
- Cool at room temperature for approximately 10 min.
- Pour agarose into a gel casting tray containing appropriate size comb; gel is ready to use in approximately 20-30 min.
- Place gel in electrophoresis chamber and run as recommended by the manufacturer.
- Gel electrophoresis and visualization.
- Vortex Novel Juice for 10 sec prior to use.
- Dilute 1 µl of Novel Juice with 5 µl of DNA sample and mix.
- Dilute 3 µl of Novel Juice with 3 µl of molecular weight marker and mix.
- Load the mixes from sections 7.2.2 and 7.2.3 (above) and run the gel at 100 V and 400 mA for 40 min to evaluate the PCR amplification.
- Positive amplification can be visualized under UV light as 1,315 bp fragment, Figure 2.
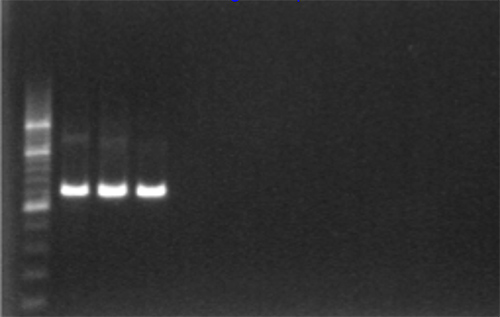
Figure 2. Gel confirmation of PCR amplification using 1% agarose gel electrophoresis and a 200 bp ladder. Click here to view larger image. - There should be no amplification in the Negative and reagent controls, thus indicating absence of contamination.
8. PCR Product Cleanup
- In preparation for the sequencing reaction, the positive second round PCR products are cleaned up using the PureLink PCR purification kit.
- Add 80 μl of working Binding buffer High-Cutoff (B3) to 20 µl of PCR product and pipette mix.
- Add the sample mixed with the binding buffer to a spin column in a collection tube.
- Centrifuge the column at 10,000 x g for 1 min. Transfer the column into a new collection tube.
- Wash the column with 650 µl of Wash Buffer with ethanol.
- Centrifuge the column at 10,000 x g for 1 min. Transfer the column into a new collection tube.
- Centrifuge the column at maximum speed for 2-3 min to remove any residual wash buffer.
- Place the spin column in a clean 1.7 ml elution tube supplied with the kit.
- Add 40 µl of elution buffer to the center of the column and incubate the column at room temperature for 1 min.
- Centrifuge the column at maximum speed for 2 min (>10,000 x g).
- The elution tube contains your purified PCR product ready for sequencing. Discard the column.
- Determine the concentration and quality of the DNA using a Nanodrop.
- If no in-house sequencing facilities are available, the purified PCR products can be sent to a commercial sequencing lab at this stage.
9. Sequencing Reactions
- The PCR products are sequenced using the big dye terminator kit version 3.1 and 4 primers for each sample (two forward and two reverse). The primer sequences are shown in Table 2. Therefore, after the sequencing run, each sample will have four sequences to be assembled into a contig.
- Set up the sequencing reactions as indicated in Table 5 for each of the four primers.
- Mix the sequencing buffer and the primers by vortexing before use.
- Mix the water, buffer and primer before the addition of the big dye sequencing. Mix by vortexing.
- Gently mix the master mix after adding the big dye sequencing mix by inverting the tube or tapping it gently.
- Aliquot 9 µl of the master mix into a 96-well optical plate.
- In order to run 24 samples/plate, set up the plate as indicated below Figure 3.
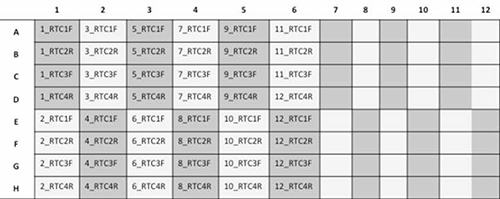
Figure 3. Scheme representation of a 96-well plate with 12 patient samples being sequenced with 4 primers each (RTC1F, RTC2R, RTC3F, and RTC4R). Click here to view larger image.
- Add 1.0 µl of the DNA sample (~20-40 ng), cover the plate with an adhesive aluminum cover and then gently mix it.
- Centrifuge at 3,000 x g for 1 min. Remove the aluminum cover and add a rubber sealing mat.
- Place the plate on the thermocycler and run the following cycling program shown in Figure 4.
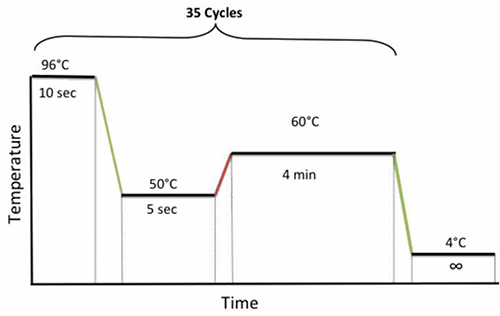
Figure 4. PCR cycling conditions for sequencing. Click here to view larger image.
- When the PCR finishes, clean up the sequencing product immediately.
10. Sequencing Cleanup
- For each sequencing reaction, mix 50 μl absolute ethanol and 5 μl 3 M sodium acetate.
- Using a multichannel pipette, add 55 μl of the sodium acetate/EtOH solution to each well.
- Seal wells with adhesive aluminum cover, ensuring that each well is sealed properly.
- Centrifuge at 3,000 x g for 20 min.
- After 20 min, remove cover and invert the plate, in one smooth motion, onto a folded lab tissue (DO NOT bang to get rid of supernatant as this will dislodge the pellet!).
- Centrifuge the inverted plate on the same tissue at 150 x g for 2 min.
- Immediately add 150 μl cold 70% EtOH. DO NOT delay addition of ethanol at this step.
- Seal with the same adhesive aluminum cover and vortex.
- Centrifuge at 3,000 x g for 5 min.
- Invert plate onto a new folded tissue and centrifuge inverted at 150 x g for 1 min.
- After the centrifugation, place uncovered in thermocycler and dry it at 50 °C for 2 min.
- Once the plates is dry, seal it with adhesive foil covers, wrap in foil and store at -20 ˚C until ready to proceed with the sequencing electrophoresis.
- When ready to sequence, dissolve cleaned sequencing products in 10 ml Hi-Di formamide, denature and load for electrophoresis.
11. Bioinformatics
- Sequence Assembly
- Launch the program Geneious.
- Create a working folder to store the sequences.
- Import the ABI files generated by the sequencing machine to the working folder using the import tool. Geneious will allocate percentage quality score for each sequence imported.
- Open sequences with quality scores >70% by double clicking on them.
- Each file should open in a new window. The software will indicate the quality at each nucleotide position of the chromatogram of the sequence quality using light blue bars. The higher the bar, the better the quality of the base call.
- Using the cursor, select the mid section of the sequence leaving out the ends, which are usually of poor quality.
- Click on the extract button to extract the region with good quality sequence.
- Select all four extracted sequences for each sample and assemble them against a reference sequence.
- Inspect the assembled sequence to ensure that you are in the correct reading frame. If you are in the correct reading frame, the beginning of Protease should start with the following amino acids: PQITLW. The beginning of RT will start with PISPIE.
- Extract the contig region covering the beginning of PR to the 300th RT codon. During this process, also check for insertions or deletions.
- Go through the consensus sequence of the extracted contig, identifying any ambiguities and verify positions with mixed bases by inspecting quality (symmetry, height, background and shoulders of flanking regions) of the base calls.
- Select the consensus sequence and click the extract button to create a separate file of the consensus sequence from the four primers and label it appropriately.
- Export the sequence to a backup storage folder on the computer or a network folder.
- Sequence Quality Assessment (HIVDB)
- Analyze the sequence using the HIVDB program at http://hivdb.stanford.edu.
- Check for deletions and insertions in the summary data and ensure that the sequence covers all the 99 protease (PR) codons and the 1st 300 RT codons.
- Check for any highlighted quality assurance (QA) issues in both the PR and RT regions, such as stop codons, frame shifts, ambiguous positions and unusual residues.
- Sequencing Quality Control
- Blast the new sequence against a local sequence database from previous run.
- If the new sequence is >97% similar to any sequence in the database, all the stages of the protocol should be reviewed, starting with the sequence analysis and going back to the RNA extraction to ensure that there were no mix ups (sample switching, mislabeling) or contamination.
- If no problems are identified, repeat the analysis of both the old and new samples from the RNA extraction stage.
- If the sequences are still >97% similar, review the patient history to assess for any epidemiologic linkage between the individuals.
- Phylogenetic Analysis
- Align all the sequences from the database using ClustalW program in Geneious.
- Manually check the alignment for misaligned sequences, deletions and insertions and edit accordingly.
- Construct a phylogenetic tree using PHYML, Geneious tree builder or other tree builders in Geneious.
- Examine the tree for samples with short branch lengths.
- Review the samples with short branch lengths for possible contamination.
12. REGA DB Informatics
- Sequence Upload
- Log into the RegaDB using a unique username and password.
- On the drop down menu, under Patient ID, select “Begins with”.
- Add the patient ID and select the individual whose genotype is to be uploaded.
- On the menu to the left, select “viral isolate”.
- From the options under viral isolate select “add”.
- Enter the Sample date, Sample I.D, Sequence I.D and Sequence date.
- Select “choose file” and then navigate to the fasta file of the sequence to be uploaded.
- After selecting the fasta file to be uploaded, click on upload.
- Once the uploaded sequence appears in the nucleotide box under the sequence identifies and dates, click the ok button at the bottom right of the window.
- Check for PR and RT protein alignment by clicking the button protein and selecting either PR or RT.
- Check for the drug resistance mutation by clicking on the resistance button. This gives you the resistance profiles from three algorithms: ANRS, Stanford HIVDB and RegaDB.
- Report generation using REGA
- Log into the RegaDB using your unique username and password.
- On the drop down menu, under Patient ID, select “Begins with”.
- Add the patient ID and select the individual whose report is to be generated.
- On the menu to the right, select viral isolate.
- From the options under viral isolate click on “view”.
- Double click on the viral isolate for which you want to create a report.
- On the viral isolate window, click on the viral isolate report tab.
- Select the algorithms for the interpretation of the genotype from the drop down menu and then select report template to use.
- Once the algorithm and the template are selected, click on the button “generate”.
- Download the rtf document generated.
- Open the rtf document as a word document.
- Resize the treatment history chart.
- After the chart, add the section “Clinical chart and resistance interpretation”.
- Using the data on the resistance table and the clinical chart, add a description of the patient’s resistance profile starting with the patient’s treatment history, and the drugs to which the viral isolate is resistant. Also add a description of the patient’s viral load and CD4+ cell count profiles from the chart.
- Send the report to the Infectious Diseases (ID) specialist for review and recommendations on future patient management. This process is also a very important quality assurance stage. Any errors in the genotype or inconsistences in the treatment history, virological and immunological profiles can be identified and reviewed before a final report is sent, with all the recommendations, to the clinician managing the patient.
Results
The method validated was a modification of a previously reported method20. The Viroseq genotyping method, which has been approved by FDA, was used as the reference method in the validation. A panel of proficiency testing samples obtained from the French National Agencies for Research on AIDS and Viral Hepatitis (ANRS) was used in the primary comparison between the two methods. The two genotyping methods were 100% concordant in identifying all clinically important drug resistance-associated mutations as interpreted by the HIVDB program for the samples that were successfully amplified by both methods. As shown in Table 6, the nucleotide sequences of the three pairs were 99.5% identical. The predicted amino acid sequences were 100% identical. One sample out of five could not be successfully amplified by Viroseq. In addition to the sample not amplified by Viroseq, the in-house method failed to amplify a second sample which was shown to be a circulating recombinant virus (CRF02_AG) by Viroseq. The three samples that amplified with both methodologies were subtype B (two samples) and subtype A (one sample).

Figure 5. Use of a HKY Neighbor Joining tree done as part of sequence quality assurance. There are four pairs/clusters of sequence with very short genetic distances. The genetic distance between RES655 and RES655_1 (same samples sequenced on different days) is 0.003. The is a potential error with the RES637_1/RES638 pair as their genetic distance is too short (0.075 ) for samples from different epidemiologically unlinked individuals. There is another RES637 on the tree with a distance of 0.075 when compared to RES638_1. The CQ01/CQ02 cluster suggests that the two samples from the panel are duplicates of the same sample. They cluster together with the subtype B reference sequence confirming the subtype assigned by the REGA Subtyping tool. CQ05 and CQ04 clustered with subtypes A and G respectively, whereas the REGA subtyping tool classified them as A and CRF02_AG respectively. Another useful tool for HIV subtyping and recombination is SCUEL, which is available at http://www.datamonkey.org. Click here to view larger image.
A panel of five samples was used to assess the precision of the in-house method. Ten replicate genotypes were generated for each of the five samples. Using the 16 Capillary 3130xl genetic analyzer, 48 of the 50 genotypes were generated from 24 runs, prepared on the same day. For all five samples, the predicted amino acid sequences were 100% concordant amongst replicates. For the nucleic acid sequences, there was >99% pairwise similarity.
During the first two years of the use of this method, sixty samples were repeated randomly from RNA extraction to sequencing. There were no statistically significant differences between the sequence quality score and the number of mixed bases between the replicates. Both the nucleotide and amino acid pairwise comparisons for the sixty pairs were greater than 99% identical. Thus the drug resistance mutations for all the pairs were 100% concordant.
Cost reduction
The reaction volumes for RT, PCR and sequencing were reduced by at least half, relative to the original method20,32, without compromising on the quality of the sequences generated. This enabled a reduction in cost of 50% for the RT and PCR stages.
The new method was originally designed to work with six sequencing primer to sequence all 99 codons of the protease gene and the first 300 codons of the reverse transcriptase gene20,32. Similar methods also use six to eight primers33,34. Some recently published methods have used less than six primers, although sometimes sequencing the protease and RT genes seprately35,36. We sought to reduce the number of sequencing primers from six to four, (Figure 6)
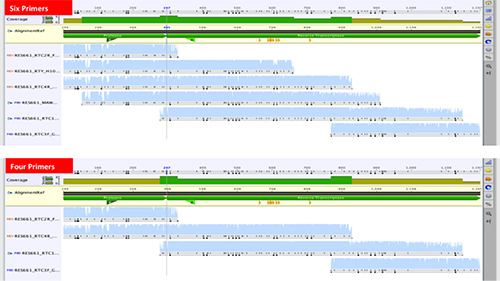
Figure 6. Comparison of contiguous sequences from six vs four sequencing primers for the generation of the 1197 bp pol sequence covering all 99 HIV-1 protease codons and the first 300 codons of the reverse transcriptase gene. Click here to view larger image.
Sequences from a set of 17 samples generated from six primers were compared to sequences generated after exclusion of two primers (MAW46 and RTY). The subtypes were 14 subtype C, two subtype B, and one subtype A. There were no significant differences in sequence quality scores. Again, the average pairwise identity between the 17 pairs of nucleic acid was 99% and 100% on the amino acid level. Thus, reducing the sequencing primers from six to four resulted in a reduction in the sequencing cost by almost a third.
The only proprietary software tool used in this protocol was Geneious for sequence assembly. The drug resistance interpretation tools, as well as the report generating tools are all free, open access tools. This reduces the cost further by eliminating the costs associated with the use of proprietary software. Further, collective negotiation allowed the reagents for this protocol to be packaged into a kit for easy access from Life Technologies and is available as the SATuRN/Life Technologies genotyping method 37. Furthermore, SATuRN members can access the reagents at a discounted price.
Clinical Setting
The described protocol has been implemented in the monitoring and surveillance of drug resistance in a rural community in KwaZulu-Natal. A total of 604 genotypes were generated from clinical samples between December 2010 and May 2013 at an amplification rate of 95% for samples with viral loads >1,000 RNA copies/ml. This clinical HIV drug resistance study was approved by the Biomedical Research Ethics Committee of the University of KwaZulu-Natal (ref. BF052/10) and the Health Research Committee of the KwaZulu-Natal Department of Health (ref. HRKM 176/10). Individual patient reports were generated and sent back to the clinics for patient management.
Seventy two (72) genotypes were also generated as part of a surveillance of transmitted drug resistance study, nested within a large prospective population-based HIV surveillance study. The primary samples were needle prick whole blood collected in EDTA microtubes. At genotyping there was an amplification rate of 79%19. Ethics approval for the genotyping of samples from the surveillance study was obtained from the University of KwaZulu-Natal Biomedical Research Ethics Committee (ref. BE066107).
| Primer Name | Sequence | Length | Direction | HXB2 Position | |
| MAW-26 | TTGGAAATGTGGAAA GGAAGGAC | 23 | Forward | 2028-2050 | 1st round PCR |
| RT-21 | CTGTATTTCAGCTATC AAGTCCTTTGATGGG | 31 | Reverse | 3539-3509 | 1st round PCR |
| Pro-1 | TAGAGCCAACAGCCC CACCA | 20 | Forward | 2147-2166 | 2nd round PCR |
| RT-20 | CTGCCAATTCTAATTC TGCTTC | 22 | Reverse | 3462-3441 | 2nd round PCR |
| RTC1F | ACCTACACCTGTCAA CATAATTG | 23 | Forward | 2486-2508 | Sequencing |
| RTC2R | TGTCAATGGCCATTG TTTAACCTTTGG | 27 | Reverse | 2630-2604 | Sequencing |
| RTC3F | CACCAGGGATTAGAT ATCAATATAATGTGC | 30 | Forward | 2956-2994 | Sequencing |
| RTC4R | CTAAATCAGATCCTAC ATACAAGTCATCC | 29 | Reverse | 3129-3101 | Sequencing |
| RT-y | GTGTCTCATTGTTTAT ACTAGG | 22 | Reverse | 2967-2946 | Sequencing |
| MAW-46 | TCCCTCAGATCACTC TTTGGCAACGAC | 27 | Forward | 2251-2277 | Sequencing |
Table 1. Reverse transcription, PCR, and sequencing custom primers used in the generation of a 1197 bp pol fragment covering all the 99 HIV-1 Protease codons and the first 300 codons of the reverse trascriptase gene.
| RT21 (5pmol/ml) | 0.5 | 0.2 |
| dNTP (10 mM) | 0.5 | 0.4 |
| Total | 1 |
Table 2. dNTP/Primer mix for the reverse transcription reaction.
| Reagent | Volume (ml)/reaction | Concentration/reaction |
| First Strand Buffer (10x) | 1 | 1 |
| MgCl2 (25 mM) | 2 | 4 |
| DTT (0.1 M) | 1 | 0.008 |
| RNaseOUT (40 U/ml ) | 0.5 | 16 |
| Superscript III Reverse Transcriptase (200U/ml ) | 0.5 | 8 |
| Total | 5 |
Table 3. Enzyme mix for the reverse transcription reaction.
| Reagent | Volume (ml)/reaction | Final Concentration/Reaction |
| DEPC treated water | 18.4 | - |
| PCR Buffer (10x) | 2.5 | 1 |
| MgCI2 (50 mM) | 1 | 2 |
| dNTP mix (10 mM) | 0.5 | 0.2 |
| Froward primer (5 pmol/ml) | 0.25 | 0.05 |
| Reverse primer (5 pmol/ml) | 0.25 | 0.05 |
| Platinum Taq Polymerase (5 U/ml) | 0.1 | 0.02 |
| Subtotal | 23 | - |
Table 4. Master mix for the nested PCR.
| Reagent | Volume (ml)/reaction | Concentration/reaction |
| DEPC treated water | 6.1 | |
| Sequencing Buffer (5x) | 2 | 1 |
| Primer (3.2 pmol/ml) | 0.5 | 0.16 |
| Big Dye terminator Sequencing mix | 0.4 | - |
| Total | 9 |
Table 5. Master mix for the sequencing reactions.
| Viroseq | Inhouse | % NA Similarity | |||||||
| Sample I.D | Subtype | Quality score | PR Mutations | RT mutations | Subtype | Quality score | PR mutations | RT Mutations | |
| CQ01 | B | 99.9 | M46L, I54L, V82A, L90M | D67N, T69D, K70R, M184V, T215V, K219Q | B | 99.2 | M46L, I54L, V82A, L90M | D67N, T69D, K70R, M184V, T215V, K219Q | 100 |
| CQ02 | B | 99.5 | M46L, I54L, V82A, L90M | D67N, T69D, K70R, M184V, T215V, K219Q | B | 99.5 | M46L, I54L, V82A, L90M | D67N, T69D, K70R, M184V, T215V, K219Q | 100 |
| CQ03 | NA | NA | NA | NA | NA | NA | |||
| CQ04 | CRF02_AG | 98.4 | I54V, V82F, I84V | M41L, L74I, L210W, T215Y, V108I, Y181C | NA | NA | NA | NA | NA |
| CQ05 | A | 99.7 | K103N | A | 93 | K103N | 100 | ||
Table 6. Comparative results from a parallel analysis between the Viroseq genotyping method and the in-house method using a panel of samples provided by the ANRS.
Discussion
Several low cost in-house methods have been described in efforts to try to make HIV drug resistance genotyping more affordable33,34,36. There is no doubt of the need to integrate drug resistance testing into the continuum of care for individuals on antiretroviral therapy in resource-limited settings. However, most of the reported methods focus on the application of drug resistance genotyping in the surveillance of drug resistance at a population level. The SATuRN/Life Technologies genotyping method is a fully integrated protocol for surveillance and monitoring of drug resistance. This method was designed to be an affordable protocol implementing mostly open source and open access bioinformatics resources for the interpretation of drug resistance and generation of reports for clinical management.
It was shown through comparison with the FDA approved Viroseq genotyping method to be accurate in identifying drug resistance mutations from a panel of ANRS proficiency testing samples, in 100% of laboratory panel samples that were successfully amplified. The accuracy was also assessed on clinical samples of subtype C viruses, the most dominant subtype in southern Africa. The method was as accurate on subtype C samples as it was on subtype A and B. However, if the method would be used in other parts of the world where CRF02_AG is prevalent, there is a need for the modification of the primers since the method failed to amplify one of the panel samples that was shown to have CRF02_AG. Alternatively, a degenerate set of primers sensitive to all group M viruses33,36 could be used in regions where the subtype distribution is more heterogeneous38.
The sensitivity of the reverse transcription and PCR can be increased by extracting RNA from higher volumes of plasma, such as 500 ml. The plasma can be centrifuged at 21,000 x g for 90 min to concentrate the viral particles before proceeding with the protocol as described by the QIAamp viral RNA extraction mini kit.
As shown, the new method has an additional advantage that it produces comprehensive reports for individual patient management. These reports are a consolidation of the genotype, the immunological and virologic monitoring data as well as clinical and treatment history from RegaDB. This is accompanied by a detailed laboratory interpretation of the resistance profile followed by an equally detailed review of the patient’s clinical history as well as treatment recommendations. The use of a specialist physicians to review the reports and provide treatment recommendations for the patients provides the much-needed mentorship for nurse practitioners as well as inexperienced clinicians, who are increasingly providing ART in South Africa as part of the WHO recommendations for task shifting. These clinical reports have been shown to be effective teaching aids for clinicians with little or no experience in drug resistance management. From a patient perspective, our method reduces the need to travel to centralized sites to access specialist HIV services.
Thus, the described protocol taken as a whole provides a good platform through which HIV drug resistance management can be integrated, at an affordable cost, into the continuum of care for HIV infected individuals failing ART. The data generated can be used for epidemiological purposes to assess the evolution and transmission of drug resistance in the community. The size of the pol fragment generated is good enough for more complex phylogenetic analysis which will produce better understanding of the epidemic at population level.
Disclosures
This work was supported by the Wellcome Trust (082384/Z/07/Z), European Union (SANTE 2007 147–790), the US Centre for Diseases Control via CAPRISA (project title: Health Systems Strengthening and HIV Treatment Failure (HIV-TFC)), and the Swiss South African Joint Research Programme (SSJRP) research grant entitled "Swiss Prot / South Africa: Protein Bioinformatics Resource Development for Important Health-related Pathogens”. RL is supported by the Wellcome Trust (grant number 090999/Z/09/Z). The funders had no role in study design, data collection and analysis, decision to publish, or preparation of the manuscript. The authors declare no competing financial interests.
Acknowledgements
The authors would like to acknowledge all colleagues who made this work possible, especially Maya Balamane, Elizabeth Johnston White, Sharon Sjoblom, Greg Ording Zakhona Gumede, Xolile Kineri, Phindile Mabaso, Lungisa Ndwandwe, James Garvey, Gavin Cobb, Senzo Maphanga, Terusha Chetty, Kevi Naidoo, Andrew Skingsley, Katharine Stott, and Lungani Ndwandwe. The authors would also like to thank all the personnel of the Department of Health and Africa Centre personnel who work the Hlabisa HIV Treatment and Care Programme.
Materials
| Name | Company | Catalog Number | Comments |
|---|---|---|---|
| Superscript III 1st strand Synthesis kit | Life Technologies | 18080051 | Reverse Transcription |
| SATURN/LiFE Technologies Custom Primers | Life Technologies | 4473517 | PCR |
| Platinum Taq | Life Technologies | 10966026 | PCR |
| PureLink QUICK PCR Purification Kit | Life Technologies | K310002 | PCR |
| Viroseq | ABBOTT | 4J94-20 | Reverse Transcription and PCR |
| Agarose Tablets (Dnase/Rnase free) | BIOLINE | BIO-41027 | PCR |
| TBE Buffer | MERCK | 1.06177.2500 | PCR |
| O'Range Ruler 200 bp DNA Ladder | Fermentas | FE SM0633 | PCR |
| Novel Juice | GeneDireX | LD001-1000 | PCR |
| MiniBis Bioimaging System | DNR Bioimaging Systems Ltd | Gel Documentation | |
| Power Pac 300 | BIORAD | Gel Electrophoresis | |
| Big Dye Terminator Kit version 3.1 | Life Technologies | 4337456 | Sequencing |
| Arrays | Life Technolgies | 4319899 | Sequencing |
| PoP | Life Technologies | 4363785 | Sequencing |
| 10x EDTA Buffer | Life Technologies | 402824 | Sequencing |
| Formamide | Life Technologies | 4311320 | Sequencing |
| 5x Sequencing Buffer | Life Tecgnologies | 4336697 | Sequencing |
| 3130 xl Genetic Analyzer | Life Technologies | Sequencing | |
| GeneAmp PCR System 9700 | Life Technologies | RT/PCR/Sequencing | |
| Centrifuge 5804 | EPPENDORF | Sample Processing | |
| Centrifuge 5415R | EPPENDORF | RNA Extraction | |
| Centrifuge 5415R | EPPENDORF | RT and PCR | |
| Centrifuge 5415D | EPPENDORF | PCR Product Clean up | |
| Centrifuge 5810 | EPPENDORF | Sequencing Clean up | |
| Picofuge | BIORAD | C1301-230V | RT and PCR |
| Vortex Genius 3 | IKA | RNA extraction and reagent preparation | |
| Vortex mixer | IKA | Sequencing Cleanup | |
| NanoDrop 2000 UV/VIS spectrophotometer | ThermoScientific | DNA quantification | |
| 3 M Sodium Acetate | MERCK | 567422 | Sequencing Clean up |
| Absolute Ethanol | MERCK | SAAR2233540LP | Sequencing Cleanup |
| 1.5 ml SARSTEDT Tubes | BIODEX | 72.692.005 | RNA Extraction |
| 2 ml SARSTEDT Tubes | BIODEX | 72.693.005 | RNA Extraction |
| 2 ml Collection tubes | SCIENTIFIC GROUP | MCT-200-NC/S | RNA Extraction |
| Optical MicroAmp 96-well reaction plates | Life Technologies | N8010560 | Sequencing |
| 200 µl 8 Strip StarPCR Tubes with attached flat caps | STAR Lab - supplied by CELTIC | A1402-3700 | RT and PCR |
| 200 µl PCR individual tubes | Scientific Group | CR/3745 | RT and PCR |
| Geneious | Biomatters | Sequence analysis | |
| Internet Access | Preferrably high speed | ||
| Web resources | |||
| hivdb.stanford.edu | Stanford University | Drug reistance analysis | |
| http://bioafrica.mrc.ac.za:8080/regadb-ui/RegaDB | SATuRN | database | |
| http://bioafrica.mrc.ac.za/tools/pppweb.html | SATuRN | Sequence quality tool |
References
- Shao, Y., Williamson, C. The HIV-1 epidemic: low- to middle-income countries. Cold Spring Harbor Persp. Med. 2, (2012).
- Mutevedzi, P. C., et al. Scale-up of a decentralized HIV treatment programme in rural KwaZulu-Natal, South Africa: does rapid expansion affect patient outcomes. Bull. World Health Organ. 88, 593-600 (2010).
- Houlihan, C. F., et al. Cohort profile: Hlabisa HIV treatment and care programme. Int. J. Epidemiol. 40, 318-326 (2011).
- Tanser, F., Barnighausen, T., Grapsa, E., Zaidi, J., Newell, M. L. High coverage of ART associated with decline in risk of HIV acquisition in rural KwaZulu-Natal. South Africa. Science. 339, 966-971 (2013).
- Bor, J., Herbst, A. J., Newell, M. L., Barnighausen, T. Increases in adult life expectancy in rural South Africa: valuing the scale-up of HIV treatment. Science. 339, 961-965 (2013).
- Montaner, J. S., et al. The case for expanding access to highly active antiretroviral therapy to curb the growth of the HIV epidemic. Lancet. 368, 531-536 (2006).
- Granich, R. M., Gilks, C. F., Dye, C., De Cock, K. M., Williams, B. G. Universal voluntary HIV testing with immediate antiretroviral therapy as a strategy for elimination of HIV transmission: a mathematical model. Lancet. 373, 48-57 (2009).
- Johnson, L. F., et al. Life expectancies of South african adults starting antiretroviral treatment: collaborative analysis of cohort studies. PLoS Med. 10, (2013).
- Blower, S., Ma, L., Farmer, P., Koenig, S. Predicting the impact of antiretrovirals in resource-poor settings: preventing HIV infections whilst controlling drug resistance. Curr. Drug Targets. 3, 345-353 (2003).
- Geretti, A. M. Epidemiology of antiretroviral drug resistance in drug-naive persons. Curr. Opin. Infect. Dis. 20, 22-32 (2007).
- Larder, B. A., Darby, G., Richman, D. D. HIV with reduced sensitivity to zidovudine (AZT) isolated during prolonged therapy. Science. 243, 1731-1734 (1989).
- Erice, A., et al. Brief report: primary infection with zidovudine-resistant human immunodeficiency virus type 1. N. Engl. J. Med. 328, 1163-1165 (1993).
- Williams, I., et al. British HIV Association guidelines for the treatment of HIV-1-positive adults with antiretroviral therapy. HIV Med. 13 Suppl 2, 1-85 (2012).
- DHHS, US Panel on Antiretroviral Guidelines for Adults and Adolescents. Guidelines for the use of antiretroviral agents in HIV-1-infected adults and adolescents. , (2012).
- Vandamme, A. M., et al. European recommendations for the clinical use of HIV drug resistance testing: 2011 update. AIDS Rev. 13, 77-108 (2011).
- DHHS, US Panel on Antiretroviral Therapy and Medical Management of HIV-Infected Children. Guidelines for the Use of Antiretroviral Agents in Pediatric HIV Infection. , (2012).
- Department of Health. Clinical guidelines for the management of HIV & AIDS in adults and adolescents. , Department of Health. (2010).
- Conradie, F., et al. The 2012 southern African ARV drug resistance testing guidelines. S. Afr. J.HIV Med. 13, 162-167 (2012).
- Manasa, J., et al. Primary Drug Resistance in South Africa: Data from 10 Years of Surveys. AIDS Res. Hum. Retroviruses. 28, 558-565 (2012).
- Tshabalala, M., et al. Surveillance of transmitted antiretroviral drug resistance among HIV-1 infected women attending antenatal clinics in Chitungwiza, Zimbabwe. PLoS ONE. 6, (2011).
- Bartolo, I., et al. Antiretroviral drug resistance surveillance among treatment-naive human immunodeficiency virus type 1-infected individuals in Angola: evidence for low level of transmitted drug resistance. Antimicrob. Agents Chemother. 53, 3156-3158 (2009).
- Bartolo, I., et al. HIV-1 genetic diversity and transmitted drug resistance in health care settings in Maputo, Mozambique. J. Acquir. Immune Defic. Syndr. 51, 323-331 (2009).
- Hamers, R. L., et al. HIV-1 drug resistance in antiretroviral-naive individuals in sub-Saharan Africa after rollout of antiretroviral therapy: a multicentre observational study. Lancet Infect. Dis. 11, 750-759 (2011).
- Hamers, R. L., et al. HIV-1 Drug Resistance Mutations Are Present in Six Percent of Persons Initiating Antiretroviral Therapy in Lusaka, Zambia. J. Acquir. Immune Defic. Syndr. , (2010).
- Nwobegahay, J., Selabe, G., Ndjeka, N. O., Manhaeve, C., Bessong, P. O. Low prevalence of transmitted genetic drug resistance in a cohort of HIV infected naive patients entering antiretroviral treatment programs at two sites in northern South Africa. J. Med. Virol. 84, 1839-1843 (2012).
- Iweriebor, B. C., et al. Molecular epidemiology of HIV in two highly endemic areas of northeastern South Africa. Arch. Virol. 157, 455-465 (2012).
- Parboosing, R., Naidoo, A., Gordon, M., Taylor, M., Vella, V. Resistance to antiretroviral drugs in newly diagnosed, young treatment-naive HIV-positive pregnant women in the province of KwaZulu-Natal South Africa. J. Med. Virol. 83, 1508-1513 (2011).
- Nwobegahay, J. M., et al. Prevalence of antiretroviral drug resistance mutations and HIV-I subtypes among newly-diagnosed drug-naive persons visiting a voluntary testing and counselling centre in northeastern South Africa. J. Health Popul. Nutr. 29, 303-309 (2011).
- Nwobegahay, J., et al. Prevalence of drug-resistant mutations in newly diagnosed drug-naive HIV-1-infected individuals in a treatment site in the waterberg district, limpopo province). S. Afr. Med. J. 101 (2011), 335-337 (2011).
- Rosen, S., Long, L., Sanne, I., Stevens, W. S., Fox, M. P. The net cost of incorporating resistance testing into HIV/AIDS treatment in South Africa: a Markov model with primary data. J. Int. AIDS Soc. 14, 24 (2011).
- Dalai, S. C., et al. Evolution and molecular epidemiology of subtype C HIV-1 in Zimbabwe. AIDS. 23, 2523-2532 (2009).
- Chen, J. H., et al. In-house human immunodeficiency virus-1 genotype resistance testing to determine highly active antiretroviral therapy resistance mutations in Hong Kong. Hong Kong Med. 18, 20-24 (2012).
- Lee, C. K., et al. An in-house HIV genotyping assay for the detection of drug resistance mutations in Southeast Asian patients infected with HIV-1. J. Med. Virol. 84, 394-401 (2012).
- Aitken, S. C., et al. A Pragmatic Approach to HIV-1 Drug Resistance Determination in Resource-Limited Settings by Use of a Novel Genotyping Assay Targeting the Reverse Transcriptase-Encoding Region Only. J. Clin. Microbiol. 51, 1757-1761 (2013).
- Zhou, Z., et al. Optimization of a low cost and broadly sensitive genotyping assay for HIV-1 drug resistance surveillance and monitoring in resource-limited settings. PLoS One. 6, (2011).
- , Life Technologies. Life Technologies and SATuRN Collaborate to Increase Access to HIV Testing in Africa. , Available from: https://ir.lifetechnologies.com/releasedetail.cfm?releaseid=694585 (2012).
- Lihana, R. W., Ssemwanga, D., Abimiku, A., Ndembi, N. Update on HIV-1 diversity in Africa: a decade in review. AIDS Rev. 14, 83-100 (2012).
Reprints and Permissions
