This protocol describes the porcine myocardial infarction (MI) model using a 90 min closed-chest coronary balloon occlusion of the left anterior descending artery (LAD), followed by reperfusion. Furthermore, the protocol for several outcome parameters, such as cardiac function, hemodynamics, microvascular resistance, and infarct size, are also presented.
Method Article
Myocardial Infarction and Functional Outcome Assessment in Pigs
* These authors contributed equally
In This Article
Erratum Notice
Important: There has been an erratum issued for this article. View Erratum Notice
Summary
Abstract
Introduction of newly discovered cardiovascular therapeutics into first-in-man trials depends on a strictly regulated ethical and legal roadmap. One important prerequisite is a good understanding of all safety and efficacy aspects obtained in a large animal model that validly reflect the human scenario of myocardial infarction (MI). Pigs are widely used in this regard since their cardiac size, hemodynamics, and coronary anatomy are close to that of humans. Here, we present an effective protocol for using the porcine MI model using a closed-chest coronary balloon occlusion of the left anterior descending artery (LAD), followed by reperfusion. This approach is based on 90 min of myocardial ischemia, inducing large left ventricle infarction of the anterior, septal and inferoseptal walls. Furthermore, we present protocols for various measures of outcome that provide a wide range of information on the heart, such as cardiac systolic and diastolic function, hemodynamics, coronary flow velocity, microvascular resistance, and infarct size. This protocol can be easily tailored to meet study specific requirements for the validation of novel cardioregenerative biologics at different stages (i.e. directly after the acute ischemic insult, in the subacute setting or even in the chronic MI once scar formation has been completed). This model therefore provides a useful translational tool to study MI, subsequent adverse remodeling, and the potential of novel cardioregenerative agents.
Introduction
Acute myocardial infarction (AMI) and its long-term sequelae such as chronic heart failure (CHF) profoundly impact patient prognosis and quality of life, let alone the high cost restraints imposed on our available healthcare resources1. The prevalence of CHF in the western world is estimated at 1-2%, of which ~60% of cases are the consequence of AMI as primary cause2. In the USA alone, about 5.7 million patients suffer from CHF accounting for approximately $30 billion in annual healthcare costs in 2008, with a predicted triplicate in costs rising to $97 billion annually in 20301. Taken together, these numbers make a strong argument for the development of new cardioregenerative treatments that, for swift translation, rely on a reproducible and reliable large animal myocardial infarction model that accurately mimics the human scenario.
Pigs (Sus scrofa) are increasingly being used in cardiovascular research for pharmacological and toxicological testing3. One of the traits responsible for this success as a translational research tool is their similarity in cardiac function and anatomy with the human heart4,5. For instance, pig heart-to-body weight ratio, cardiac size and coronary artery anatomy distribution have all shown to be remarkably similar to man4. Moreover, cardiomyocyte metabolism, electrophysiological properties and response to an ischemic insult such as AMI have been reported to show high levels of agreement with the human situation6,7. Ultimately, to fulfill the above described criteria, a standardized MI-protocol that produces robust and sustainable MI for testing of investigational new drugs (IND) is needed. Here, we present such a standardized model that uses a 90 min closed-chest coronary balloon occlusion of the left anterior descending artery (LAD) followed by reperfusion, thereby creating reproducible myocardial infarction covering the anteroapical, septal and inferoseptal walls of the left ventricle.
Protocol
All in vivo experiments were conducted in accordance with the Guide for the Care and Use of Laboratory Animals prepared by the Institute of Laboratory Animal Resources. Experiments were approved by the local Animal Experimentation Committee.
1. Medication, Anesthesia, Venous Access, and Intubation
- Medication and Anesthesia
- Premedication
- Start amiodarone 150 mg/kg 10 days prior to surgery to prevent arrhythmias. Continue amiodarone in a dose of 100 mg/kg from the day of the procedure until day 28. Reduce the dosage to 50 mg/kg on day 29 and continue until the end of the study.
- Start anti-platelet therapy, 1 mg/kg clopidogrel from day 3 prior to surgery and 4.5 mg/kg acetylsalicylic acid 1 day before surgery. Continue clopidogrel 1 mg/kg per day and acetylsalicylic acid 80 mg/day.
- Start pain medication 1 day prior to surgery by Fentanyl patch, 25 μg/hr for ~70 kg pigs. Continue the use of Fentanyl patches for 24 hr post-operatively to ensure adequate pain medication. Also, daily monitor for signs of putative discomfort (i.e. behavior, breathing, gait, mobility, etc.) to increase pain medication.
- Fast the animal for 12 hr, maintain unlimited access to water.
- Anesthesia
- To prevent unnecessary stress and discomfort, sedate the pig in its stable by intramuscular injection of a mixture of midazolam 0.4 mg/kg, ketamine 10 mg/kg, and atropine 0.014 mg/kg.
- Obtain venous access by cannulating the ear vein with an 18 G i.v. cannula. Induce anesthesia by intravenous administration of 5 mg/kg sodiumthiopental, and give 1,000/100 mg amoxicillin/clavulanic acid to prevent infections. The pig will receive 1,000/100 mg amoxicillin/clavulanic acid the day after surgery as antibiotic treatment.
- Intubate the pig by using an endotracheal tube (size 8.5 for pigs weighing ~70 kg). If necessary perform balloon-ventilation with a frequency of 12/min and transport the pig to the operating theater.
- At arrival on the operation theater, immediately start mechanical positive pressure ventilation with FiO2 0.50, 10 ml/kg tidal volume, and a frequency of 12/min under continues capnography.
- Start balanced anesthesia by continues intravenous infusion of a combination of midazolam 0.5 mg/kg/hr, sufentanil 2.5 microg/kg/hr and pancuronium bromide 0.1 mg/kg/hr. During the entire operation, continuously monitor ECG, arterial blood pressure, temperature and capnography to measure depth of anesthesia. For example, if a sinus tachycardia is present, check if pain medication and/or anesthesia are adequate.
- Infuse 4.3 mg/kg of amiodarone in 500 ml venofundin 6% intravenously.
- Monitor heart rhythm by a 5 leads ECG.
- Shave and clean the neck and hind limb area.
- Insert a Foley catheter.
- Premedication
2. Transthoracic Echocardiography
- Place the animal in the right lateral position. In landrace pigs such as Dalland pigs, only parasternal views (long and short axis) can be obtained. Due to the shape of the thorax, apical view acquisition is not feasible.
- Orient and obtain parasternal long axis view in 2D (B-mode). Determine the LV dimensions at end diastole and end systole in M-mode.
- Rotate the echo probe 90° clockwise whilst maintaining its parasternal position to acquire the LV short axis views at the levels of the mitral valve, papillary muscle and apex. The short axis view of the papillary muscle and apex may require placement of the echo probe one or two intercostal spaces lower relative to the position for the mitral valve short axis view.
3. Surgical Preparation and Vascular Access
- Disinfect the surgical areas with iodine 2% and use sterile surgical drapes to cover the nonsterile parts of the pig.
- Make a medial incision in the neck. Pass the linea alba to minimize muscle damage and bluntly approach the carotid artery and internal jugular vein next to the trachea.
- Carefully isolate the carotid artery and internal jugular vein. Make sure the vagal nerve is undamaged. Place Vicryl 2-0 sutures around both vessels to gain vessel control. Achieve arterial access by cannulating the internal carotid artery with an 8F sheath using the Seldinger technique. Fix the sheath to the artery, make sure the artery is not fully occluded by the suture. Venous access can be acquired by cannulating the jugular vein with a 9F sheath also using the Seldinger technique. Before securing the sheath make sure the vein is ligated. Alternatively, the femoral artery can also be used for arterial access.
- Administer 100 IE/kg heparin immediately after inserting the sheaths to inhibit thrombus formation.
- For a stable and constant arterial pressure measurement, cannulate one of the smaller arteries in one of the hind limbs by making a small incision above the artery. The artery is found just under the skin, pulsations can be felt through the skin. Isolate the artery from its surrounding tissue. Place 2 Vicryl 2-0 sutures around the vessel, 1 proximal and 1 distal. Ligate the distal side and insert an 18 G i.v. cannula and secure tightly connect the pressure.
4. Invasive Pressure Volume Loop Analysis
- Insert a Swann-Ganz catheter (SG) via the previously placed sheath in the internal jugular vein.
- Connect a cardiac output device to the part of the SG that culminates in the proximal lumen.
- Inject 5 ml of 0.9% saline into the proximal lumen of the SG and measure cardiac output; repeat this three times and average the indices.
- Calibrate the PV system by using the previously determined cardiac output.
- Insert the 7F conductance catheter via the carotid artery into the left ventricle under fluoroscopic guidance.
- Select the largest segment present in the LV for volume measurements and perform a baseline scan under apnea.
- After volume calibration is completed, record 10-15 beats under apnea.
- Remove the SG and place a balloon catheter in the inferior caval vein at the level of the diaphragm under fluoroscopic guidance.
- Perform preload reduction by inflating the balloon under apnea and record the corresponding PV-Loops.
5. Intracoronary Pressure and Flow Measurement
- Dilute nitroglycerin in a concentration of 100 μg/ml and dilute adenosine in a concentration of 30 μg/ml.
- Position an 8F guiding catheter in the ostium of the left coronary artery.
- Place the combined pressure/flow wire in the proximal part of the left coronary artery.
- Administer 200 μg of nitroglycerin intracoronary and normalize the distal pressure (Pd), measured by the wire, with the arterial pressure.
- Place the wire in the mid part of the left anterior descending artery (LAD).
- Start measuring baseline pressure and flow. Induce hyperemia by administering 60 μg of adenosine intracoronary, flush with 2 ml of saline and measure hyperemic pressure and flow. Wait for the flow to restore to baseline values. Repeat the measurement twice.
- Infuse another 200 μg nitroglycerin intracoronary and repeat steps 1.6 and 1.7 for the left circumflex coronary artery.
6. Induction of MI
- Place the intracardiac defibrillation catheter in the right ventricle using the venous sheath. The distal electrodes should be in the apex of the ventricle, the proximal electrodes in the atrium and/or superior caval vein. Connect the catheter to the defibrillator and set it to 50 J.
- Measure the diameter of the LAD distal from the second diagonal (D2) in AP and LAO 30° view.
- Choose an angioplasty balloon with a diameter according the diameter of the LAD distal from the D2 (Figure 1).
- Position a guidewire through the guiding catheter distally in the LAD.
- Advance the balloon catheter over the guidewire. Place the balloon distal from the D2.
- Administer 30 IE/kg heparin.
- Inflate the balloon until the pressure matches the right diameter of the LAD.
- Check total occlusion of the LAD by angiography (Figure 1).
- Cover the sterile working field and the wound in the neck with sterile drapes cloths. Free the chest from any coverage to make it available for chest compressions or transthoracic defibrillation.
- Check the pressure in the balloon during the next 90 min and restore the pressure if necessary.
- In case of ventricular fibrillation:
- Immediately start chest compressions with a frequency of 100/min.
- Administer 300 mg amiodarone intravenously as a fast bolus (~1 min).
- Start intracardiac defibrillation, give shocks of 50 J.
- After 5 unsuccessful shocks, restart chest compressions. Change intracardiac defibrillation to transthoracic defibrillation and shock with 150 J. In case of unsuccessful shock, change to 200 J.
- If necessary, administer another dose of 150 mg amiodaron and/or 1 mg adrenalin. Repeat adrenalin twice with intervals of 3-5 min, when necessary.
- Continue chest compressions, interspersed with transthoracic defibrillation
Finishing the Surgical Procedure (for Long Term Follow Up)
- After 90 min check by angiography if the LAD is still fully occluded.
- Administer another 30 IE/kg heparin and deflate the balloon. Check for reperfusion. Remove the deflated balloon with the guiding catheter from the carotid sheath.
- Carefully remove the arterial sheath and clamp the carotid artery immediately with an anastomosis clamp (Figure 1). Use continues stitches (6-0 prolene) to close the carotid artery. Remove the clamp and check for leakages.
- Remove the internal defibrillation catheter and remove the sheath from the internal jugular vein. Ligate proximal of the sheath entry.
- Close the subcutis and skin of the neck in two layers using 2-0 Vicryl.
7. Cardiac Magnetic Resonance Imaging
- Place the animal on the MRI table head first in the supine position under continuous anesthesia.
- Place a dedicated phased-array cardiac coil over the chest of the animal.
- For image planning obtain scout images in short axis and two-chamber long axis views.
- Acquire ECG-gated steady-state free precession (SSFP) cine of short axis (from apex to base of LV) and two chamber long-axis views.
- Late gadolinium enhancement (LGE) can be acquired using an inversion recovery 3D-turbo-gradient-echo-technique 15 min after double-dose i.v. bolus injection of a gadolinium based contrast agent.
- Perform offline analysis with validated software of functional parameters. Assess left-ventricular ejection fraction (LVEF), LV mass, end diastolic volume, end systolic volume, stroke volume, cardiac output, and scar mass.
8. End of Study and Infarct Size
- At the end of the study, follow Protocols 1-5 and 7 to acquire follow up measurements.
- Make a median 30-40 cm incision from just below the suprasternal notch to a point just below the xiphoid process. Advance through the linea alba down to the sternum. Split the xiphoid and use Klinkenberg scissors to separate the posterior sternum from the pericardium with caution. After using the scissors bluntly continue further separation. Perform a sternotomy by e.g. using a hammer and Lebsch knife. Bone marrow bleeding is minimized by rubbing bone wax on the marrow. Open the thorax with a sternum retractor.
- Enter the 3rd pleural space and locate the inferior caval vein in the mediastinum.
- Humanely euthanize the animal by cutting the inferior caval vein under deep anesthesia. Remove blood with a suction device. Place a 9 V battery on the apex to induce ventricular fibrillation.
- After excision of the heart, cut the right and left ventricle into five slices from base to apex and incubated in 1% triphenyl-tetrazolium chloride dissolved in 0.9% saline at 37 °C for 15 min. Next, wash the slices in 0.9% saline and photograph the slices from both sides.
Results
Mortality and Infarct Size
In our center, out of 32 pigs (Female Dalland Landrace, 6 months old, ~70 kg) that were subjected to this MI protocol, five (15.6%) died due to refractory ventricular fibrillation during ischemia. This protocol creates an infarct covering approximately 10-15% of the left ventricle, located in the anteroseptal, septal and inferoseptal walls (Figure 2A). If serial noninvasive assessment of infarct size is warranted, late gadolinium enhancement (LGE) on CMR can be used to follow the nonviable infarct area over time (Figure 2B).
Cardiac Function and Remodeling
Four weeks after MI, global and regional parameters reflecting cardiac function should be decreased compared to healthy baseline values. Specifically, LV ejection fraction (LVEF) should decrease to approximately ~35-45% four weeks post-MI. Besides global systolic function, several parameters reflecting post-MI adverse remodeling can also be measured, such as LV morphology and diameters using CMR and echocardiography (Figures 3A and 3B). Four weeks after MI, an increase in end diastolic volume (EDV) as a sign of adverse remodeling can be expected (Figures 3A and 3B).
Coronary flow and pressure parameters
Angiogenesis and formation of new capillaries are often regarded as important treatment goals in ischemic heart disease8. Assessment of microvascular resistance can be indirectly based on the combined measurement of intracoronary pressure and flow velocity. Representative pressure and flow velocity measurement under normal conditions and maximal hyperemia is shown in Figure 4. Four weeks after MI, the hyperemic microvascular resistance should be increased in the infarct related coronary artery (LAD) compared to the baseline situation8.
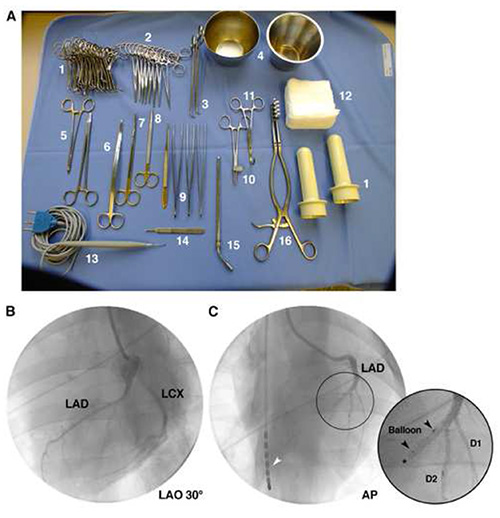
Figure 1. MI model based on LAD balloon occlusion. (A) Standard surgical equipment with: 1) towel clamps; 2) mosquitos; 3) dissecting forceps; 4) round container; 5) needle holders (fine and rough); 6) Klinkenberg scissor; 7) dissecting scissors (straight and curved); 9) forceps (De-Bakey, fine and rough); 10) hose clamp; 11) anastomosis clamp; 12) gauzes; 13) electrosurgical pencil; 14) scalpel holder; 15) Dreesman (suction); 16) retractor; 17) lamp holders. (B) Left anterior oblique fluoroscopic view of the LAD and the LCX. (C) After visualizing the second diagonal branch, position the two radiopaque markers (see inset, black arrowheads) of the balloon just distally of the D2. Inflate and ensure that coronary blood flow is successfully blocked by contrast injection (see asterisk). Intracardiac defibrillator lead can be seen in the right ventricle (see white arrowhead). LAD denotes Left anterior descending artery; LCX denotes left circumflex artery; LAO denotes left anterior oblique view; AP denotes anterior posterior view; D1 denotes first diagonal branch; D2 denotes second diagonal branch. Click here to view larger image.
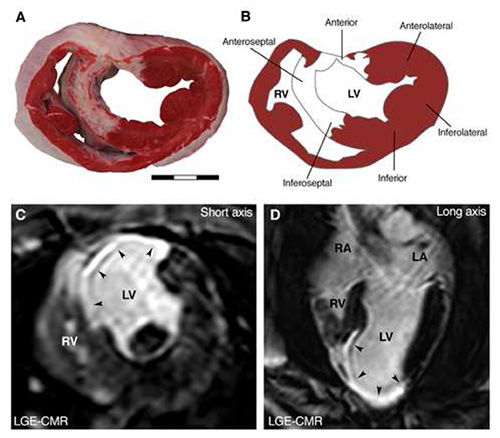
Figure 2. Infarct size after MI. (A) The 90 min balloon occlusion of the LAD leads to extensive myocardial damage and scar formation (white color), visualized by TTC staining at 1 month follow up. (B) Schematic infarct distribution shows that the infarction is located in the anterior, anteroseptal and inferoseptal segments of the heart. (C,D) Short and long axis late gadolinium enhanced CMR images show the extensive infarct scar (white signal, see black arrowheads) localized in the anterior, anteroseptal and inferoseptal segments of the heart. LGE-CMR denotes late gadolinium enhanced cardiac magnetic resonance. Scale bar denotes 3 cm. Click here to view larger image.
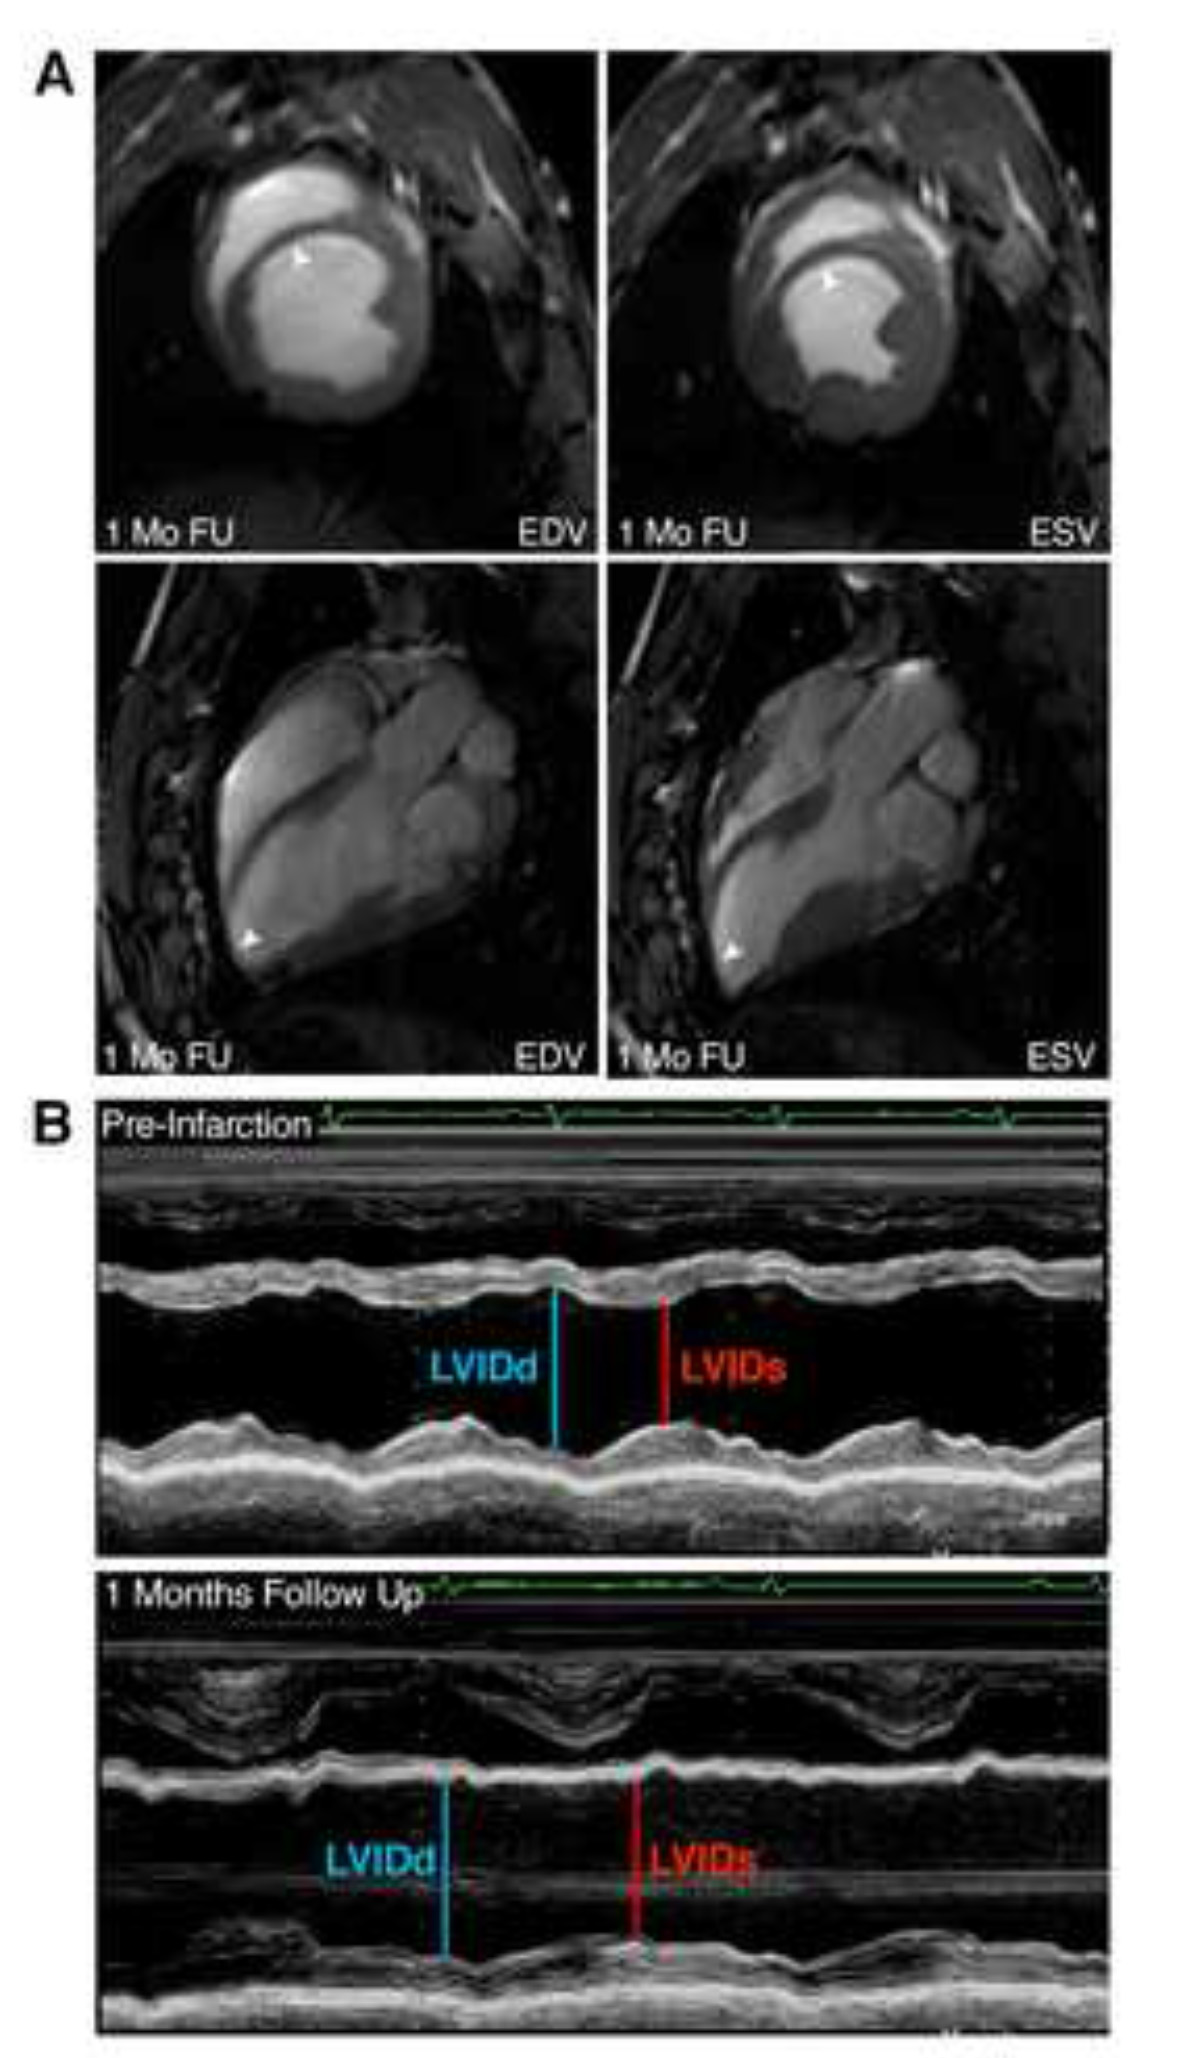
Figure 3. Assessment of cardiac function in ischemic MI models. (A) Representative CMR cine-loop images at end diastole and end systole showing functional impairment of the infarct scar segments. (B) M-Mode image of 2D parasternal long axis by echocardiography, showing LV dilatation (increase in LVIDd) 1 month after MI, as well as functional impairment (absence of septal thickening). EDV denotes end diastolic volume; ESV denotes end systolic volume; LVIDd denotes left ventricular internal diameter at diastole and LVIDs denotes left ventricular internal diameter at systole. Click here to view larger image.
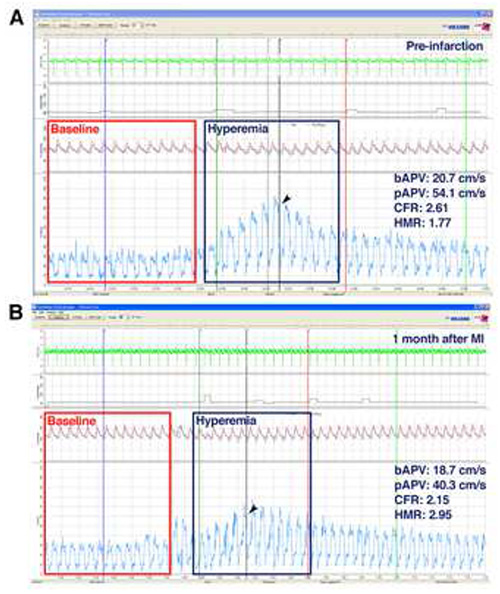
Figure 4. Intracoronary pressure and flow velocity derived parameters. Intracoronary pressure and flow velocity recordings using the Combowire showing (A) reference values prior to MI with high response to hyperemia (black arrowhead). (B) 1 month after MI, the infarct related artery (LAD) has a decreased hyperemic response in coronary flow velocity (black arrowheads). As a result, pressure and flow velocity derived parameters (HMR) or flow velocity reserve (CFR) are decreased compared to the baseline. bAPV denotes basal average peak velocity; pAPV denotes peak average peak velocity; CFR denotes coronary flow reserve; HMR denotes hyperemic microvascular resistance. Click here to view larger image.
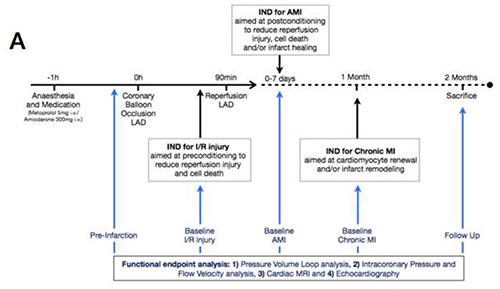
Figure 5. Overview of different study designs. (A) Schematic of multiple possible study designs to validate investigational new drugs (INDs) in various stages of MI using this LAD MI pig model. Dependent on the chosen phase of MI that is under investigation, functional analysis can be performed just prior to the treatment allocation as the baseline value and assessment of the area at risk. Click here to view larger image.
Discussion
Intracoronary balloon occlusion of the LAD provides a reproducible and consistent preclinical MI model in pigs that can be used to investigate safety and the efficacy of new cardiovascular therapies that closely mimics the human situation. As shown in Figure 5, the presented ischemia/reperfusion infarction model provides the platform that can be further tailored to investigate different phases of MI and post-MI remodeling whilst the initial ischemia/reperfusion injury is identical for both.
The success of the described protocol outlined here is dependent on the myocardial ischemia as the most critical phase of the protocol. Correct placement of the balloon distal to the second diagonal branch of the LAD is crucial for reaching adequate infarct size whilst ensuring a high survival rate. Based on this MI model, a ~15% mortality rate was observed, while extensive mid and apical segments of the anterior, septal and inferior walls were infarcted as seen on CMR and TTC staining (Figures 2A and 2B). The duration of ischemia can be tailored according to the desired infarct size. Although we have used Landrace pigs in this protocol, minipigs (i.e. Göttingen minipigs) usually require longer durations of myocardial ischemia (e.g. 150 min occlusion).
Outcome analysis in preclinical and clinical MI studies is often based on LVEF. Although lower LVEF has been firmly associated with increased risk for cardiovascular mortality, it remains dependent on hemodynamical parameters such as preload9. Arguably, given that on average only 10-15% of the LV is infarcted, several conceptual and practical limitations are related to LVEF being a global measure of LV systolic function rather than reflecting local improvement10. Therefore, the proposed measures of outcome used in this model shed light on different aspects of MI and post-MI remodeling thereby providing the investigators the means to accurately assess the efficacy of new therapies on multiple levels.
To optimize translation from preclinical models to clinical practice, we choose using large pigs instead of minipigs. Hemodynamic measurements, medication dosages and surgical devices can easily be exchanged with clinical practice. Compared to minipigs, large pigs gain relatively much weight. This may cause a problem in long-term follow up, with regard to comparability of serial results. Female Dalland Landrace pigs weigh approximately 70 kg at an age of 6 months. To prevent abundant weight gain during the follow up period, animals are kept on a restricted diet. Pigs receive 750 g of custom made low calorie food (containing: proteins 15.6%, fat 2.0%, fibers 14.8%, ashes 8.8%, calcium 0.9%, phosphorous 0.57%, magnesium 0.29%, and potassium 0.18%) twice a day and gain about 10 kg of weight in 4 weeks.
McCall and coworkers have previously published a similar protocol for myocardial infarction in pigs11. Considerable overlap exists between this protocol and theirs, emphasizing the preference for the LAD rather than the left circumflex artery (LCX) or the right coronary artery (RCA). In our experience, there is a lesser extent of infarct size of the total left ventricle using the LCX while the RCA infarction is accompanied with higher chance of unwanted conduction disturbances (i.e. sinus node dysfunction, AV-node dysfunction). One difference between the two protocols pertains to the use of increased pharmacological platelet inhibition in this protocol, as we have observed higher rates of no-reflow based on thrombus formation as the result of 90 min of hemostasis in the occluded coronary artery. This observation is in line with known hypercoagulability observed in pigs12. Although McCall proposed using a single, high-dose, bolus of heparin, this protocol relies on the use of heparin in multiple lower doses spread throughout the surgery to minimize thrombotic complications.
In summary, we present a porcine MI model that enables researchers to make use of an effective, reproducible and above all practical large animal model of human disease to study new therapeutics as an essential step towards a first-in-man clinical trial.
Disclosures
This work was supported by the HGG Group BV (SK), the “Wijnand M. Pon Stichting” (SC, SK). This research forms part of the Project P1.04 SMARTCARE of the BioMedical Materials institute, cofunded by the Dutch Ministry of Economic Affairs, Agriculture and Innovation (SJL, JG). All authors have reported that they have no relationships to disclose.
Acknowledgements
Cees Verlaan, Joyce Visser, Merel Schurink, and Grace Croft are kindly acknowledged for their excellent technical assistance with the animal experiments.
Materials
| Name | Company | Catalog Number | Comments |
|---|---|---|---|
| 0.9% Saline | Braun | ||
| 6-0 Prolene | Ethicon | ||
| Acetylsalicylic acid | Ratiopharm | 80 mg | |
| Adenosine | Apotheek UMCU | 3 mg/ml | |
| AdVantage PV loop system | Transonic Science | ||
| Amiodarone | Cordarone I.V. (Sanofi) | ||
| Amiodaron HCl (PCH) | |||
| Amoxicilline/clavulaanzuur | Sandoz | 500/50 mg | |
| Atropinesulfate | PCH | 0.5 mg/ml | |
| Bone Marrow Wax | Syneture | ||
| Cardiac Defibrillator | Philips | ||
| Clopidogrel | Apothecon B.V. | Clopidrogel 75A | |
| Contrast agent | Telebrix | ||
| Endotracheal tube | Covidien | ||
| Fentanyl patch | Durogesic (Janssen-Cilag) | 25 μg/hr | |
| Fogarty catheter | Edwards Life Sciences | ||
| Gadolinium | Gadovist | ||
| Guidewire | Abbott | ||
| Heparin | Leo | ||
| I.V. cannula | Abbocath (Hospira Venisystems) | ||
| Iodine | Jodiumtictuur 2% (Eurovet) | ||
| Ketamine | Narketan 10 Vétoquinol | ||
| Midazolam | Actavis | 5 mg/ml | |
| Nitroglycerin | Pohl Boskamp | 1 mg/ml | |
| Pancuronium bromide | 2 mg/ml | ||
| Seldinger vascular sheath 8F | Arrow | ||
| Sufentanil | Sufentanil-Hameln | 50 μg/ml | |
| Swann-Ganz catheter | Criticath ref 680078 (Argon) | ||
| Synolux | Pfizer | 250 mg | |
| Tetra-polar catheter | Transonic Science | ||
| Thiopental | Inresa | 0.5 g | |
| Triphenyl-tetrazolium chloride | Merck | ||
| Venofundin | Braun | ||
| Vicryl 2-0 | Ethicon | ||
| Volcano ComboMap system | Volcano |
References
- Roger, V. L., et al. Heart disease and stroke statistics-2012 update: a report from the American Heart Association. Circulation. 125 (1), (2012).
- Mosterd, A., Hoes, A. W. Clinical epidemiology of heart failure. Heart. 93 (9), 1137-1146 (1136).
- vander Spoel, T. I. G., et al. Human relevance of pre-clinical studies in stem cell therapy: systematic review and meta-analysis of large animal models of ischaemic heart disease. Cardiovasc. Res. 91 (4), 649-658 (2011).
- Crick, S., Sheppard, M., Ho, S., Gebstein, L., Anderson, R. Anatomy of the pig heart : comparisons with normal human cardiac structure. J. Anat. 193 (1), 105-119 (1998).
- Stubhan, M., et al. Evaluation of cardiovascular and ECG parameters in the normal, freely moving Göttingen Minipig. J. Pharmacol. Toxicol. Methods. 57 (3), 202-211 (2008).
- Heusch, G., Skyschally, A., Schulz, R. The in-situ pig heart with regional ischemia/reperfusion - ready for translation. J. Mol. Cell Cardiol. 50 (6), 951-963 (2011).
- Skyschally, A., van Caster, P., Iliodromitis, E. K., Schulz, R., Kremastinos, D. T., Heusch, G. Ischemic postconditioning: experimental models and protocol algorithms. Basic Res Cardiol. 104 (5), 469-483 (2009).
- Iekushi, K., Seeger, F., Assmus, B., Zeiher, A. M., Dimmeler, S. Regulation of cardiac microRNAs by bone marrow mononuclear cell therapy in myocardial infarction. Circulation. 125 (14), 1765-1773 (2012).
- Sijbesma, R. P., et al. Reversible polymers formed from self-complementary monomers using quadruple hydrogen bonding. Science. 278 (5343), 1601-1604 (1997).
- van Slochteren, F. J., et al. Advanced measurement techniques of regional myocardial function to assess the effects of cardiac regenerative therapy in different models of ischaemic cardiomyopathy. Eur. Heart J. Cardiovasc. Imaging. 13 (10), 808-818 (2012).
- McCall, F. C., et al. Myocardial infarction and intramyocardial injection models in swine. Nature Protoc. 8 (7), 1479-1496 (2012).
- Roussi, J., Andre, P., et al. Platelet functions and haemostasis parameters in pigs: absence of side effects of a procedure of general anaesthesia. Thromb Res. 81 (3), 297-305 (1996).
Reprints and Permissions
Erratum
Formal Correction: Erratum: Myocardial Infarction and Functional Outcome Assessment in Pigs
Posted by JoVE Editors on 9/01/2014. Citeable Link.
A correction was made to Myocardial Infarction and Functional Outcome Assessment in Pigs. An author's middle initial was omitted at publication.
The author's name was updated from:
Sanne Jansen of Lorkeers
to:
Sanne J. Jansen of Lorkeers
