Described here is a procedure for obtaining long stretches of current recording from one ion channel with the cell-attached patch-clamp technique. This method allows for observing, in real time, the pattern of open-close channel conformations that underlie the biological signal. These data inform about channel properties in undisturbed biological membranes.
Method Article
One-channel Cell-attached Patch-clamp Recording
In This Article
Summary
Abstract
Ion channel proteins are universal devices for fast communication across biological membranes. The temporal signature of the ionic flux they generate depends on properties intrinsic to each channel protein as well as the mechanism by which it is generated and controlled and represents an important area of current research. Information about the operational dynamics of ion channel proteins can be obtained by observing long stretches of current produced by a single molecule. Described here is a protocol for obtaining one-channel cell-attached patch-clamp current recordings for a ligand gated ion channel, the NMDA receptor, expressed heterologously in HEK293 cells or natively in cortical neurons. Also provided are instructions on how to adapt the method to other ion channels of interest by presenting the example of the mechano-sensitive channel PIEZO1. This method can provide data regarding the channel’s conductance properties and the temporal sequence of open-closed conformations that make up the channel’s activation mechanism, thus helping to understand their functions in health and disease.
Introduction
Fast communication across biological membranes relies almost exclusively on oligomeric pore forming membrane proteins, commonly referred to as channels. These proteins differ widely in activation signals, gating mechanisms, and conductance properties. Channel proteins whose pores are selective to ions are classified as ion channels; their activation produces ionic currents across the membrane, and their responses can be recorded with high resolution in real time using electrophysiologic techniques. The activation signals span a broad array of chemical and physical inputs including concentration gradients, mechanical and electrical forces, and temperature; thus, further classifying ion channels into ligand gated, mechanosensitive, voltage gated, or heat sensitive types. In this article, protocols are described to record one-channel activity from a ligand gated channel, the NMDA receptor, and a mechanosensitive channel, PIEZO1, using the patch-clamp technique.
Patch-clamp electrophysiology is the first and most widely used experimental method sufficiently sensitive to permit the observation of single molecules1,2. In addition to this exquisite sensitivity, it has vastly expanded the biological preparations amenable to electrophysiologic recording and also has allowed the observation of ion channels in intact membranes. First, because both voltage clamping and current recording are accomplished with the same electrode, it can be used to record signals across small cells or membranes patches. The technique revealed that ion channels are not restricted to excitable membranes of frog muscles, eel electroplaques, or squid giant axons3,4, but rather that they represent ubiquitous fixtures of transmembrane signaling mechanisms and are intrinsic to all cellular membrane types of uni- or multicellular organisms, and also to intracellular membranes. Importantly, the capability to record transmembrane currents by simply attaching a glass pipette to an intact cell provided the unprecedented opportunity to record activity from ion channels in their native undisrupted membranes. Thus, the cell attached patch-clamp technique, which is described in this protocol, permits monitoring the activity of ion channels continuously for tens of min or longer in their native environment.
Under normal thermal fluctuations, all proteins, including ion channel proteins, undergo structural changes over a broad time scale, with the fastest and most frequent rearrangements represented most likely by side-chain movements and much slower, less frequent changes represented by the repositioning of entire domains or subunits, or in some cases by post translational modifications or protein-protein interactions5,6. Observing long periods of activity generated by one molecule can help to understand the functional dynamics of ion channels in intact physiological membranes and provides valuable information about the operational mechanism of the molecule observed.
In contrast to the growing understanding of the diversity of ion channels across cell types and developmental stages, knowledge about the molecular composition of ion channels in native membranes is still limited. All ion channels are multimeric proteins and the majority of native ion channels assemble from several types of subunits producing proteins of wide molecular diversity, which is often accompanied with diverse conductance and gating properties. For this reason, ion channels of defined molecular composition are studied upon expression in heterologous systems. In particular, HEK293 cells, which are a clonal line of immortalized human embryonic kidney cells7, gained widespread acceptance as the preferred system for heterologous expression of recombinant ion channels. Among the many advantages that elevated HEK293 cells as the choice system for ion channel electrophysiology are the ease and affordability of culturing and maintaining long-lived stable cultures, their ability to carry out post-translational folding, processing and trafficking of mammalian proteins, and in many cases, their low level or even absence of endogenous expression for the channel of interest7,8. Expressing recombinant ion channels and studying their functional properties in HEK293 cells continues to be a valuable approach to obtain information about structure-function properties of ion channels as well as the specific properties of ion channel isoforms and their roles in native tissue. The protocols described in this article can be applied equally well to recombinant ion channels expressed in HEK293 cells and to native ion channels.
In summary, the patch-clamp technique, through its unprecedented capacity to resolve signals from one molecule remains, to date, the most direct method for observing the behavior of single molecules. In its cell-attached mode, patch-clamp recording allows long observation periods which, when done for one molecule, can provide exceptional insight into the operation of ion channels. Below is presented a protocol for obtaining high resolution current recordings from cell attached patches containing one ion channel protein.
Protocol
1. Cell Culture and Protein Expression
- Maintain HEK293 cells (ATCC number CRL-1573) between passages 22 and 40, which includes passages performed by ATCC, in monolayer culture in DMEM supplemented with 10% Fetal Bovine Serum (FBS) and 1% penicillin/streptomycin mixture at 5% CO2 and 37 °C. Between experiments, passage cells into T25 flasks at 5-20 fold dilutions in a final volume of 10 ml. Note: Using cells during these passages guarantees favorable cell health which will allow for optimal seal formation and patch stability.
- For transfection, plate HEK293 cells in 35 mm dishes at a density of ~105 cells/dish, which corresponds to ~0.5-0.6 ml of cell suspension per dish and grow cells in 2 ml medium for 18-24 hr.
- In a sterile 1.5 ml centrifuge tube, prepare the transfection mixture for four 35 mm dishes by adding (in this order): (1) 1 μg of each cDNA (GluN1, GluN2A, and GFP); (2) 315 μl of double distilled water (ddH2O); (3) 350 μl of 42 mM 4-(2-hydroxyethyl)-1-piperazineethanesulfonic acid (HEPES), and (4) 35 μl of 2.5 M CaCl2 drop wise, which is used to form the precipitate.
- Vortex tube for 5 sec and add 175 μl of transfection suspension in each of the four 35 mm dishes plated the day before, which now contain cells at 50-60% confluence, and incubate the cells at 37 °C for 2 hr.
- Aspirate off the transfection medium, wash with PBS and replace with 2 ml of growth medium supplemented with 2 mM MgCl2 to prevent NMDA receptor mediated excitotoxicity9. Note: The cells can be used for electrophysiological recordings 24-48 hr post transfection.
2. Electrode Preparation
- Generate 2 symmetrical recording pipettes by pulling on borosilicate glass tubes with a vertical puller. Based on the size and geometry of the resulting tip, further shape pipettes using a polisher. Note: The tip size can be evaluated visually and electrically. Visually, the outer diameter should be in the 1.4-5.6 μm range. Electrically, an optimum size tip, when filled with extracellular solution, should produce resistances in the 12-24 MΩ range (see Figure 2B).
- Use a pipette solution, which for cell attached experiments represents the extracellular milieu that will produce maximal channel activity and high current amplitudes. Note: For NMDA receptors, this corresponds to a solution containing saturating concentrations of agonists (glutamate and glycine), 1 mM EDTA, which chelates divalent cationic inhibitors and blockers, and has physiologic concentrations of sodium (150 mM) as the sole permeant ion (in mM: 1 glutamate, 0.1 glycine, 150 NaCl, 2.5 KCl, 1 EDTA, and 10 HEPBS, buffered at pH 8.0 with 1 N NaOH).
3. Cell-attached Patch-clamp Recording
- Open QuB data acquisition software (www.qub.buffalo.edu), and select the acquisition window under ‘layout’. Open a new QuB data file (QDF) by clicking ‘New Data’ under the drop down menu entitled ‘File’ and enter the following initial parameters: sampling rate, 40 kHz; A/D scaling, 3,000; output channel, 1; and A/D data size, 2. Adjust the amplitude scaling to 0.1 V/pA by right-clicking the data file, selecting properties, and clicking the ‘data’ tab. Note: These parameters can be refined for each setup using a model-cell in the cell-attached mode. Additional instruction on data acquisition with QuB software and QDF properties are online at www.qub.buffalo.edu.
- Select a 35 mm dish containing ion channel expressing cells and replace growth medium with 2 ml PBS containing calcium and magnesium; mount the dish onto the microscope stage and focus on the cellular field using phase contrast microscopy to evaluate that cells are healthy and well attached to the dish in monolayer fashion (Figure 1A). Switch to fluorescence detection to verify that the transfection was successful (Figure 1B). Note: The range of fluorescence intensities can be used as a crude measure of protein expression.
- For single channel recording, set the amplifier output gain to x10, patch configuration to β = 1, analog filter to 10 kHz, mode to voltage-clamp and applied voltage to +100 mV. With the voltage holding command in the OFF position, select the ‘seal test’ button.
- Based on fluorescence and cell health, choose a cell to patch. Verify under phase contrast that the cell is well attached to the dish, has a large portion of the cell surface exposed for patching, and otherwise looks healthy. Note: Maintain phase contrast illumination to avoid bleaching the cell during the approach and patch-clamping.
- Fill a freshly polished pipette with just enough solution so it makes contact with the electrode and shake gently to dislodge air bubbles that may be trapped in the tip. Secure the recording pipette onto the amplifier headstage by tightening the sealing screw of the pipette holder and making sure that the silver wire is immersed in the pipette solution.
- Using a small (5 cc) plastic syringe, which is connected to the pipette holder by tubing, gently apply positive pressure to prevent impurities from entering and clogging the tip during the approach (Figure 2A).
- Using the micromanipulator, direct the pipette into the bath and position it directly over the cell selected for patching (Figure 1C), closing the electrical circuit. Take note of the oscilloscope, which should indicate a rectangular waveform corresponding to the amplifier’s seal test signal (Figure 2B). Note: Upon entry into the bath, the pipette resistance within the optimal range is 12-24 MΩ. For a 5 mV test signal, the measured current range corresponds to ~20-40 pA.
- While monitoring pipette position visually through the microscope and pipette resistance electrically on the oscilloscope, continue the approach in small increments until the pipette impinges gently on the cell, and the test signal decreases slightly to indicate increased resistance (Figure 2B).
- To form a seal, pick up the syringe and apply slight negative pressure through the lateral tubing by pulling the syringe plunger, which pulls the cellular membrane into the tip of the recording pipette and initiates the formation of a GΩ resistance seal10. Take note of the test signal waveform on the oscilloscope, in which seal formation is indicated by its complete flattening, with only capacitive transients visible (Figure 2B). Note: If signal does not flatten completely or the baseline becomes noisy, this indicates a weak seal with substantial current leak around the seal. This will prevent resolving one channel currents. If this is the case, withdraw the pipette from the cell and away from the bath, remove it from the head stage and discard it. Repeat the process with a freshly polished pipette until obtaining a seal in the adequate range (≥ 1 GΩ).
- On the amplifier, switch the external command toggle from ‘seal test’ to ‘off’; switch the voltage holding command to positive (which was set previously to ‘off’); and increase the gain to x100. Observe the oscilloscope for channel activity, which, if present, will be displayed as square upward deflections from the previously flat baseline (Figure 2C).
- If channel activity is displayed on the oscilloscope, acquire data into the previously opened digital file in QuB, by pressing the ‘play’ button followed by the ‘record’ button. To stop acquiring data, press the stop button in QuB, and save the QDF file to an easily retrievable location on the computer hard drive by selecting ‘Save Data As…’ in the drop down menu entitled ‘File’.
4. Data Preprocessing and Idealization
Note: Important information can be extracted from single channel recordings by statistical analyses which assigns each data point to an appropriate conductance class (in the simplest case, closed or open). This process is referred to as data idealization and a brief description of data idealization with the segmental k means (SKM) method11 in QuB is described below.
- Open the data file in QuB, and view the current traces in the ‘Pre’ interface under ‘layout’. Display the recorded file unfiltered (remove digital filter) by unchecking the box labeled ‘Fc.’
- Visually scan the record to spot irregularities and artifacts (Figure 4A). Correct brief current spikes that occur within the trace (Figure 4A) by selecting an adjacent clean region of the same conductance class, highlighting this region, right-clicking and selecting ‘set erase buffer.’ Zoom in on the spike until individual sample points are visible, select the region to be replaced and erase by highlighting only this region and then right-click ‘erase’.
- Define the zero current baseline for the entire record by selecting an early portion of the record where the baseline is stable, highlight, right-click and select ‘set baseline’. Verify that the guideline which appears accurately represents the baseline level (purple in Figure 4B)
- Identify points in the record where the raw data baseline deviates visibly from the set baseline. Correct this by selecting a small section of baseline within the deviating region, right-click and select the ‘add a baseline node’ command.
- Identify regions of the recording containing excess noise or artifacts that cannot be easily corrected (Figure 4C). Highlight the region to be discarded, right-click, and select ‘delete.’ Note: In this case kinetic information will be lost: the processed record will be shorter and the points occurring after the splice point will appear to be continuous with the pre-noise region.
- To idealize records using the SKM algorithm11, highlight a portion of the trace containing both open and closed events and enter the ‘Mod’ interface under ‘Layout.’ In the “model” panel, highlight a clean portion of the trace that is representative of the baseline throughout the file, right-click the black square (closed state) and select “grab”. Do the same for channel openings by highlighting the open conductance, right click the red square in the “model” panel and select “grab”.
- Perform the idealization for the entire record by selecting the ‘File’ button under ‘Data Source.’ Right-click on the ‘Idealize’ tab underneath the ‘Modeling’ section to verify that the desired parameters for analysis are correct, and then click ‘Run.’ The result of the idealization, along with amplitude histogram for the entire file, is overlaid with the data to allow for visual inspection of the idealization (Figure 5). Note: Inadequate idealization may lead to the generation of ‘false events,’ in which QuB detects channel openings and closures that do not actually occur. Within the recording resolution, which is set by the amplifier’s analog filter and the sampling rate, the resolution with which SKM detects open and closed events can be controlled by setting a dead time for the analyses. Optimal dead times must be selected by trial and error and will depend on sampling rate, however, a good rule of thumb is to select a dead time that is 2-3 samples12.
- To verify that the idealization accurately represents the raw data, manually scan the idealized trace. Upon identification of errors in the idealization, highlight the trace over the false event, right click and select ‘Join Idl.’ Note: For additional options and a detailed explanation of various commands and functions in QuB, consult the QuB Manual online (www.qub.buffalo.edu).
Results
Recombinant NMDA Receptors
NMDA receptors bind and respond to the concomitant action of two co-agonists: glutamate and glycine. They assemble as heterotetramers of two glycine binding GluN1 subunits and two glutamate binding GluN2 subunits. GluN2 subunits are encoded by four genes (A-D) and of these the most widely transcribed forms in brain are GluN2A in adult and GluN2B in juvenile animals. Because of the diversity of NMDA receptor subtypes in native preparations, expressing receptors in HEK293 cells (Figure 1A) allows for control of subunit composition, as well as the ability to record current from channels using a finely polished glass pipette (Figure 1C).
Once the pipette touches the cell, a clear reduction in amplitude of the test pulse waveform occurs (Figure 2B), indicating the ability to form a seal. An adequate seal containing one channel produces clear channel activity, displayed as downward deflections from baseline, with a good signal to noise ratio upon application of a positive voltage (Figure 2C). Maximal channel activity for wild type recombinant NMDA receptors can be achieved when both agonists are present in high concentrations, and when inhibitors and channel blockers are absent. This is ideal, so that when a patch contains more than one channel, simultaneous openings are immediately apparent13 (Figure 3B). For proteins with very low activity levels, the probability that a stretch of one level openings originates from only one channel can be calculated if the channel open probability is known or can be approximated14. Because of this, longer observation periods may be necessary.
Under these conditions, and when applying a pipette holding potential of +100 mV (leading to an approximate membrane potential of -120 mV), single recombinant GluN1/GluN2A and GluN1/GluN2B are open with high probability (Po, 0.3-0.5) to one relatively high conductance level (> 50 pS) (Figures 3A and 5B)15-17. When recording, current noise spikes, baseline drifts, or periods of excessive noise may manifest (Figures 4A-C), however as mentioned, these may be corrected if brief and minor. It is important, however, that channel activity is recorded uninterrupted for a sufficient amount of time (≥10 min, 10,000 events) to guarantee that the full breadth of channel behaviors is captured.
The data obtained from such recordings can provide information on both channel kinetics and permeation properties. Here, we demonstrate idealization performed by QuB using the SKM algorithm (Figure 5A), however data idealization may be performed using other software programs such as pClamp or SCAN12, and may be carried out using different algorithms or criteria, such as the half threshold method, with each of these options containing their own advantages and disadvantages. Fitting of these data to kinetic models may be performed in order to gain further insight into the behaviors of the ion channel. Maximum likelihood fitting can be performed with software such as QuB or HJCFIT18, in which the algorithms implemented by each program have their own benefits. While the idealization demonstrated in Figure 5 only requires the simplest possible model of one closed state and one open state to be performed, fitting a complete kinetic model for an ion channel requires sequentially adding closed and open states until a certain criterion is reached. This process has demonstrated that wild type GluN1/GluN2A receptors have five kinetically distinct closed states and two to four kinetically distinct open states (Figure 5C)19, in which these gating characteristics are crucial for determining the shape of the NMDA receptor mediated synaptic signal20,21. This style of analysis can be extended to other ion channels of smaller conductance, such as AMPA receptors, to gain insight to their own distinct gating mechanisms22,23,24. One caveat is, however, since AMPA receptors have multiple conductance levels, successful idealization using QuB may require additional states are incorporated into a prebuilt model.
These methods can also be extended to gain information about ion channel permeation and conductance by altering the permeating ion composition and/or concentration. Recording activity through single GluN1/GluN2A receptors using the methods described here, but replacing 150 mM NaCl with 75 mM CaCl2 in the recording pipette, yields currents with ~20% of the conductance (~10 pS). This demonstrates that while calcium permeates NMDA receptors at high levels in physiologic conditions, it actually traverses the channel more slowly than sodium ions, indicating that there may be a potential calcium binding site within the permeation pathway. Additionally, despite this small conductance, the recordings can be adequately idealized using the SKM algorithm in QuB, unveiling the existence of an intermediate sublevel conductance, which is about 50% the current amplitude of the main conductance level (Figures 6A and B). These sublevel openings, however, can only be idealized in QuB when an additional conductance class is incorporated into the initial kinetic model. Further kinetic analyses revealed that, under these conditions, receptors still exhibit five kinetically distinct closed states, however these states have extremely different time constants and occupancies compared to when the channel passes only sodium ions (Figure 6C). In addition, only two open states are observed under these conditions demonstrating that, in addition to influencing channel conductance, calcium ions are able to modulate receptor gating.
There is no certain way to obtain only one channel patches. Instead, several experimental manipulations can contribute to increasing the likelihood of success. First, aim for low level of channel expression by evaluating the fluorescence intensity of the transfected cells (Figure 1B). Successful approaches may be to: decrease the total amount of cDNA used for transfection or to decrease the amount of cDNA for a required subunit, as is GluN1; to decrease the time of incubation with the DNA/calcium phosphate precipitate; and to select for patching only dimly fluorescent cells from the field of view. These approaches should be pursued if the patches obtained frequently contain multiple channels. In addition, decreasing the size of the pipette tip can also contribute to trapping only one channel in the patch. Ultimately however, one becomes successful in obtaining one-channel patches by systematically refraining from recording for long periods from patches that clearly contain more than one channel.
Recombinant PIEZO1 Channels
The methods described in this protocol can be readily applied to any ligand gated ion channel, and indeed can be adapted to record one channel activity from any ion channel, whether activated by chemicals, voltage, force, temperature, or other means. One example of how this protocol can be adapted to record one channel currents from other ions channels, specifically mouse PIEZO1, a mechanosensitive ion channel, is presented below (Figure 7)25,26.
As with the NMDA receptor channels, PIEZO1 and GFP are expressed in HEK293 cells by calcium phosphate mediated transfection and cells are used 24-48 hr post transfection as described in section 1.2. Because PIEZO1 is activated by membrane stretch, care should be taken to manipulate the membrane gently during patch formation and appropriate devices for delivery and control of the mechanical force applied should be available. These conditions can be achieved by making larger recording pipettes, with resistance in the 2-3 MΩ range and using a high speed pressure clamp device (HSPC) connected to the recording pipette through the pipette holder on the amplifier headstage. The amplifier settings are similar to those described for NMDA receptors in section 3.3, except for switching on the ‘external’ command knob so that the amplifier can be controlled through the acquisition software.
To record activity from PIEZO1, use a recording pipette filled with (in mM): 130 NaCl, 5 KCl, 10 HEPES, 1 CaCl2, 1 MgCl2, 10 TEA-Cl, pH 7.3 with NaOH. Under these conditions, openings can be monitored as inward sodium currents, which will appear on the oscilloscope as downward deflections from a zero current baseline. Place the recording pipette on the amplifier head stage and make sure the dial on the HSPC is at zero. Before entering the bath, apply 3-5 mmHg of positive pressure. Using the micromanipulator, lower the pipette into the bath, check for desired pipette resistance, and bring the pipette in close proximity to the selected cell as described in section 3.6. Gently touch the cell under microscope guidance and by monitoring the oscilloscope, observe a slight reduction in the amplitude of the seal test waveform in a similar fashion as done for NMDA receptors (section 3.7). Quickly release the positive pressure applied through the pipette by changing the pressure holding level from 3-5 to 0 mmHg. Wait for a GΩ seal to form by monitoring the seal test wave form. In this case, no negative pressure is applied to form a seal. Once an optimal seal is obtained press the ‘record’ button in QuB to start acquiring data. Figure 7 shows a representative trace of mPIEZO1 single-channel currents activated by applying -20 mmHg of pressure to the patch pipette. These currents were low pass filtered at 2 kHz and sampled at 20 kHz.
In contrast to ligand gated channels with extracellular ligand binding domains, the stimulus activating mechanosensitive channels can be varied under 2 protocols. The first is ‘gap-free,’ where a constant negative pressure is applied to the patch for the entire recording duration. This protocol is useful in obtaining minutes long recordings and is most successful with smaller pressure stimuli (0 to 20 mmHg), which preserve membrane integrity. Activity produced by high pressure, which is likely to rupture the membrane, is best obtained with ‘episodic’ recordings, where pulses of varying pressures can be applied to the patch for shorter time periods (Figure 7). As with ligand gated channels, recordings from cell attached one channel patches provide a wealth of information regarding both the conductance and the gating properties of the channel under investigation.
Neuronal NMDA Receptors
The method described here for cell-attached one-channel recording can be used to obtain information about the conductance and gating properties of channels endogenous to a particular cell type and/or developmental stage. As is the case with many other heteromeric channels, the exact molecular composition of native NMDA receptors is not known. By comparing results obtained from recombinant receptors of known composition with those obtained from native preparations, hypotheses about subunit composition and the function of channels in their native environment can be formulated or tested17.
Neurons were isolated from prefrontal cortices of rat embryos and grown in culture for up to 6 weeks17. In addition to components described for recombinant NMDA receptor recordings in section 2.2, the pipette solution also contained CNQX (20 µM) and bicuculline (10 µM) to inhibit native AMPA and GABA receptors, respectively. Depending on the age of the culture, the records obtained from native NMDA receptors revealed kinetics that were quite different. Recordings from early (Figure 8A, 5 days in vitro) culture more closely resemble kinetics described for GluN1/GluN2B receptors and recordings from late (Figure 8B, 27 days in vitro) cultures more closely resemble kinetics described for GluN1/GluN2A receptors (Figures 3A and 5A). This observation is consistent with patterns of NMDA receptor expression isoforms and with careful characterizations of currents recorded from cell attached one-channel patches in hippocampal cultures16.

Figure 1. Selecting a HEK293 cell for cell attached recording. A) HEK293 cells cultured in a 35 mm dish are placed on the microscope stage and viewed with phase contrast at 40X magnification. B) GFP fluorescence from the same visual field as in panel A identifies transfected cells. Arrow indicates a cell that expresses GFP, appears healthy, and is in a position amenable for pipette access. C) The recording pipette is brought in close vicinity to the selected cell using a fine motion manipulator under visual guidance. Please click here to view a larger version of this figure.

Figure 2. Cell attached seal formation. A) A small syringe connected to the side of the pipette holder allows manual control of pressure within the pipette. B) The current passing through the pipette immersed in bath solution in response to the amplifier test, which at 5 mV (0.5 kHz) is 18 pA, and corresponds to a pipette size of 28 MΩ. Upon touching the cell (left arrow), the level of the observed current decreases, indicative of increased pipette resistance. Applying negative pressure through the pipette (right arrow) initiates seal formation and reduces the signal produced by the test pulse to only capacitive transients. C) Absent a test pulse, and if no voltage is applied through the pipette (0 V), the baseline is stable (left of arrow). Applying positive voltage (arrow, +100 mV) produces stochastic unitary currents that indicate channel openings. Red dotted line indicates the zero current baseline.

Figure 3. Cell attached currents recorded from GluN1/GluN2A receptors. A) One-channel patch: a 50 sec segment of continuous recording illustrates channel openings to a single uniform amplitude. B) Multiple-channel patch: a 50 sec segment of continuous recording illustrates channel openings to two amplitude levels indicating that the patch contains at least 2 active channels. Red dotted line indicates zero current baseline. Please click here to view a larger version of this figure.

Figure 4. Data processing. A) Correction for noise spikes. Display data unfiltered and manually replace the extraneous signal (red) with baseline signal. Expanded view illustrates a spike before (middle) and after (lower) the spike (red) was replaced with baseline signal. B) Correction for baseline drift. Early in the record, select a small segment of baseline and set it as the zero current level for the entire record (purple line). Correct baseline drift by selecting a small portion of drifted baseline (arrow) and adding a baseline node (purple circle). C) Longer periods of record with noisy baseline (red) that are difficult to correct can be deleted. Please click here to view a larger version of this figure.

Figure 5. Data idealization. A) Current traces (black) were recorded from one GluN1/GluN2A receptor passing only sodium ions with the cell-attached patch-clamp technique. Idealized data points (red) are illustrated for a 30 sec one channel segment. These overlap well, indicating that the idealization is accurate. B) Histogram of current amplitudes illustrate a distribution that is well described by only two Gaussian functions with peaks at zero (0.02 ± 0.8 pA), indicative of closed channel events and at 10.3 ± 1.3 pA indicative of only one type of open channel events for the entire recording duration (130 min). C) Closed (left) and open (right) dwell time histograms for entire recording shown in (A). The probability density function for the histograms (thick lines) and individual kinetic components (thin lines) are overlaid and were calculated by fitting the data to a model containing five closed states and three open states. Insets provide the time constant (τ) and relative area (a) for each of the individual kinetic components.

Figure 6. Calcium currents through single NMDA receptors. A) Current traces (black) were recorded from one GluN1/GluN2A receptor passing only calcium ions with the cell-attached patch-clamp technique. Idealized data points (red) are illustrated for 30 sec segment. B) Histogram of current amplitudes illustrate a distribution that is well described by three Gaussian functions with peaks at zero (0 ± 0.3 pA), indicative of closed channel events, 1.3 ± 0.4 pA indicative of open channel events to a sublevel conductance, and 2.1 ± 0.3, indicative of open channel events to the main conductance level. C) Closed (left), main conductance level open state (middle) and sublevel conductance open state (right) dwell time histograms for entire recording shown in (A). The probability density function for the histograms (thick lines) and individual kinetic components (thin lines) are overlaid and were calculated by fitting the data to a model containing five closed states, two main conductance level open states and one sublevel conductance open state. Insets provide the time constant (τ) and relative area (a) for each of the individual kinetic components.

Figure 7. Cell attached one channel recording from mPIEZO1 expressed in HEK293 cells. Activity is elicited by applying -20 mmHg pressure with a HSPC device through the patch pipette, during constant application of voltage (+80 mV). Red dotted line indicates the zero current level.
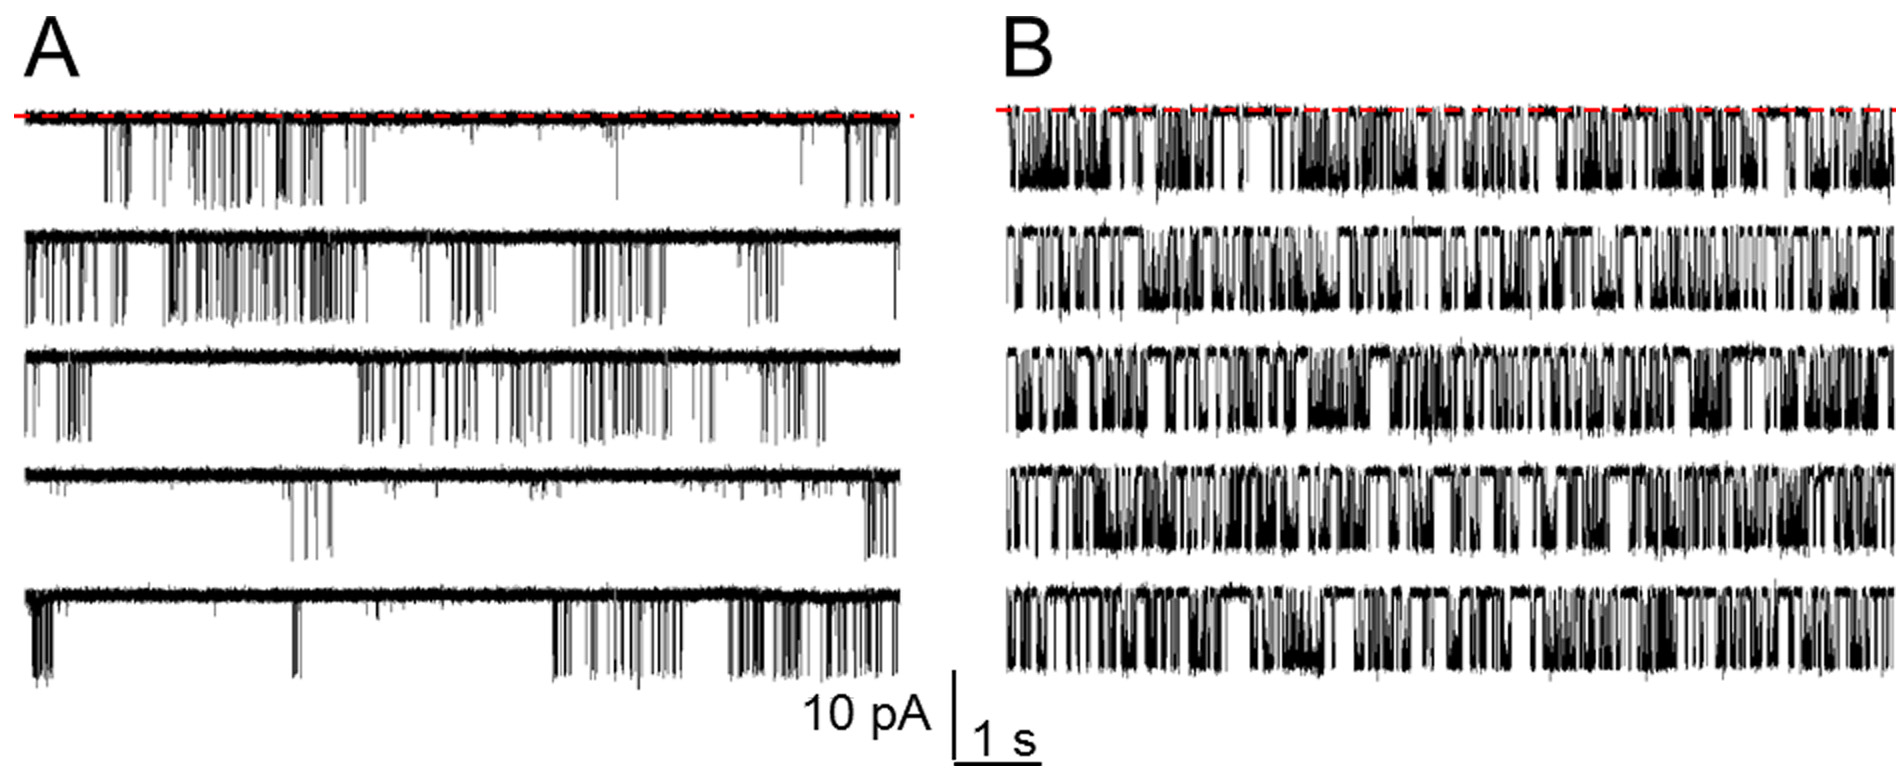
Figure 8. Cell attached one channel recording from native channels. The pipette was attached at the soma of a neuron that was dissociated from the prefrontal cortex of a rat embryo and was maintained in culture for 5 days (A) or 27 days (B). Continuous NMDA receptor activity was recorded with pipette solutions containing glutamate (1 mM) and glycine (0.1 mM), and also CNQX (20 µM) and bicuculline (10 µM) to inhibit native AMPA and GABA receptors, respectively. Activity was elicited by applying +100 mV through the recording pipette. Red dotted line indicates the zero current level.
Discussion
In the ion channel field, an important area of research is dedicated to understanding the sequence of events that leads to channel opening or the channel’s gating mechanism. For most channels, this process is complex and involves several kinetic steps that cannot be deduced from a macroscopic multi-channel signal. In contrast, experiments can be designed where observing the sequence of open/closed events in single channel record can produce more detailed information about gating mechanisms. In the methods described here, the externally located ligand binding domain possessed by NMDA receptors allows for minimally invasive patch-clamp recordings to be performed under constant conditions. This protocol may need to be adapted in order to be suitable for investigating other ligand gated ion channels depending on both ligand and receptor properties.
Records of single channel activity provide two types of valuable information. First, because the unitary current amplitude can be measured directly, experiments can be designed to gain information about pore properties such as channel conductance, permeability and selectivity. Second, because the duration of open and closed events can also be measured directly from the record, experiments can be designed to gain kinetic information about gating and thus, make inferences about the operational mechanism of the channel. For both types of experiments, meaningful statistical analysis requires binning each individual point from the current trace to a specific conductance class. Presented here was one such method of doing this, by using the segmental k-means (SKM)11 algorithm, however, this can be accomplished by several more or less sophisticated algorithms including half-threshold, SCAN12, Baum-Welch, Viterbi, etc.
Recordings using the cell-attached configuration are powerful in that ion channels are preserved in biological membranes with unperturbed intracellular milieus. Because of this, it is crucial that membrane seals are adequately formed and preserved throughout the recording for two purposes: 1) experimental continuity and 2) maintaining a favorable signal-to-noise ratio (peak to peak baseline noise <2 pA). The size and shape of the pipette tip generated determines the probability of a successful membrane seal containing exactly one channel. A flat tip ensures that when the pipette approaches the cell it will touch and press onto the cell membrane with the entire tip surface at once, helping to seal uniformly onto the cell. A pipette with a tip that is too wide will be less likely to result in one-channel patches; in contrast, upon pulling a pipette with a tip that is too narrow will result in an omega-shaped membrane loop that may seal at the base and clog the pipette10.
A favorable signal to noise ratio can be managed by minimizing sources of electrical noise. The headstage cooling feature on the Axopatch 200B has allowed for optimal signal resolution; however noise can still be produced by any of the instrumentation involved in the electrophysiology set up, as well as external sources such as light and unrelated electronics. Fortunately, several strategies can be implemented to minimize noise to a desired level2,27. Briefly, make sure that pieces of equipment that are capable of producing noise are grounded to a single point within the setup. When doing this, it is important to prevent the formation of ground loops which will cause significant noise. Additionally, if 60 cycle noise is present, be sure to turn off any lights that may be interfering with the recording signal. Finally, placing a Faraday cage around the recording apparatus will prevent nearby hindrances from causing electrical noise.
Observing one channel for a long period of time has demonstrated that gating conformational changes can occur over a broad range of time scales. Temporally, patch-clamp data are limited at the ‘short’ end by the bandwidth of the amplifier and the rate at which the amplified signal is digitized and at the ‘long’ end by the observation window. For conformational changes that are faster than the low limit, patch-clamp recordings can only offer information when coupled with complementary experimental approaches. For conformational changes that occur with very slow rates, and thus are sampled infrequently, one can increase the number of observations or increase the duration of the record, however, this may not always be possible.
Despite these limitations, patch-clamp data, particularly when obtained from an individual channel, often contain more information than immediately extractable with current computational methodologies. Thus, the expectation is that future increases in computational capacity and in the sophistication of analysis algorithms will make possible additional applications. Upon the advent of such advances, it is foreseeable that patch-clamp recordings from single channels may be able to occur concurrently with FRET measurements, calcium imaging or even in vivo preparations to provide further information on the structure, function and dynamics of ion channels in both native and controlled environments.
As the diversity of ion channels investigated increases, detailed understanding of their gating mechanisms and ultimately understanding how their operation contributes to their unique biological functions will benefit from single molecule observations. In particular, data obtained with the one-channel patch-clamp promise to inform about unitary conductance properties and gating sequences for recombinant and native channels.
Disclosures
The authors of this manuscript declare that they have no competing financial interests.
Acknowledgements
This work was supported by F31NS086765 (KAC), F31NS076235 (MAP), and R01 NS052669 (GKP) and EIA9100012. The authors thank Eileen Kasperek for expertise and assistance with molecular biology and tissue culture; and Jason Myers for sharing data obtained from early prefrontal cortical neurons.
Materials
| Name | Company | Catalog Number | Comments |
|---|---|---|---|
| Chemicals | Sigma | Various | |
| Borosillicate Glass | Sutter | BF-150-86-10 | |
| Bright field inverted microscope | Olympus | 1x51 | Nikon also has similar microscopes |
| Fluroescent box | X-cite | Series 120 | |
| Liquid Light Guide | X-cite | OEX-LG15 | |
| Micromanipulator | Sutter Instruments | MP-225 | |
| Oscilloscope | Tektronix | TDS1001 | |
| Amplifier | Molecular Devices | Axon Axopatch 200B | |
| Table | TMC | 63561 | |
| NIDAQ card | National Instruments | 776844-01 | |
| Puller | Narishige | PC-10 | |
| Polisher | Narishige | Microforge MF-830 | |
| Faraday Cage | TMC | 8133306 | |
| High Speed Pressure Clamp | ALA Scientific Instruments | ALA HSPC | |
| Pressue/Vaccuum Pump | ALA Scientific Instruments | ALA PV-PUMP | For HSPC-1 |
References
- Neher, E., Sakmann, B. Single-channel currents recorded from membrane of denervated frog muscle fibres. Nature. 260, 799-802 (1976).
- Hamill, O. P., Marty, A., Neher, E., Sakmann, B., Sigworth, F. J. Improved patch-clamp techniques for high-resolution current recording from cells and cell-free membrane patches. Pflugers Arch. 391, 85-100 (1981).
- Piccolino, M. Animal electricity and the birth of electrophysiology: the legacy of Luigi Galvani. Brain Research Bulletin. 46, 381-407 (1998).
- Albright, T. D., Jessell, T. M., Kandel, E. R., Posner, M. I. Neural Science: A Century of Progress and the Mysteries that Remain. Neuron. 25, (2000).
- Popescu, G. K. Modes of glutamate receptor gating. The Journal of Physiology. 590, 73-91 (2012).
- Morimoto-Tomita, M., et al. Autoinactivation of Neuronal AMPA Receptors via Glutamate-Regulated TARP Interaction. Neuron. 61, 101-112 (2009).
- Thomas, P., Smart, T. G. HEK293 cell line: A vehicle for the expression of recombinant proteins. Journal of Pharmacological and Toxicological Methods. 51, 187-200 (2005).
- Huang, Z., Li, G., Pei, W., Sosa, L. A., Niu, L. Enhancing protein expression in single HEK 293 cells. Journal of Neuroscience Methods. 142, 159-166 (2005).
- Raymond, L. A., Moshaver, A., Tingley, W. G., Huganir, R. L. Glutamate receptor ion channel properties predict vulnerability to cytotoxicity in a transfected nonneuronal cell line. Mol Cell Neurosci. 7, 102-115 (1996).
- Suchyna, T. M., Markin, V. S., Sachs, F. Biophysics and Structure of the Patch and the Gigaseal. Biophysical Journal. 97, 738-747 (2009).
- Qin, F. Restoration of single-channel currents using the segmental k-means method based on hidden Markov modeling. Biophys J. 86, 1488-1501 (2004).
- Colquhoun, D., Sigworth, F. J. chapter in Single-channel recording. 2nd edn eds B. Sakmann and E Neher. , Plenum Press. (1995).
- Popescu, G., Auerbach, A. Modal gating of NMDA receptors and the shape of their synaptic response. Nat Neurosci. 6, 476-483 (2003).
- Colquhoun, D., Hawkes, A. G. Stochastic properties of ion channel openings and bursts in a membrane patch that contains two channels: evidence concerning the number of channels present when a record containing only single openings is observed. Proc R Soc Lond B Biol Sci. 240, 453-477 (1990).
- Kussius, C. L., Kaur, N., Popescu, G. K. Pregnanolone Sulfate Promotes Desensitization of Activated NMDA Receptors. J. Neurosci. 29, 6819-6827 (2009).
- Amico-Ruvio, S., Popescu, G. Stationary gating of GluN1/GluN2B receptors in intact membrane patches. Biophysical Journal. 98, 1160-1169 (2010).
- Borschel, W. F., et al. Gating reaction mechanism of neuronal NMDA receptors. J Neurophysiol. 108, 3105-3115 (2012).
- Colquhoun, D., Hatton, C. J., Hawkes, A. G. The quality of maximum likelihood estimates of ion channel rate constants. The Journal of Physiology. 547, 699-728 (2003).
- Kussius, C. L., Kaur, N., Popescu, G. K. Pregnanolone Sulfate Promotes Desensitization of Activated NMDA Receptors. The Journal of Neuroscience. 29, 6819-6827 (2009).
- Popescu, G., Auerbach, A. Modal gating of NMDA receptors and the shape of their synaptic response. Nat Neurosci. 6, 476-483 (2003).
- Popescu, G., Robert, A., Howe, J. R., Auerbach, A. Reaction mechanism determines NMDA receptor response to repetitive stimulation. Nature. 430, 790-793 (2004).
- Prieto, M. L., Wollmuth, L. P. Gating Modes in AMPA Receptors. The Journal of Neuroscience. 30, 4449-4459 (2010).
- Poon, K., Nowak, L. M., Oswald, R. E. Characterizing Single-Channel Behavior of GluA3 Receptors. Biophysical Journal. 99, 1437-1446 (2010).
- Smith, T. C., Wang, L. -Y., Howe, J. R. Heterogeneous Conductance Levels of Native AMPA Receptors. The Journal of Neuroscience. 20, 2073-2085 (2000).
- Coste, B., et al. Piezo1 and Piezo2 Are Essential Components of Distinct Mechanically Activated Cation Channels. Science. 330, 55-60 (2010).
- Coste, B., et al. Piezo proteins are pore-forming subunits of mechanically activated channels. Nature. 483, 176-181 (2012).
- Benndorf, K. chapter in Single-channel recording. 2nd edn eds B. Sakmann and E Neher. , Plenum Press. (1995).
Reprints and Permissions
