Mouse embryonic fibroblast can be reprogrammed into induced pluripotent stem cells at low efficiency by the forced expression of transcription factors Oct-4, Sox-2, Klf-4, c-Myc. The rare intermediates of the reprogramming reaction are FACS isolated via labeling with antibodies against cell surface makers Thy-1.2, Ssea-1, and Epcam.
Method Article
Cell Surface Marker Mediated Purification of iPS Cell Intermediates from a Reprogrammable Mouse Model
* These authors contributed equally
In This Article
Summary
Abstract
Mature cells can be reprogrammed to a pluripotent state. These so called induced pluripotent stem (iPS) cells are able to give rise to all cell types of the body and consequently have vast potential for regenerative medicine applications. Traditionally iPS cells are generated by viral introduction of transcription factors Oct-4, Klf-4, Sox-2, and c-Myc (OKSM) into fibroblasts. However, reprogramming is an inefficient process with only 0.1-1% of cells reverting towards a pluripotent state, making it difficult to study the reprogramming mechanism. A proven methodology that has allowed the study of the reprogramming process is to separate the rare intermediates of the reaction from the refractory bulk population. In the case of mouse embryonic fibroblasts (MEFs), we and others have previously shown that reprogramming cells undergo a distinct series of changes in the expression profile of cell surface markers which can be used for the separation of these cells. During the early stages of OKSM expression successfully reprogramming cells lose fibroblast identity marker Thy-1.2 and up-regulate pluripotency associated marker Ssea-1. The final transition of a subset of Ssea-1 positive cells towards the pluripotent state is marked by the expression of Epcam during the late stages of reprogramming. Here we provide a detailed description of the methodology used to isolate reprogramming intermediates from cultures of reprogramming MEFs. In order to increase experimental reproducibility we use a reprogrammable mouse strain that has been engineered to express a transcriptional transactivator (m2rtTA) under control of the Rosa26 locus and OKSM under control of a doxycycline responsive promoter. Cells isolated from these mice are isogenic and express OKSM homogenously upon addition of doxycycline. We describe in detail the establishment of the reprogrammable mice, the derivation of MEFs, and the subsequent isolation of intermediates during reprogramming into iPS cells via fluorescent activated cells sorting (FACS).
Introduction
Embryonic stem (ES) cells are derived from the inner cell mass of blastocyst stage embryos1. Under appropriate culture conditions they self-renew and remain pluripotent. In 2006 Yamanaka and colleagues demonstrated that mature cells can be reprogrammed into so called induced pluripotent stem (iPS) cells by forced expression of the transcription factors Oct-4, Klf-4, Sox-2, c-Myc (OKSM) 2. iPS cells, like ES cells, can give rise to all cell types of the body, however, they are free of the ethical constraints surrounding the generation of ES cells3. Furthermore, iPS cells carry the promise of personalized regenerative medicine and hold tremendous potential for applications like disease modeling and in vitro drug screening4,5. In order for reprogramming technology to fulfill this potential, the basic mechanism of nuclear reprogramming needs to be fully understood. However, efforts to dissect the reprogramming pathway have been hampered by the fact that only a very small number of cells reprogram (0.1-1%). Successfully reprogramming fibroblasts have been reported to undergo a distinct series of events including a mesenchymal to epithelial transition 6-10 and, in the final stages of reprogramming, activation of the endogenous core pluripotency network 11-14. We and others 12,13,15-17 have recently identified a set of cell surface markers that allows for the separation of rare intermediates from the refractory bulk population. Reprogramming mouse embryonic fibroblasts (MEFs) undergo changes in the expression of Thy-1.2, Ssea1 and Epcam (among others) during the 2-week-long reprogramming process15. Early during reprogramming a subset of MEFs down-regulate expression of fibroblast identity marker (Thy-1.2) and then start expressing the pluripotency-associated marker Ssea-112. During the final stages of reprogramming Ssea1-positive cells reactivate endogenous pluripotency genes such as Oct-410-13,15. This last transition is marked on the cell surface by detectable expression of Epcam (see Figure 1) or in a later stage Pecam 15. Recently, O’Malley et al. reported the use of CD44 and iCAM1 as alternatives or complementary to Thy-1.2 and Ssea-1 for the identification of reprogramming intermediates. We have previously FACS extracted reprogramming intermediates from Day 0, Day 3, Day 6, Day 9 and Day 12 reprogramming cultures, as well as from established iPS cell lines based on these cell surface markers 15,18. For the below described reprogramming system and conditions we have shown at the single cell level that although the populations are quiet homogenous, there is a certain degree of heterogeneity in the identified intermediate populations. It should be noted that only a subset of cells within these populations are able to progress to the respective next stage of the reprogramming process and give rise to iPS cell colonies at different efficiencies, which have been extensively characterized previously15,19. Moreover, the reprogramming efficiency of these populations will depend as well on the re-plating and culture conditions. To increase experimental reproducibility we use a reprogrammable mouse strain that has been engineered to express a transcriptional transactivator (m2rtTA) under control of the Rosa26 locus and a polycistronic OKSM cassette under control of a doxycycline responsive promoter20,21. Using this mouse model circumvents the unwanted side effects of traditional viral methods of iPS cell generation, i.e., a heterogeneous starting population with cell to cell variability in number and location of integration sites of viral inserts. Two transgenic mouse strains (OKSM, m2rtTA), available as homozygous founder animals at the Jackson Laboratory, have to be crossed in order to establish the reprogrammable mouse model (see Figure 2). In this manuscript we describe in detail how to derive MEFs, generate iPS cells, and isolate the reprogramming intermediates at various stages of the conversion process by FACS.
Protocol
1. Instrument Settings/Reagent Preparation/Genotyping
- Prepare iPS cell medium: Supplement 500 ml Knockout DMEM media with 75 ml fetal bovine serum (FBS), 5 ml L-glutamine, 5 ml Non-essential amino acids, 500 µl β-Mercaptoethanol, 5 x 10⁵ units Leukaemia inhibitory factor (LIF). Please refer to Materials List for product and purchasing information for reagents used in the context of this manuscript.
- Prepare MEF medium: Supplement 500 ml DMEM media with 50 ml FBS, 5 ml L-glutamine, 5 ml Non-essential amino acids, 5 ml Sodium pyruvate, 500 µl β-Mercaptoethanol.
- Prepare freezing medium: For 10 ml, combine 9 ml of FBS with 1 ml of DMSO.
- Prepare Gelatin coated dishes Add 3-5 ml 0.1% porcine gelatin solution to a T75 flask, incubate at RT for at least 10 min and aspirate right before use.
- Prepare FACS labeling medium: For 10 ml, combine 9.9 ml of PBS with 0.1 ml of FBS.
- Perform a genotyping PCR for the Rosa26 m2rtTA locus: Perform reactions with Taq DNA polymerase according to manufacturer’s instructions. Use a modified MgCl2-concentration of 3.5 mM and the following 3 primers: oIMR8052: 5’ GCG AAG AGT TTG TCC TCA ACC 3’, oIMR8545: 5’AAA GTC GCT CTG AGT TGT TAT 3’, oIMR8546: 5’ GGA GCG GGA GAA ATG GAT ATG 3’. Cycling conditions: 94 °C for 3 min; 35 cycles of (94 °C for 30 sec, 65 °C for 1 min, 72 °C for 1 min); 72 °C for 2 min; hold at 12 °C. Expected product size: 650 bp for wild type allele and 340 bp for the mutant allele.
- Perform a genotyping PCR for the Collagen-StemCa/OKSM locus: Perform reactions with Taq DNA polymerase as per instructions. Use a modified MgCl2-concentration of 2.5 mM and the following 3 primers: col/frt-B: 5’ CCCTCCATGTGTGACCAAGG 3’, col/frtA1: 5’ GCACAGCATTGCGGACATGC 3’, col/frtC1: 5’ GCAGAAGCGCGGCCGTCTGG 3’. Cycling conditions: 95 °C for 1 min: 2 cycles of (94 °C for 30 sec, 70 °C for 45 sec), 6 cycles of (94 °C for 30 sec, 68 °C for 45 sec) and 30 cycles of (94 °C for 20 sec, 60 °C for 1 min); 72 °C for 5 min; hold at 12 °C. Expected product size: 331 bp for wild type allele and 551 bp for mutant allele.
- Carry out all centrifugation steps at 400 x g for 3 min at 4 °C.
2. Generation of Mouse Embryonic Fibroblasts
- Perform a timed mating between an animal of the OKSM strain with a member of the opposite gender of the m2rtTA strain. Harvest embryos at embryonic day 13.5 by culling the mother and removing the uterine horn. Prior to removal of the uterine horn, spray the abdominal region with an 80% ethanol solution, to avoid microbial contamination.
- Transfer the uterine horn into a 10 cm tissue culture dish containing 10 ml of sterile Phosphate Buffered Saline (PBS). Use sterilized surgical grade scissors to cut the uterine horn into pieces containing one embryo (see Figure 3A,B).
- Use a dissection microscope (ideally placed within a tissue culture hood) and sterilized forceps to carefully remove the uterine envelope and the extra-embryonic membranes surrounding each embryo. Transfer each embryo to a separate 10 cm dish with 10 ml of PBS.
- Proceed by removing the embryo’s head, limbs, tail and internal organs (heart, liver, intestine etc.) with the forceps (see Figure 3C). Transfer the embryo’s head into a 1.5 ml tube and freeze down so it can be used for genotyping if necessary.
- Transfer the embryo’s torso into an empty 10cm plate and use two surgical blades to mince the embryo for 2 min. Add 200 µl of trypsin/EDTA solution on top of the minced embryo and incubate for 3-5 min at RT. Continue mincing for an additional 2 min, add 2 ml of MEF media to inactivate trypsin, and then transfer into a 15 ml tube.
- Use a 1,000 µl pipette to further mechanically dissociate the tissue by gentle pipetting. Transfer to a gelatin coated 10 cm dish and add an additional 10 ml of MEF media. Note: Both normoxic and hypoxic incubators can be used for culture, refer to discussion for more information.
- After 24-48 hr the plate should be densely covered with MEFs.
- Alternatively, the cells can then be further propagated or frozen down. For the freezing of cells, remove the culture media, rinse the dish with 10 ml PBS to remove traces of media and overlay with 3 ml Trypsin/EDTA solution. Incubate for 3-5 min at 37 °C, inactivate trypsin digestion by adding 5 ml of MEF media and transfer to a 15 ml centrifugation tube. Spin down and resuspend the pellet in 3 ml freezing media. Transfer to 3 cryovials and freeze down in a cell freezing container.
3. Reprogramming of MEFs
NOTE: Pellet cells by centrifugation at 200 x g for 5 min at 4 °C and use normoxic tissue culture incubators for reprogramming. It can be beneficial to derive and expand MEFs under hypoxic conditions (5% oxygen, see discussion for more information).
- Quickly thaw a low passage cryovial (P0-P1, 2-3 Mio cells) in a water bath (37 °C) and transfer the contents into a tube with 10 ml of pre-warmed MEF media. Pellet cells, resuspend in 12 ml fresh MEF media, transfer into a gelatin coated T75 culture vessel, and allow cells to recover for 24-48 hr before proceeding. Note: MEFs can also be used directly after derivation.
- Following the removal of culture media, wash MEFs with PBS and cellularize by overlaying with a Trypsin/EDTA solution (3 ml for 3-5 min at 37 °C). Quench trypsin by adding 5 ml of MEF media and further dissociate cells by gentle mixing with a 10 ml pipette. Determine cell numbers using a hemocytometer.
- For reprogramming experiments, seed MEFs onto gelatin coated T75 flasks at densities of 6.7 x 10³ cells/cm2 (~0.5 Mio cells per flask) in iPSC media containing 2 µg/ml doxycycline. Refer to Table 1 regarding seeding recommendations to obtain around 2 Mio reprogramming intermediates for each time point. Note: Reprogramming commences with the addition of doxycycline (2 μg/ml) supplemented media
- For the first 6 days replace media every other day with fresh doxycycline supplemented iPSC media (12 ml of media per T75 flask). Beyond this point renew media on a daily basis if there are high cell numbers. Double the culture volume if media changes can only be performed every alternate day.
- Harvest reprogramming intermediates at the required time points (suggestion: Days 3, 6, 9, 12) by removing media, rinsing with appropriate volume of PBS (10 ml for a T75 flask) and overlaying with Trypsin-EDTA solution (3 ml for a T75 flask). Incubate for 3-5 min at 37 °C and quench by adding 5 ml of iPSC media followed by gentle pipetting.
- Count cell suspension with a hemocytometer (see above), pellet by centrifugation, aspirate the supernatant and resuspend cells in 10 ml of PBS to remove any traces of trypsin. Pellet cells once again, aspirate supernatant and proceed with step 4.1 to isolate the reprogramming intermediates. Note: Cells undergoing reprogramming can be cryopreserved and thawed for FACS isolation at a later stage.
- To establish fully reprogrammed iPS cultures, grow cells in dox-free iPSC media for a further 4-7 days. Note: Successfully reprogramming cultures will contain a large number of colonies by day 12 (see Figure 4). During this time, aberrant iPS cells that still require OKSM expression will disappear.
- Alternatively, to propagate the remaining fully reprogrammed iPS cultures: initially, seed irradiated MEFs at a density of 15 x 103 cell/cm2 in 12 ml of iPSC media onto a gelatin coated T75 flask one day or 6 hr prior to experiments.
- Next, cellularize iPS cell cultures by removing media, rinsing the T75 flask with 10 ml of PBS, overlaying with 3 ml of Trypsin-EDTA solution and incubating for 3-5 min at 37 °C. Quench trypsin by adding 5 ml of iPSC media followed by gentle mixing, transfer to a 15 ml conical tube, spin down and then resuspended in 10 ml iPS media.
- Transfer 500 µl of this cell suspension onto the irradiated MEFs (T75 flask) and allow the cultures to grow for 4-5 days. Note: Established iPS cultures can be cryopreserved or used for experiments. Clonal cell lines can be derived by picking individual iPSC colonies under a dissecting microscope 22.
- Cryo preserve confluent iPSC cultures as described in 2.8 for MEFs.
4. Antibody Labeling
- Resuspend cell pellets of reprogramming cultures, as prepared in Section 3, in FACS labeling media supplemented with antibodies (anti-Thy-1.2 pacific blue 1:400, anti-Ssea-1 biotin 1:400 and anti-Epcam Fitc 1:400). Use 200 µl of supplemented labeling mix per 5 million cells and incubate on ice.
- After 10 min gently tap the tube to resuspend the cells and incubate for an additional 10 min on ice. Add 10 ml of cold PBS per tube and spin down.
- For each tube to be stained prepare 200 µl of labeling media supplemented with 1 µl Streptavidin-PeCy7 (1:200) per 5 million cells. When cells have pelleted, carefully aspirate the supernatant and resuspend in an appropriate volume of labeling media supplemented with Streptavidin-PeCy7.
- Keep cells on ice for 10 min, tap to resuspend, incubate for another 10 min on ice, add 10 ml of cold PBS per tube, spin down and aspirate supernatant.
- Resuspend cell pellets in labeling media supplemented with propidium iodide (PI) (2 µg/ml) at approximately 1 x 10⁷ cells/ml. Remove cell clumps by passing the suspension through a 70 µm strainer. Transfer cells to an appropriate FACS tube and keep them on ice.
- Prepare separate samples with individual antibodies (anti-Thy-1.2, anti-Ssea-1 and anti-Epcam). NOTE: These are required to perform color compensation in the three channels used in the analysis. In addition, unlabeled cells are needed to set voltages and gates for sorting. Ideally iPS cells are used for compensation: stocks of 0.5-1 x 10⁶ iPS cells maintained on irradiated MEFs are stored in cryovials in liquid nitrogen. The presence of MEFs is essential to get a signal in the Thy-1.2 channel.
- Thaw a cryovial of iPS cells as described for MEFs (section 3). Following centrifugation, resuspend cells in 800 µl of labeling buffer and 200 µl of this sample is set aside as the unlabeled control.
- Use the remaining cells as compensation controls. Divide cells between three 15 ml tubes and add antibodies as follows: Pacific Blue compensation control: add 0.5 µl of the anti-Thy-1.2 Pacific Blue antibody. Fitc compensation tube: add 0.5 µl of the anti-Epcam-Fitc antibody. Pe-Cy7 compensation control: 0.5 µl of the anti Ssea-1-Biotin antibody.
- Keep cell-antibody samples on ice for 10 min, mix by tapping and incubate for 10 min on ice.
- Wash samples with 10 ml cold PBS to remove unbound antibody, spin cells down and aspirate the supernatant. Resuspend cell pellets in 200 µl of FACS labeling media.
- For anti-Ssea-1-Biotin labeled samples, add a Streptavidin-PeCy7 conjugate (1 µl per 200 µl cells). Label cells as described for primary antibody (Ssea-1-Biotin).
- Pass all samples including the unlabeled control through a 70 µm strainer and add PI (2 µg/ml). Transfer cells to FACS tubes and keep on ice until required.
5. FACS Isolation of Intermediates
NOTE: Cells are sorted using a Fluorescence Activated Cell Sorter with 405 nm, 488 nm and 560 nm excitation lasers and a 100 µm nozzle.
- Set up voltages for forward and side scatter so that the cell population is properly visualized. Draw a gate around cells as indicated in Figure 5A to exclude debris. Note: The correct set up of voltages on the cell sorter can be complex and requires an experienced FACS operator.
- Use Forward scatter (FSC) height versus FSC area to exclude aggregates (Figure 5B).
- Visualize the PI channel versus FSC to gate in on the PI negative live cells (Figure 5C).
- Use the unlabeled cells to adjust the voltages for the fluorescent channels of PB, Fitc/GFP, Pe-Cy7. Ideally position the cell population at the lower end of the respective channel.
- Set gates with the unlabeled control cells as shown in Figure 6A,B to sub fraction the reprogramming cultures into day 3, 6 and 9 populations: Ssea-1-/Thy-1.2+ cells; Ssea-1-/Thy-1.2- cells; and the reprogramming intermediates Ssea-1+/Thy-1.2- cells.
- Further subdivide the Day 9 Ssea-1+/Thy-1.2- fraction using the Pe-Cy7 versus Fitc blot; draw gates around the Sse-a1+/Epcam+ cells and the Ssea-1+/Epcam- cells. Set gates with the unlabeled control cells as shown in Figure 6C,D.
- Prefill appropriate collection tubes with iPS cell media (1-2 ml) before sorting the desired subpopulations (see Figure 7 for representative FACS profiles for MEFs, Day 3/Day 6/Day 9/Day 12 cultures and iPS cells).
- Perform FACS sorting according to manufactures protocol.
- After FACS isolation submit cells to molecular profiling (RNA/ protein extraction, chromatin immunoprecipitation, DNA methylome analysis etc.). Alternatively, the various cell fractions may be cultured.
Results
After the dissection, disaggregation and plating of an E13.5 mouse embryo, a 10 cm dish is expected to reach confluency in approximately 1 to 2 days. At this stage, it is normal for the culture to contain some adherent pieces of tissue that have not been cellularized properly. These will disappear after passaging.
Upon doxycycline induction, reprogramming MEFs undergo distinct morphological changes. Around day 6, early colony-like patches should start to emerge (Figure 4C). These will continue to grow in size upon further culture (see Figure 4D,E). A good reprogramming experiment should result in >500 colonies per T75 that was initially seeded with 5 x 10⁵ cells (Figure 4E). Established iPS cultures possess characteristic dome shaped colonies and should mostly be devoid of differentiated cells (Figure 4F). Occasionally, additional passaging of iPS cultures may be required to remove undifferentiated/partially reprogrammed cells; a confluent flask of cells can be split at a ratio of 1:10 onto a feeder layer of irradiated MEFs.
As mentioned above, morphological and molecular changes during reprogramming are reflected by changes in the FACS profiles for Thy-1.2, Ssea-1 and ultimately Epcam (see Figure 7A-F). As reported previously12,15, while MEFs are predominantly positive for Thy-1.2 and negative for the other markers, Day 3 cultures already look markedly different. A large proportion of cells have started to down-regulate the expression of Thy-1.2 and a very small subset of these Thy-1.2 negative cells have become positive for Ssea-1, the actual reprogramming intermediate for this time point. The number of reprogramming intermediates that can be extracted from Day 3 cultures is very unpredictable as the percentage of Ssea-1+/Thy-1.2- usually lies in a range between 1-10% of viable cells. On Days 6 and 9 an increased percentage of Ssea-1+ cells, usually well above 10%, can be detected. Around day 12 a subset of Ssea-1 positive cells can be detected that also label positive for Epcam. Day 12 cultures, like Day 3 cultures, represents a bottleneck in the purification of intermediates, as the percentage of Ssea-1.2+/Epcam+ cells is variable and usually falls in the range of only 2-4% of all live cells. The expected number of reprogramming intermediates presented in Table 1 only serves as a rough approximation. Established bona fide iPS cell cultures will be strongly positive for Ssea-1 and Epcam.
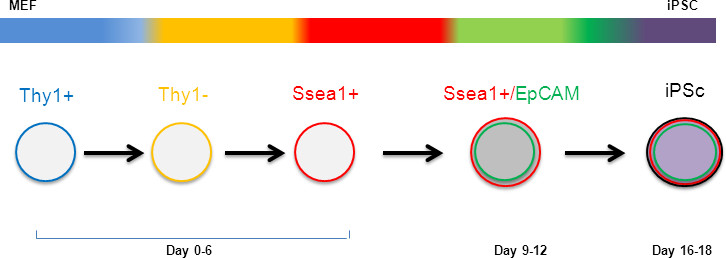
Figure 1. Surface marker changes during the reprogramming pathway: Down-regulation of fibroblast identity marker Thy-1.2 is followed by up-regulation of Ssea-1. The transition of a subset of Ssea-1 positive cells towards a pluripotent state is indicated by acquisition of Epcam around day 12. Please click here to view a larger version of this figure.
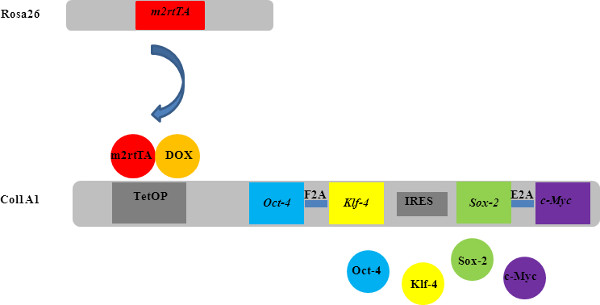
Figure 2. Schematic representation of the reprogrammable mouse model: m2rtTA expression is under control of the ubiquitously active Rosa26 locus. In the presence of doxycycline (dox) the m2rtTA protein binds to a tetracycline dependent promoter (tetOP) at the Collagen 1a1 (Col1a1) locus resulting in the expression of the four-factor cassette. Two bicistronic cassettes are linked by an internal ribosome entry site (IRES). Open reading frames for Oct-4/Klf-4 and Sox-2/c-Myc are fused by self-cleaving F2A and E2A sequences, respectively. Please click here to view a larger version of this figure.
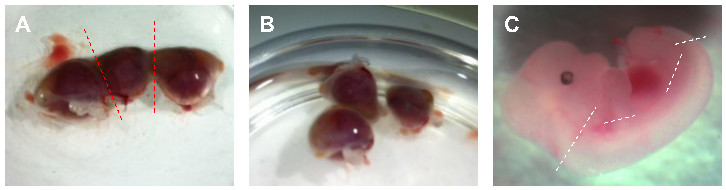
Figure 3. Embryo dissection: (A) Transfer uterine horn into a 10 cm dish filled with 10 ml PBS and (B) cut into pieces containing one embryo. (C) Using forceps free the embryos from extra embryonic tissue and remove head, limbs, tail and internal organs. Please click here to view a larger version of this figure.

Figure 4. Morphological changes during reprogramming. Colony-like patches become apparent in the cultures from day 6 onwards. Bona fide iPSCs are characterized by a domed shaped morphology. (A) Day 0/MEFs, (B) Day 3, (C) Day 6, (D) Day 9, (E) Day 12, (F) iPS cell culture. Scale bar: 200 µm. Please click here to view a larger version of this figure.
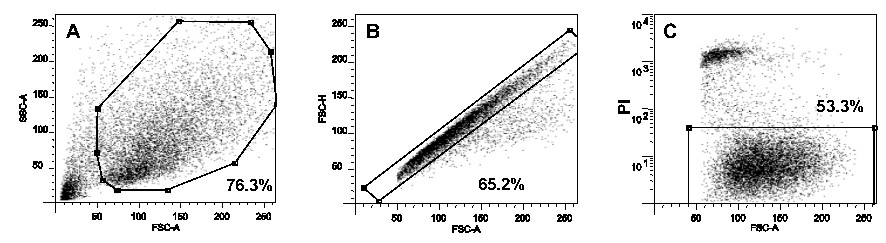
Figure 5. Basic FACS setup. (A) Exclude debris with Side Scatter versus Forward Scatter Area blot. (B) Exclude aggregates from non-debris by gating on single cell population with Forward Scatter Area versus Forward Scatter High blot. (C) Exclude dead cells from single cell population by gating on PI low events with PI channel versus Forward Scatter Area blot. Please click here to view a larger version of this figure.
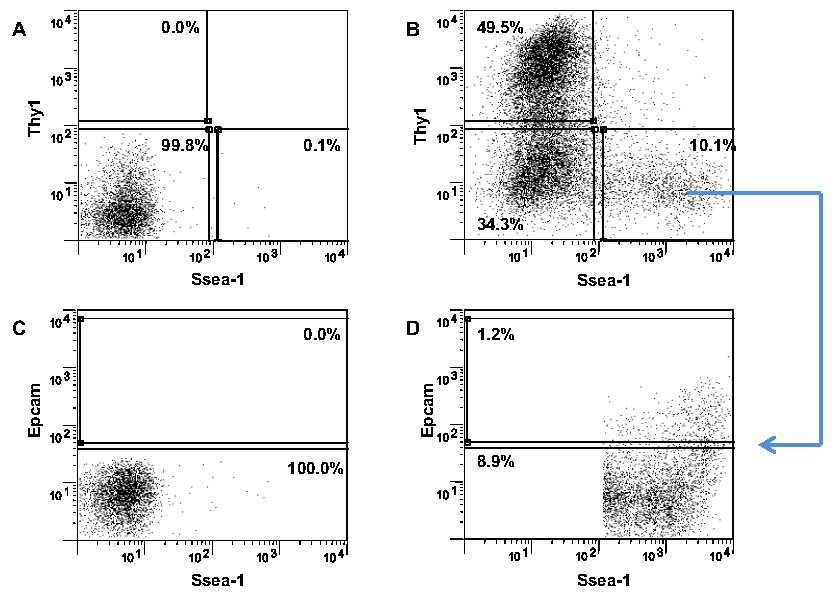
Figure 6. Gating. (A, B) Using the unlabeled control cells set up gates for Thy-1.2+/Ssea-1- cells, Thy-1.2-/Ssea-1- cells and Thy-1.2-/Ssea-1+ cells. (C) Use the unlabeled control cells to set gates for Epcam positive and Epcam negative cells. (D) Ssea-1+/Thy-1.2- cells can be separated into an Epcam positive and into an Epcam negative population. Please click here to view a larger version of this figure.
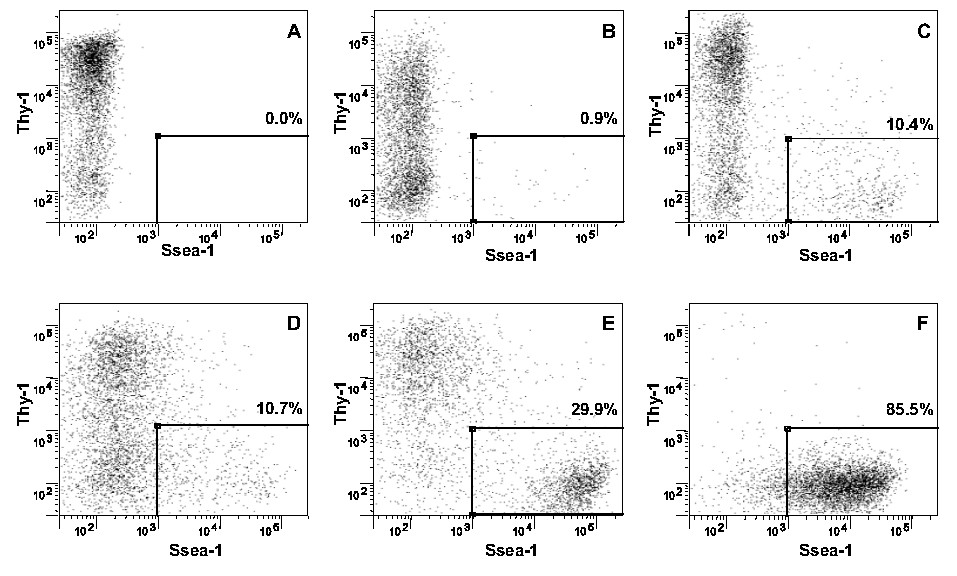
Figure 7. Thy-1.2 versus Ssea-1 FACS blots at various stages of the reprogramming process. (A) Day 0/MEFs, (B) Day 3, (C) Day 6, (D) Day 9, (E) Day 12, (F) iPS cell culture.
Table 1. Suggested seeding density, flask number and expected outcome for P1 MEFs of an embryo heterozygous for OKSM and m2rtTA. Please click here to view a larger version of this figure.
| Day | Number of T75 flasks seeded on day 0 | Total number of Ssea1+ cells after FACS | Total number of Ssea1+/Epcam+ cells after FACS |
| 3 | 8 | 2 million | |
| 6 | 4 | 2 million | |
| 9 | 4 | 2 million | |
| 12 | 10 | 10 million | 2 million |
Discussion
In order to successfully reprogram MEFs into iPS cells and to purify reprogramming intermediates at high quantity it is essential to be aware of factors that have an impact on the overall efficiency. In particular the batch of FBS used to supplement iPS media can have a detrimental effect. In general positive experiences were made with Embryonic stem (ES) cell qualified FBS but batch testing of sera from a variety of vendors might identify a cheaper alternative.
Another factor that impacts on reprogramming efficiency is the genotype of MEFs 15,20. Although MEFs derived from mice heterozygous (het) for both the OKSM and the m2rtTA locus do reprogram, homozygousity at one or both loci results in higher reprogramming efficiencies. Indeed, MEFs derived from the offspring of OKSM and m2rtTA crosses show an increase in reprogramming efficiency in the following order (OKSM/m2rtTA): het/het < homo/het < het/homo < homo/homo (please note that the numbers given in Table 1 are for het/het animals). On the rare occasion a male homo/homo animal is identified, a harem mating with multiple m2rtTA females can be set up. All offspring from these crosses will be het/homo for the OKSM/m2rtTA loci, respectively. In addition, the rapid genotyping of litters is recommended as larger litters are obtained when using younger mice for breeding (6-15 weeks of age).
Moreover, the use of low passage MEFs for reprogramming is emphasized 23. If MEFs were derived and expanded in a normoxic tissue culture incubator we strongly recommend to only use these cells up to passage 2. However, if the experimenter has access to a low oxygen incubator (5% oxygen) for the derivation and expansion of MEFs, passage numbers as high as 3 will still yield good results 23.
In case the experimenter encounters problems associated with reprogramming, as outlined, the most likely explanations are high passage numbers at the time of dox addition, incorrect genotype of the mice or the use of FBS that is not conducive for iPS cell generation. However, in rare cases we observed that MEFs were not able to reprogram even under ideal conditions. In these cases a spontaneous de novo deletion within the m2rtTA’s open reading frame was identified as the underlying reason.
This methodology was successfully adapted to extract Ssea-1+ intermediates via magnetic cell isolation (MACS). There is a clear time advantage in using MACS, however, the Ssea-1+ cell populations’ purity is reduced to 80-90%, rather than more than 95%, which depending on the type of experiment the cells are destined for might pose a problem. Thus, an option is to use MACS to enrich for Ssea-1+ cells followed by FACS to increase purity and/or fraction them into Ssea-1+/Epcam+ and Ssea-1+/Epcam- cells.
While the iPS cells produced by the outlined protocol and mouse model have been shown to be pluripotent and effectively contribute to all tissues of chimeric animals 15,20, a reduced capacity to produce embryos entirely composed of these iPS cells via tetraploid complementation has been demonstrated 24. Aberrant methylation patterns at the Dlk-Dio3 gene cluster have been identified as the underlying cause 24. However, addition of ascorbic acid at a concentration of 50 µg/ml to the media during reprogramming will produce tetraploid complementation competent iPS cells 24. Please be advised that an alternative reprogrammable mouse model engineered to express the reprogramming factors at a different stoichiometry can produce tetraploid competent iPS cells even in the absence of ascorbic acid treatment 25. However, in our hands cells from this strain reprogram at considerably lower frequency compared to the herein used mouse model.
The methodology described in this manuscript allows the separation of reprogramming intermediates from the refractory bulk of the population and should be seen as valuable tool to dissect and understand the reprogramming process, removing the previous limitations of having to use an unfractioned population for profiling (e.g., high signal noise from the refractory cells). The antibody combination described herein allows isolation of intermediates from mouse cells at high purity, however it is possible that additional cell surface markers will be uncovered in the future that will allow to obtain intermediates at even higher purity. Please note that Ssea-1 expression is not a hallmark of human induced pluripotent stem cells and as such this protocol cannot be used on reprogramming cells of human origin. In conclusion, reprogramming intermediates once isolated with the described method can be used for molecular analyses including expression profiling, chromatin immunoprecipitation, methylome analysis, and protein assays.
Disclosures
The authors have nothing to disclose.
Acknowledgements
We would like to acknowledge the financial support from the Monash Larkins Program as well as from a NHMRC CDF and a NHMRC project grant. Furthermore, we would like to thank Sue Mei Lim for her constructive suggestions, Edwina McGlinn for her support and the Monash Flowcore team (in particular Adam Dinsdale) for their help in producing the video.
Materials
| Name | Company | Catalog Number | Comments |
|---|---|---|---|
| Anti-mouse CD90.2 (Thy1.2) Pacific Blue | eBioscience | 48-0902-82 | |
| Anti-Human/Mouse SSEA-1 Biotin | eBioscience | 13-8813 | |
| Streptavidin PE-Cy 7 | eBioscience | 25-4317-82 | |
| Anti-Mouse CD326(Epcam) Fitc | eBioscience | 48-5791-82 | |
| Sodium pyruvate | Life Technologies | 11360-070 | |
| MEM Non-Essential Amino Acids (NEAA) | Life Technologies | 11140-050 | |
| Embryonic Stem Cell qualified Foetal Bovine Serum (FBS) | Life Technologies | 10439024 | |
| Trypsin-EDTA (0.25%) | Life Technologies | 25200-056 | |
| GlutaMAX | Life Technologies | 35050-070 | |
| β-Mercaptoethanol | Life Technologies | 21985-023 | |
| DMSO (Dimethyl Sulfoxide) | Sigma-Aldrich | D8418 | |
| Penicillin/streptomycin | Life Technologies | 15140 | |
| Propidium Iodide solution (PI) | Sigma-Aldrich | P4864-10ML | |
| Gelatine from porcine skin | Sigma-Aldrich | G1890 | |
| Doxycyclin hyclate | Sigma-Aldrich | 33429-100MG-R | |
| Leukemia Inhibitory Factor (LIF) | Millipore | ESG1107 | |
| DMEM High Glucose | Life Technologies | 11960-044 | |
| DPBS (Dulbecco's phosphate buffer saline) | Life Technologies | 14190-144 | |
| KnockOut DMEM | Life Technologies | 10829-018 | |
| Irradiated MEFs | Life Technologies | S1520-100 | |
| 75-cm2 Tissue culture flasks | Corning/BD Bioscience | 430641 | |
| 15-ml centrifuge tubes | Corning/BD Bioscience | 430791 | |
| 50-ml centrifuge tubes | Corning/BD Bioscience | 430829 | |
| Disposable surgical blades | Clifford Hallam | SM0501 | |
| Cryogenic vials | Corning/BD Bioscience | 430487 | |
| 70 µm Cell strainer | BD Bioscience | 352340 | |
| Taq DNA Polymerase | Life Technologies | 10342-020 |
References
- Matsui, Y., Zsebo, K., Hogan, B. L. Derivation of pluripotential embryonic stem cells from murine primordial germ cells in culture. Cell. 70, 841-847 (1992).
- Takahashi, K., Yamanaka, S. Induction of pluripotent stem cells from mouse embryonic and adult fibroblast cultures by defined factors. Cell. 126, 663-676 (2006).
- Stadtfeld, M., Maherali, N., Borkent, M., Hochedlinger, K. A reprogrammable mouse strain from gene-targeted embryonic stem cells. Nature Methods. 7, 53-55 (2010).
- Ebert, A. D., Svendsen, C. N. Human stem cells and drug screening: opportunities and challenges. Nature Reviews. Drug Discovery. 9, 367-372 (2010).
- Zhang, J., et al. A human iPSC model of Hutchinson Gilford Progeria reveals vascular smooth muscle and mesenchymal stem cell defects. Cell Stem Cell. 8, 31-45 (2011).
- Samavarchi-Tehrani, P., et al. Functional genomics reveals a BMP-driven mesenchymal-to-epithelial transition in the initiation of somatic cell reprogramming. Cell Stem Cell. 7, 64-77 (2010).
- Celià-Terrassa, T., et al. Epithelial-mesenchymal transition can suppress major attributes of human epithelial tumor-initiating cells. The Journal of Clinical Investigation. 122, 1849(2012).
- Liao, B., et al. MicroRNA cluster 302–367 enhances somatic cell reprogramming by accelerating a mesenchymal-to-epithelial transition. Journal of Biological Chemistry. 286, 17359-17364 (2011).
- Cieślik, M., et al. Epigenetic coordination of signaling pathways during the epithelial-mesenchymal transition. Epigenetic., & Chromatin. 6, 1-22 (2013).
- Golipour, A., et al. A late transition in somatic cell reprogramming requires regulators distinct from the pluripotency network. Cell Stem Cell. 11, 769-782 (2012).
- Maherali, N., et al. Directly reprogrammed fibroblasts show global epigenetic remodeling and widespread tissue contribution. Cell Stem Cell. 1, 55-70 (2007).
- Stadtfeld, M., Maherali, N., Breault, D. T., Hochedlinger, K. Defining molecular cornerstones during fibroblast to iPS cell reprogramming in mouse. Cell Stem Cell. 2, 230-240 (2008).
- Brambrink, T., et al. Sequential expression of pluripotency markers during direct reprogramming of mouse somatic cells. Cell Stem Cell. 2, 151-159 (2008).
- Wernig, M., et al. In vitro reprogramming of fibroblasts into a pluripotent ES-cell-like state. Nature. 448, 318-324 (2007).
- Polo, J. M., et al. A molecular roadmap of reprogramming somatic cells into iPS cells. Cell. 151, 1617-1632 (2012).
- Wright, A. J., Andrews, P. W. Surface marker antigens in the characterization of human embryonic stem cells. Stem Cell Research. 3, 3-11 (2009).
- O'Malley, J., et al. High-resolution analysis with novel cell-surface markers identifies routes to iPS cells. Nature. , (2013).
- Hansson, J., et al. Highly coordinated proteome dynamics during reprogramming of somatic cells to pluripotency. Cell Reports. 2, 1579-1592 (2012).
- Stadtfeld, M., Maherali, N., Breault, D. T., Hochedlinger, K. Defining molecular cornerstones during fibroblast to iPS cell reprogramming in mouse. Cell Stem Cell. 2, 230-240 (2008).
- Stadtfeld, M., Maherali, N., Borkent, M., Hochedlinger, K. A reprogrammable mouse strain from gene-targeted embryonic stem cells. Nature Methods. 7, 53-55 (2009).
- Sommer, C. A., et al. Induced pluripotent stem cell generation using a single lentiviral stem cell cassette. Stem Cells. 27, 543-549 (2009).
- Takahashi, K., Okita, K., Nakagawa, M., Yamanaka, S. Induction of pluripotent stem cells from fibroblast cultures. Nature Protocols. 2, 3081-3089 (2007).
- Utikal, J., et al. Immortalization eliminates a roadblock during cellular reprogramming into iPS cells. Nature. 460, 1145-1148 (2009).
- Stadtfeld, M., et al. Ascorbic acid prevents loss of Dlk1-Dio3 imprinting and facilitates generation of all-iPS cell mice from terminally differentiated B cells. Nature Genetics. 44, 398-405 (2012).
- Carey, B. W., et al. Reprogramming factor stoichiometry influences the epigenetic state and biological properties of induced pluripotent stem cells. Cell Stem Cell. 9, 588-598 (2011).
Reprints and Permissions
