Horizontal and vertical electrohydrodynamic liquid bridges are simple and powerful tools for exploring the interaction of high intensity electric fields and polar dielectric liquids. The construction of basic apparatus and operational examples, including thermographic images, for three liquids (e.g., water, DMSO, and glycerol) is presented.
Method Article
The Preparation of Electrohydrodynamic Bridges from Polar Dielectric Liquids
In This Article
Erratum Notice
Important: There has been an erratum issued for this article. View Erratum Notice
Summary
Abstract
Horizontal and vertical liquid bridges are simple and powerful tools for exploring the interaction of high intensity electric fields (8-20 kV/cm) and polar dielectric liquids. These bridges are unique from capillary bridges in that they exhibit extensibility beyond a few millimeters, have complex bi-directional mass transfer patterns, and emit non-Planck infrared radiation. A number of common solvents can form such bridges as well as low conductivity solutions and colloidal suspensions. The macroscopic behavior is governed by electrohydrodynamics and provides a means of studying fluid flow phenomena without the presence of rigid walls. Prior to the onset of a liquid bridge several important phenomena can be observed including advancing meniscus height (electrowetting), bulk fluid circulation (the Sumoto effect), and the ejection of charged droplets (electrospray). The interaction between surface, polarization, and displacement forces can be directly examined by varying applied voltage and bridge length. The electric field, assisted by gravity, stabilizes the liquid bridge against Rayleigh-Plateau instabilities. Construction of basic apparatus for both vertical and horizontal orientation along with operational examples, including thermographic images, for three liquids (e.g., water, DMSO, and glycerol) is presented.
Introduction
The interaction between electric fields and liquid matter results in a number of forces evolving within the material bulk. In real liquid dielectric systems, the non-negligible field gradients and symmetry breaking geometries result in a number of seemingly peculiar effects. Hertz was one of the first to note the rotational motion in liquid-solid dielectric systems1. Quincke observed that the interfacial tension between two fluids was not only changed by the application of an external electric field but that this change resulted in the exertion of forces on the fluid body and could be used to induce rotational motion2. Armstrong discovered the floating water bridge in 18933 which remained an enigmatic party trick until recently when Fuchs and co-workers explored mass and charge transport mechanics4,5 and reopened serious scientific inquiry into the mechanisms by which these bridges form. Electric fields have the ability to lift liquids against the force of gravity as Pellat’s work on dielectric liquid rise between parallel plate electrodes shows6. This lifting action shows a frequency dependence and ultimately can be described via the Maxwell stress tensor7. This is important when considering the liquid level rise associated with electrohydrodynamic (EHD) liquid bridges which under AC conditions do show a frequency dependence8 similar to electrowetting on dielectric (EWOD) and dielectrophoretic (DEP) mass flow9. Furthermore, the application of high potential electric fields is important in controlling liquid jet break up and the interaction of the electric field with liquids is essential for understanding the industrially important process of electrospray atomization10,11.
An external electric field does not only influence the surface energy. Due to the action of polarization and shear stress, flow patterns can be established. One example is the circulation of liquids in the presence of inhomogeneous electric fields. Hereby electroconvective currents are established in the liquid bulk driven by shear stresses. Sumoto demonstrated that a fluid motor could be built using a glass rotor containing either a polar liquid or a metal rod immersed in a non-polar dielectric bath and placed within an inhomogeneous electric field12. Later analysis by Okano used a homogeneous field approximation13 to solve the rotation problem which could only qualitatively match the experimental results and required the dielectric liquids to respond as a singular mass. Other researchers on the subject missed the point entirely as they erroneously reported and explored the Sumoto effect as a liquid level rise14-16 in response to the electric field work pioneered by Pellat17. The importance of surface symmetry breaking for the process of localizing charge and generated shear stress18 is essential to grasp for research on liquid EHD bridges. Melcher’s treatise on continuum electromechanics19 provides a complete theoretical basis for treating bulk liquids and simplifies free surfaces within the isotropic homogeneous limit. The importance of surfaces is nonetheless clear even from the continuum standpoint as the loss of symmetry results in shear stress that can generate bulk movement. Taken in the general case of discrete mobile fluid volumes which can be polarized and are subject to the resulting reactive force upon approach to the surface, the electric field interaction can be substituted into both the Navier-Stokes20 and Bernoulli7,21,22 relations to describe the multitude of EHD flow phenomena including liquid bridges. Further study of liquid bridges can improve a number of EHD based technologies such as ink-jet printing23-25, micro-and nano-materials processing26-28, drug delivery29,30, biomedical applications31,32, and desalination33.
The methods described here provide access to the formation of EHD liquid bridges which are found in polar liquids whose molecules possess a permanent dipole moment. The imposed inhomogeneous electric field results in a partial polarization of the dipole population yielding a local change of dielectric permittivity thus further reinforcing field gradients18,34,35. This polarization gives rise to a displacement force which depending on the relative intensity of the applied field will generate a number of different liquid responses (see Figures 4-7) eventually resulting in the formation of a bridge. The liquid will also develop a Taylor flow22,36 along the electrode surfaces especially in cases where there is a sharp edge present on the electrodes. The possibility of charge injection at sharp edges also exists and is consistent with the formation of heterocharge layers which generate electroconvective currents in the liquid bulk22 thus linking the liquid bridge system with the Sumoto effect12. The governing EHD relationships for bridges are extensively covered elsewhere for water and other polar liquids22,36-38. These theoretical approaches suffer certain limitations which should be considered when approaching experimental data. The Maxwell stress tensor treatment36 is insensitive to field heterogeneities as well as non-uniformities in the liquid bridge. A pure EHD approach37 provides steady state definitions of the electrogravitational number and its relationship to the bridge aspect ratio; however, the flow dynamics and important transient phenomena (e.g., bridge creation) are not predicted. Three dimensionless numbers are useful when analyzing the bridge’s stability and are derived here as previously published by Marín & Lohse37. The electrocapillary number (CaE) is which is defined as the ratio between electrical and capillary forces:

where ε0 is the vacuum permittivity, εr the relative dielectric permittivity of the liquid, Et is the electric field across the bridge, γ is the surface tension, ds and dl are the vertical and horizontal projections of the diameter so as to yield the mean diameter Dm. The Bond number (Bo) describes the balance between gravity and capillary forces:
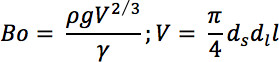
where g is the gravitational acceleration, l is the free bridge length, and V is the bridge volume. The relationship between gravitational, capillary, and electrical forces can be expressed in terms of the electrogravitational number GE:

The maximum extensibility of a bridge is related to the applied voltage while the current flowing through the bridge is related to the cross sectional area and thus the diameter. These relationships are coupled, determine the bridge volume, and thus define the region of stability for any given operating liquid bridge. The characteristic curves for a water bridge are given in Figure 3 which shows a lower threshold below which the applied field is too weak to overcome surface tension forces and an upper threshold above which the mass of the bridge is too great resulting in leaking which further disrupts the field and results in bridge rupture.
The more general treatment of liquid bridges in polar solvents19,22 provides the combined pressure terms operating with the bridge to predict the forces governing flow dynamics in the context of a modified Bernoulli equation with electric displacement terms added to the pressure term. In addition the Onsager relationship for ion stability24 is incorporated in agreement with experimental observations on equilibrium pumping direction and thermal emission.
A number of polar liquids have been explored including water, the lower aliphatic alcohols (e.g., methanol), poly-alcohols (e.g., glycerol), dimethylsulfoxide (DMSO), and other polar organics (e.g., dimethylformamide). Non-polar dielectric liquids (e.g., hexane) do not exhibit bridge formation. The dielectric liquids capable of supporting bridges thus far studied8,22,37 lie within a well-defined group of physical parameters that establish a good starting point for further experimentation: low conductivity (σ < 5 μS/cm), moderate static relative permittivity (ε = 20-80), moderate to high surface tension (γ = 21-72 mN/m). Interestingly a wide range of viscosities (η = 0.3-987 mPa·sec) work in such bridges. In liquids with sufficiently high viscosity such as glycerol it is possible to pull a bridge directly from the liquid bulk (see Figure 5) and is an important link between dielectrophoretic forces and liquid bridges. Ionic solutions (e.g., NaCl(aq)) are highly disruptive to bridge formation and in previous studies40 have been shown to increase the temperature of the bridge, decrease the length to applied voltage ratio, and to reduce extensibility. This behavior is largely attributed to the charge shielding effect of dissolved ions as well as increased current conduction which reduces the coupling between the fluid volume elements and the electric field.
On the continuum level EHD phenomena arise simply because the necessary pressure terms which accompany electrostriction are only found at the liquid interface21. Furthermore, there is a relationship between the stability of EHD liquid bridges and the stability of the interfaces in the system. In the case of reduced gravity experiments41 the expanding surface area results in a force which tears the bridge apart. Likewise if the surface is too confined or the subtending contact area small the bridge will likely develop instabilities. This can be illustrated in bridges which are fed by tubing or in the case of vertical bridges where one electrode is pulled upwards from the surface - the resulting bridges are less stable in long term operation as they lack the characteristic flow dynamics found in the situation where both reservoirs have a large free surface area. Bridges whose connections to the fluid reservoir are confined within tubing show increased thermal accumulation and falling surface tension. It is typical that an air interface will spontaneously form within the tubing. This condition limits both the maximum extensibility as well as the average lifetime of the bridge for confined liquid bridges. Open surface water bridges can be extended to 35 mm length at 35 kV whereas no bridge will persist at such an accelerating voltage in confinement as the liquid preferentially transitions into an electrospray mode. Likewise free surface water bridges have stability lifetimes approaching 10 hr under controlled conditions, whereas in tube fed systems the lifetime is typically less than 2 hr.
EHD phenomena are typically considered only at the continuum level. A limited number of studies on the molecular basis of liquid bridges have been conducted. A Raman study42 using vertical AC bridges investigated the inter-molecular OH-stretching band compared to bulk water. Some changes in the scattering profiles after application of the electric field are shown to have a structural origin. Using ultrafast mid-infrared pump probe spectroscopy on a floating water bridge43 the vibrational lifetime of the OH stretch vibration of HDO molecules contained in an HDO:D2O water bridge was found to be shorter (630 ± 50 fsec) than for HDO molecules in bulk HDO:D2O (740 ± 40 fsec), whereas in contrast, the thermalization dynamics following the vibrational relaxation are much slower (1,500 ± 400 fsec) than in bulk HDO:D2O (250 ± 90 fsec). These differences in energy relaxation dynamics strongly indicate that the water bridge and bulk water differ on a molecular scale. Furthermore, research on the infrared emission of a floating water bridge revealed a non-thermal feature which could be due to a transition from an excited state to the ground state of a proton conduction band44. Another more recent Raman study reported that in DC water bridges there is a radial distribution in the spectra which is indicative of relative difference in the local pH between the core and outer shell of the bridge45. The radial distribution of physical characteristics within EHD liquid bridges is further supported by inelastic UV scattering experiments46 which gives contradictory radial distributions in the temperature and density profiles and can be explained either by a gradient in molecular degrees of freedom or the presence of a secondary phase as nano bubbles. The later concept is not supported by a small angle X-ray scattering study47 while the concept of hindered rotation (i.e. librations) is supported from infrared emission spectra44. The preferential flow direction in EHD liquid bridges arises from changes in the auto-dissociation kinetics. In agreement with the work of Onsager this finding holds promise for connecting molecular and continuum level phenomena22. Further evidence for a molecular basis to EHD phenomena is found in the observation that thermal emission from a dielectric droplet decreases locally in response to the increasing electric field and reaches a minimum just prior to the onset of a bridge (see Figure 7).
EHD liquid bridges present an opportunity to examine the interplay between forces at multiple length scales and it is the specific aim of this work to provide a standardized method for producing these kinds of bridges in a number of liquids with any orientation relative to gravity that supports the emergence of the full set of characteristic phenomena discussed previously.
Protocol
1. General Recommendations
- Wear disposable, powder-free gloves throughout the set-up of the experiment to prevent contamination by sweat or oil from hands.
- Clean all glassware, electrodes and any other parts that contact the liquid under study, paying special attention to prevent the introduction of contaminants that can dissolve in the liquid phase.
- Using a conductivity meter, measure the electrical conductivity of the liquid that will be used in the experiment and confirm that it is ≤1 µS/cm.
2. Experimental Setup
- Horizontal bridge system (Figure 1a)
- Place a pair of adjustable height platforms on a level non-conducting surface. Fix one platform in place and mount the other platform on a motorized linear translation stage that has a minimum travel of 25 mm.
- Secure insulating plates (Figure 1a, part j) to the top surface of the adjustable platforms. Use insulating plates that are over-sized so that they overhang the platforms by at least 10 mm on all sides. Use common materials such as Teflon, acrylic, or window glass. Choose the thickness to prevent breakdown at the planned maximum voltage.
- Connect the high voltage power supply (Figure 1a, part m) according to manufacturer instructions.
- Solder alligator clips to the end of both the high voltage and ground wires.
- Clamp one end of a support arm constructed from rigid insulating material onto a ring stand with the insulating rod protruding horizontally over the insulating platforms.
- Mount the ground and high voltage wires to the support arms using either several wraps of electrical tape, nylon wire ties, or other appropriate means so the alligator clips protrude downwards above the insulated platforms.
- Clip one platinum electrode (Figure 1a, part k) into each of the two alligator clips.
- Position the support arms so that the high voltage wire is above the fixed platform and the ground wire is above the moving platform.
- Vertical bridge system (Figure 1b)
- Attach a non-conductive clamp to a linear translation stage so that the clamp can travel a minimum of 25 mm. Use this clamp to hold the vessel (Figure 1b, part i) which will be connected to the ground wire.
- Mount this assembly to a vertical rigid support structure.
- Attach a similar non-conductive clamp in line and below the support on the linear translation stage. Use this clamp to hold the vessel which will be connected to the high voltage wire.
- Make a “dead-stick” (See Figure 1c for illustration)
- Obtain a piece of non-conductive rigid material such as a glass or plastic rod 30-40 cm long (Figure 1c, part p).
- Attach a piece of conductive metal 10-15 cm long (Figure 1c, part q) to one end of the rod using several wraps of electrical tape (Figure 1c, part r) applied in a crisscrossed manner or other fixing material.
- Use the “dead-stick” to bridge the high voltage and ground electrodes with the metal end after the power supply is switched off to assure that the circuit is discharged prior to handling equipment.
3. Operation of Liquid Bridges
- Horizontal Liquid Bridges
- Fill each vessel (Figure 1a, part i) with enough liquid to bring the surface to within 1-5 mm of the beaker spout or rim. For the vessels (diameter 60 mm) used in this demonstration, use 67 g of liquid for water, 74 g for DMSO, or 84.4 g for glycerol.
- Place the 2 vessels onto the insulating platform such that they physically contact each other at a single location such as the spouts but the straight wall rim will also work.
- Adjust the platform heights so that the liquid will only contact the platinum electrode and not the alligator clip or wire. Pay attention to the vertical alignment so that the resulting bridge is horizontally level.
- Position the platinum electrodes into the liquid filled vessels so that they are a minimum of 15 mm from the contact position where the bridge will form. NOTE: Typically the electrodes are placed between the center of the vessel and the wall furthest from where the two vessels make contact.
- Vertical Liquid Bridges
- Use two clean, closed vessels with one liquid port as shown in Figure 1b, part i.
- Fill each vessel with the liquid under study so that there are no trapped air bubbles.
- Insert an electrode (Figure 1b, part k) into each vessel and close the cap to hold the liquid in place.
- Mount the two closed vessels into the non-conductive clamps (see 2.2) such that the openings point towards each other.
- Add a few drops of liquid to the opening of the lower tube so that a curved liquid surface protrudes a few millimeters above the glass rim.
- Bring the upper vessel down so that it just contacts the lower one forming a small capillary bridge.
- Connect the high voltage output of the power supply (Figure 1b, part m) to the lower vessel (stationary) electrode terminal and the ground to the upper (translating) vessel.
- High Voltage Operations
- General Considerations
- Before proceeding further confirm that all surfaces are dry and that no liquid pools, films, or droplets are present on the insulating platforms.
- Prior to applying power to the experiment confirm that there are no short circuits and that there are no ground paths present which can result in personnel or equipment coming into contact with energized surfaces. Be certain to follow all procedures and observe warnings issued by the high voltage power supply manufacturer. When in doubt seek advice from qualified electrical safety personnel.
- Set the polarity of the power supply (if selectable) prior to applying power. Typically, use positive voltage polarity as this provides more stable bridges. NOTE: Negative polarity can also be used but tends to yield pronounced space charge effects which can significantly affect the physical properties of both the dielectric liquid48 and affects the local charge density in the experimental area due to the functional difference in sinking rather than sourcing electrons under high potentials as excess charge can be sprayed onto surrounding insulating support structures.
- Open the current limit on the power supply so as to provide no more than 5-6 mA of current.
- Choose one of the two voltage profiles that can be applied — ramp or step.
- Use a voltage ramp when first starting and the performance characteristics of the liquid are not yet known.
- Turn down the voltage limit on the power supply to provide 0 kV.
- Enable the output on the power supply and slowly begin to increase the voltage limit at a rate of approximately 250 V/sec.
- Observe the voltage at which bridge ignition occurs, this is the approximate ignition threshold voltage (Vt).
- Use a voltage step to quickly apply voltage to the system.
- Set the power supply voltage limit to the desired value above the ignition threshold which was determined by using a voltage ramp for the liquid system under study (see 3.3.2.1.3).
- Enable the output on the power supply. NOTE: A voltage step can result in arcing and the ejection of droplets and may require several seconds before a stable bridge forms. Arcing will produce ozone and peroxide resulting in increased liquid conductivity if allowed to persist for more than a few seconds. It is recommended to replace the liquid with fresh material if arcing is a problem.
- Use a voltage ramp when first starting and the performance characteristics of the liquid are not yet known.
- Stabilize the bridge following ignition.
- Confirm bridge ignition by observing a steady stream of liquid between the two vessels. NOTE: This will occur typically between 8-10 kV and will be accompanied by current conduction between 250-500 µA depending on the liquid used.
- Tune the bridge for extension by increasing the voltage to 10-15 kV with current consumption ~ 1,000 µA. NOTE: the actual value will depend on the liquid used.
- Extend the bridge to a distance of approximately 1 mm per 1 kV applied voltage, e.g. 15 mm for 15 kV. If necessary, tune the bridge further depending on the requirements of the experiment. NOTE: A stable bridge can exist for many hours.
- General Considerations
- Shutdown Procedures
- Extinguish the bridge by disabling the output on the high voltage power supply. Wait several seconds for the power supply capacitors to discharge and the voltage readout to fall to zero.
- Use the “dead-stick” constructed in section 1.3 to short the electrode holders prior to handling any previously energized parts.
4. Imaging
- Fringe Projection
- Prepare a binary fringe plate by printing black stripes onto transparent film and affix this to an opalescent diffuser screen. For this example, use an A4 (i.e. 297 mm x 210 mm) fringe plate.
- Place the fringe plate in front of a backlight so that the fringes are projected onto the entire experimental set-up.
- Record either still images or movies of the fringe pattern using any number of digital cameras.
- Track changes in the liquid surface as well as changes in the optical path length of the subtending liquid by analyzing the images recorded in 4.1.3. NOTE: Quantitative analysis of the observed changes is performed via fringe evaluation using various software packages such as the freely available IDEA program49. The specific details and considerations of fringe analysis are covered elsewhere49-51.
- Thermographic Imaging
- Set the dynamic range of the thermographic camera as per the manufacturer’s instructions. NOTE: Typically a two point calibration which encompasses the expected temperature range is sufficient to provide good thermal resolution. Most liquid bridges operate in the temperature range from 20-50 °C.
- Perform an emissivity correction and temperature calibration by imaging the open surface of a volume of the liquid under study at temperatures appropriate for the experiment.
- Fill a vessel identical to that used in the experimental set-up with the liquid under study at room temperature.
- Measure the temperature of the liquid using an immersion thermoprobe such as a type-K thermocouple.
- Record an image of the liquid in the infrared.
- Raise the temperature of the liquid to temperatures expected in the bridge using a hot plate or microwave. NOTE: This is typically no more than 10 °C below the boiling point of the liquid (e.g., 90 °C for water).
- Repeat steps 4.2.2.2 and 4.2.2.3 for the elevated temperature liquid.
- Position the camera slightly above a horizontal bridge and level with a vertical bridge so as to maximize the recorded surface area. NOTE: due to the strong absorption of mid- and long- wave infrared radiation by most polar liquids, only the surface temperature distribution will be visible.
- Record infrared of the bridge system beginning prior to enabling the outputs on the power supply and continuing until the experiment is concluded or the camera buffer is full.
Results
Electrohydrodynamic liquid bridges are distinct from capillary liquid bridges by three properties: 1) flow, 2) extensibility, 3) thermal emission; a comparison is shown in Figure 2. Prior to application of voltage small capillary bridges are often observable between the two vessels when the liquid level is even with the spouts in the horizontal configuration. They are unavoidable in the vertical configuration when the separation distance is less than a few millimeters.
Voltage can be applied either in a ramp (see 3.4.2.1 in protocol) or step (see 3.4.2.2 in protocol). Voltages below the threshold value (Vt) will not produce an EHD bridge but can trigger several other phenomena such as liquid volume expansion (Figure 4), upward movement of the liquid electrode contact line (Figure 5), rotation and circulation of the liquid bulk (Figure 6), electrospraying and jet formation (Figure 7). Vt is a property of the dielectric liquid under investigation, the concentration and type of constituents present, as well as the shielding atmosphere used. The threshold for ignition is also a function of vessel separation. While bridge ignition is possible with separations of many millimeters the applied voltage must be higher and a longer quiescent period can be observed with more violent electrospraying before a stable liquid connection is formed. For example, with water filled reservoirs separated by 5 mm, Vt increases to 17-20 kV or higher.
Once Vt has been exceeded a combination of arcing and spraying marks ignition (Figures 8a, 9a) followed immediately by the formation of a thin bridge <1 mm in diameter. Once the bridge is established current will flow followed by swelling of the bridge (Figures 8b, 9b) to 3-5 mm diameter depending on the conditions. In many of the liquids studied thus far the time from bridge ignition to swelling is between 10-500 msec and is largely a function of the applied voltage, separation distance, and liquid viscosity8,22,37.
In horizontal bridges flow direction is dependent on the specific liquid conditions. Typically the net flow runs from the anode towards the cathode when the high voltage polarity is positive. Upon extension (Figure 8c) the diameter will fluctuate typically at low frequencies between 1-10 Hz. Higher frequency oscillations also occur and are visible as surface waves. Optically active density waves are visible in the bridge body when back illuminated with a binary fringe pattern. The specific response function of the system is dependent on both the liquid system as well as the power supply characteristics.
Vertical bridges are similar in many respects to horizontal ones; however, these do not show evidence of strong mass flow and typically have an exaggerated amphora-like shape. Increasing the driving voltage results in a more cylindrical column of liquid and extensibility (Figure 9c) is a little better than in horizontal bridges (e.g., 1.25 mm/kV for water). Like horizontal bridges vertical bridges can form without direct contact between the fluid bodies prior to voltage. In this case a Taylor cone is observed to form on the upper pendulous droplet. This spray will extend downwards forming a stable jet that quickly swells upon contact with the lower sessile droplet.
Unlike electrosprays, EHD bridges in polar dielectric liquids dissipate energy in the form of both thermal as well as non-thermal infrared (IR) radiation44. Thermographic recording of liquid bridges (Figures 7-10) is a useful tool for examining surface flow dynamics as well as for quantifying the in operando IR active distribution of energy. Thermal emission is due in large part to Ohmic heating and is thus a sensitive measure of ion stability as different liquids tend to heat differently given the same power dissipation. For example water bridges (Figure 9c) typically operate between 35-50 °C, and alcohol bridges run a few degrees cooler on account of both lower vapor pressure as well as differences in ion stability39. Another illustration of this linked behavior is found in aprotic DMSO which has low vapor pressure and forms negative ions which migrate in the opposite direction to most other polar liquids. DMSO bridges tend to operate at temperatures near 100 °C (Figure 10a). Viscosity and heat capacity also play a significant role in how thermal energy is dissipated in the system as can be seen by the localized heating found in glycerol bridges (Figure 10b).
Bridge breakup can occur through a number of pathways. It will likely happen when the bridge is either extended too far for the operating voltage or when the applied voltage is lowered below the value necessary to maintain a bridge at a given length as predicted by the electrogravitational number. The breakup will usually proceed through the reduction of the diameter (Figures 8d, 9d) until a critical value is reached and Plateau–Rayleigh instabilities disrupt the ligand-like bridge (Figures 8e, 9e) into a string of droplets which will migrate in the electric field. Another mode of bridge disruption, typically only found in the horizontal configuration, occurs when the bridge diameter becomes too large resulting in high mass and a downward jet of water. This behavior can lead to oscillations of the bridge producing a “swinging” effect which may cause the bridge to again destabilize into droplets. Large diameter bridges can occur as a result of excess hydrostatic head pressure in one vessel due to unidirectional flow which results in an overflow condition; alternatively increasing the voltage to high values with only small separation will produce a very wide bridge or “water highway”. These large diameter bridges can also fail by collapsing into one large droplet which falls downwards under gravity.
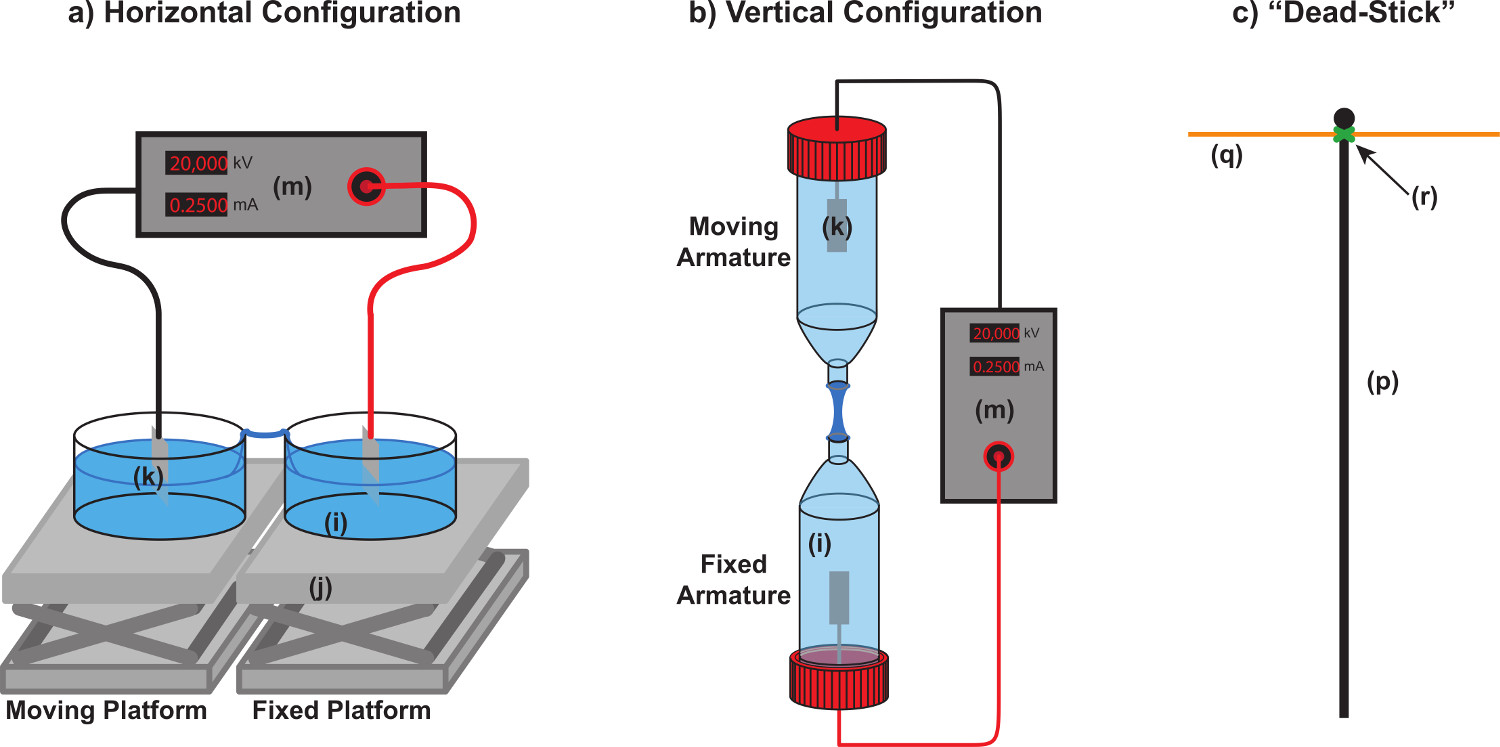
Figure 1. Basic equipment for EHD liquid bridge experiments. Schematic representation of typical horizontal (a) and vertical (b) experimental system for the creation of EHD liquid bridges. Some mechanical details such as mounting straps and electrode supports are omitted for clarity. The essential components are liquid vessels (i), insulating platforms or mounts (j), electrodes (k), and a high voltage power supply (m). Linear translation stages are recommended for the safe separation of the two vessels once a bridge is established. The dead stick shown in panel (c) is assembled from a piece of non-conductive rigid material (p), a conductive metal rod (q), and several wraps of electrical tape applied in a crisscrossed manner or other fixing material (r). The metal end is used to form a short between the two electrodes after the conclusion of the experiments to assure that the circuit is discharged prior to handling equipment. Please click here to view a larger version of this figure.
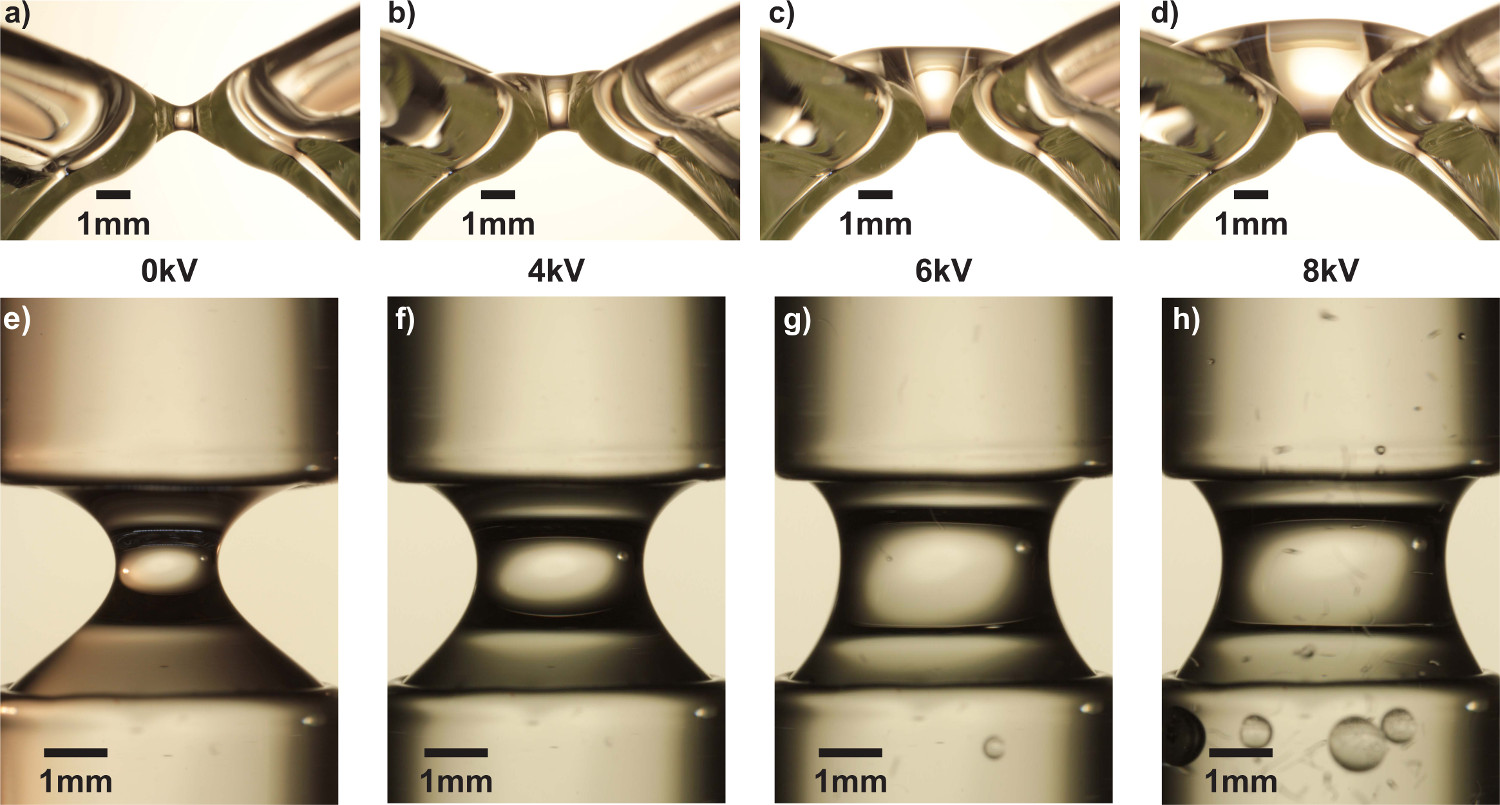
Figure 2. Comparison of capillary and EHD water bridges. A horizontal capillary bridge can only span a small gap of 1.5 mm (a) whereas, horizontal EHD bridges at three different voltages 4 kV (b), 6 kV (c), 8 kV (d) easily pass the gap. Note that EHD bridges flow over the spouts whereas a capillary bridge is suspended between the spouts. Likewise the vertical capillary bridge (e) has a narrower waist (~1.5 mm dia.) and can only be extended ~3.3 mm unlike vertical EHD bridges which are extensible. Three EHD bridges driven at 4 kV (f), 6 kV (g), and 8 kV (h) at the same separation distance as the capillary bridge are shown. Higher voltage increases bridge waist diameter, flow velocity and increased heating as a result of increased power dissipation in the bridge. An increase in bubble formation is also observed at higher voltages as gas solubility decreases with increasing temperature. The scale bar in all frames is 1 mm. Please click here to view a larger version of this figure.

Figure 3. Characteristic curves for a liquid water bridge. The current-voltage relationship for liquid water bridges at 0, 5, 10, 15 mm separation distance is plotted. A lower threshold below which no liquid bridge will form (see inset photo at lower left), and an upper threshold above which bridges are unstable (inset photos 1-4) bound the region of stability. For most bridges with some measureable extension (i.e. ≥ 5 mm) the total power dissipation lies between 10 and 20 watts. The rupture of a bridge beyond the upper threshold will often follow a sequence of events progressing from normal operation (inset 1), to leaking (inset 2), sagging (inset 3), and finally rupture (inset 4). Please click here to view a larger version of this figure.
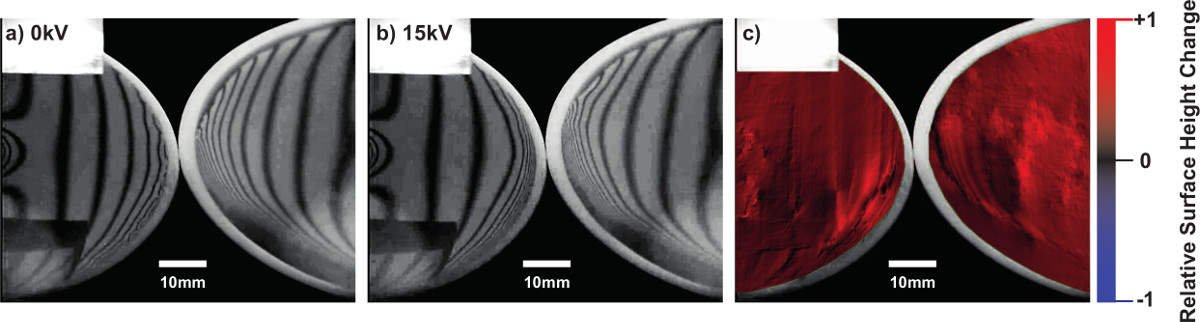
Figure 4. Volume expansion. The entire liquid surface of two vessels can be seen to rise in response to the applied electric field with the aid of a projected binary fringe pattern. Two Teflon beakers filled with water are imaged with a projected fringe pattern at two different applied voltages a) 0 kV and b)15 kV. The change in the projected fringe (panel c) is analyzed using IDEA33 software which uses a filtered Fourier transform to convert changes in the fringe modulation frequency to a relative height rise. The non-uniformity of the detected shift is due to the low spatial frequency of the projected fringe and artifacts due to the discrete cosine transform based phase unwrapping method. Please click here to view a larger version of this figure.

Figure 5. Dielectrophoresis and Electrowetting. The electromechanical response of glycerol to high potential electric fields. Two platinum electrodes immersed in anhydrous glycerol at 0 kV (a), and 19 kV (b) show how the liquid is strongly driven upwards. In a modification of Pellat’s experiment the lifted volume is completely removed from the subtending reservoir yielding an EHD glycerol bridge held between the two electrodes (c). Likewise, in the case of rod shaped electrodes (d) the contact line advances up the electrode with application of 15 kV (e) raising the electrodes pulls the liquid body upwards to form conical frustum (f) showing the enhanced wetting generated by the strong fields. Scale bars are 5 mm. Stills taken from supplemental videos S1 (a-c) and S2 (d-f). Please click here to view a larger version of this figure.
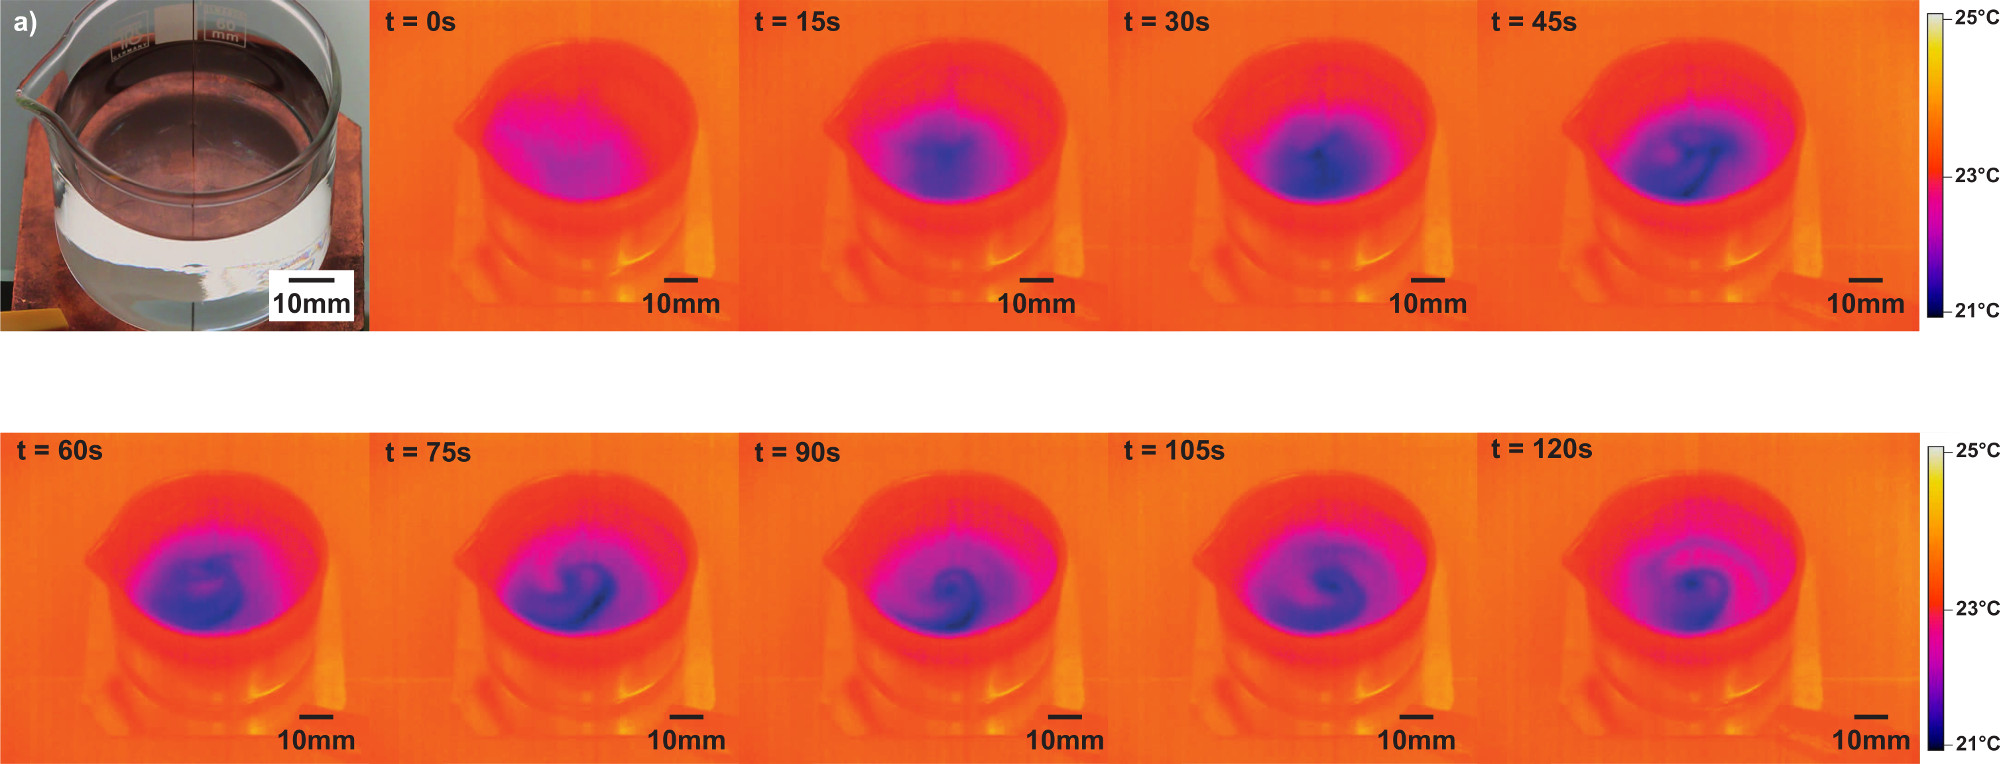
Figure 6. Sumoto effect visualized in the infrared. Infrared image sequence of a single vessel of glycerol in an inhomogeneous electric field provided using a simple point plane electrode system shown in visible light in panel (a). Power (19 kV DC) is applied at t = 0 sec. Local surface cooling occurs beneath the point electrode (t = 15 sec) This local cooling spreads across the surface and develops heterogeneities, the generation of a rotational force while immediate is initially small and requires approximately 75 sec to become visible on the surface. Time between frames is 15 sec. Scale bar is 10 mm. Stills from supplemental video S3. Please click here to view a larger version of this figure.

Figure 7. Pre-ignition cooling in a vertical bridge system with 10 mm separation distance. The upper Taylor cone and lower sessile drop of a vertical water bridge set-up are shown in close-up during a voltage ramp. The images are in the long-wave infrared and represent the surface emission. From the images there is a steady cooling and elongation (a-d) of both liquid surfaces as the applied voltage is increased both reaching a minimum temperature of 1-2 °C below initial (a) just prior to the ejection of a jet (e) from the upper Taylor cone. The lower droplet recoils in advance of the charged jet but rapidly joins following contact (e-f), the emission quickly rises as a stable EHD liquid bridge is established (g). Temperature reduction was confirmed using a fiber optic thermo-probe. The lower sessile droplet is ~2 °C warmer than the upper cone due to operation previously; typically the high voltage vessel will achieve a slightly higher temperature. Stills from supplemental videos S4 (top cone) and S5 (bottom droplet). Please click here to view a larger version of this figure.

Figure 8. Thermographic images of a horizontal water bridge from ignition to extinction. Representative series of composite mid-wave (3.7-5.0 µm) and long-wave (8.0-9.4 µm) infrared images characterizing the operational stages for horizontal liquid bridges shown for water: (a) ignition, (b) expansion, (c) extension, (d) stabilization, (e) breakup. In this image sequence the bridge was extinguished by removing power to the system. Stills from supplemental video S6. Please click here to view a larger version of this figure.

Figure 9. Thermographic images of a vertical water bridge from ignition to extinction. Representative series of long-wave infrared (7.5-9.0 µm) images characterizing the operational stages for vertical liquid bridges shown for water: (a) ignition, (b) expansion, (c) reduced voltage, (d) ligand formation, (e) breakup into droplets under the influence of rayleigh-plateau instabilities. Elapsed time is shown in msec. The background contrast was adjusted in the last frames to enhance droplet visualization. Stills from supplemental video S7. Please click here to view a larger version of this figure.

Figure 10. Thermographic images of horizontal bridges in DMSO and glycerol. Dimethylsulfoxide (DMSO) (a), and glycerol (b) bridge emission in a composite of mid-wave (3.7-5.0 µm) and long-wave infrared (8.0-9.4 µm). Stills from supplemental videos S8 (DMSO) and S9 (glycerol). Please click here to view a larger version of this figure.
Discussion
The successful formation of stable and robust EHD liquid bridges requires attention to be paid to certain simple yet important details. It is essential that the ionic conductivity of the solutions be as low as practical (e.g., 1-5 µS/cm). Be aware that water contamination can result in increased conductivity for certain polar liquids (e.g., glycerol). Wash all glassware well paying attention to careful rinsing, use only glassware free from surface contamination or arc induced burn marks. In general it is good practice to wear gloves whenever handling any equipment to prevent skin oils and salts from contaminating the experiment. Electrodes should be sonicated for several minutes in the solvent under study and it is recommended that these are “burned-in” by running an unextended bridge for 30-45 min at high current values (e.g., 3-5 mA) to reduce secondary electrode reactions. High purity (e.g., >99.9%) noble metals work best as electrode materials and should have sufficient surface area so as to maintain low current densities on the order of 10 A/m² so as to reduce local heating.
In the case of bridges that have poor stability or are difficult to start it is recommended to first confirm conductivity is ~1 µS/cm and that there are no extraneous pools of liquid that can allow an alternate current pathway. In general it is recommended that all surfaces be as dry as possible, pay special attention to thin films which can form between vessels and insulating plates. If arcing occurs interrupt power and reduce voltage value then reapply power as sustained arcing will result in the “carbonization” of affected areas which can reduce bridge stability or prevent bridge ignition all together. If power is applied to the system above the threshold voltage and no bridge forms an insulated glass rod can be used to draw the liquid upwards towards the contact points (e.g. beaker spouts) between the two vessels. If the system continues to behave in an unstable fashion clean the equipment and start again with fresh liquid. Failing this, it is recommended to take inventory of the surroundings as large metal objects, materials that support static charge, or strong air currents can disrupt the bridge and/or the electric field which supports it.
The experimental system is easily modified to fit materials commonly available in most laboratories. Liquid containers can be from nearly any compatible material and special attention should be paid to the flammability of the container or liquid phase in case of electrical arc; for example Teflon will generate hazardous gases when burned. Electrode shape, placement, and material can also be changed to suit the constraints of a given set-up. Typically planar electrodes made from foil are used but wire can also be used as long as the current density guidelines are taken into consideration. The applied electric field can be pure DC, pure AC, or DC biased AC. All will produce liquid bridges within the frequency dependent response range for liquids described in the literature on electrowetting on dielectric (EWOD) and dielectrophoresis (DEP)9 which define a response frequency range between 20 Hz and up to 20 kHz for moderate voltages. Higher frequency ranges may also generate bridges although these have not been explicitly tested and some workers have reported the lower limit for AC vertical bridges to be 50 Hz42. Orientation to gravity is also easily modified as long as a system can be devised to provide free liquid surfaces that are stable without an applied electric field. Experiments have been conducted in the absence of gravity41 which showed that these bridges have a dependence on the stabilizing influence of gravity which maintains the delicate balance of forces in a liquid bridge.
EHD liquid bridges are a new tool that can be added to the repertoire of many natural science applications. They permit the exploration of the interaction of bulk and surface forces with externally applied electric fields. They open the opportunity to examine new means of mixing different liquids37; changing chemical reaction kinetics52; proton transport44,45; and examining the response of biological systems to such conditions53. In addition these bridges allow direct access to the liquid surface without any physically subtending structures which has already yielded new spectroscopic information on the dynamics in liquid water28 and hints not only at the existence of an electrically controlled state switch whereby new bulk properties emerge31 but at the potential to examine liquid-liquid phase transitions54 through an entirely new method. The widespread industrial application of EHD processes (e.g., electrospinning26, and electrospray32,33 methods) most certainly can benefit from the further study of these closely allied phenomena.
Disclosures
The authors Dr. Mónica López Sáenz and Dr. Oliver Schreer are employees of IRCAM GmbH that produces instruments used in this Article. The remaining authors declare that they have no competing financial interests.
Acknowledgements
This work was performed in the TTIW-cooperation framework of Wetsus, centre of excellence for sustainable water technology (www.wetsus.nl). Wetsus is funded by the Dutch Ministry of Economic Affairs, the European Union Regional Development Fund, the Province of Fryslân, the City of Leeuwarden and the EZ/Kompas program of the ‘Samenwerkingsverband Noord-Nederland”. The authors like to thank the participants of the research theme “Applied Water Physics” for the fruitful discussions and their financial support.
Materials
| Name | Company | Catalog Number | Comments |
|---|---|---|---|
| Borosilicate Crystallization Dishes | VWR | 216-0064 | |
| Double walled roundbottom flask with GL14 and GL8 openings along with 6 mm spherical joint port | LGS | SP757102a | Custom glassware with minimum two openings one for electrode, one for bridge spout. |
| Adjustable Platforms | Rudolf Grauer AG | Swiss Boy 115 | |
| Motion Translation Stage | Thorlabs | MTS25/M-Z8E | Complete motorized stage, controller, and power supply |
| Insulating Plates | Should be appropriate for resisting the intended voltages without breakdown | ||
| Pt Electrodes | Alfa-Aesar | 000261 | Wash and then sonicate in 18.2 MΩ water prior to use |
| HVPS | FUG GmbH | HCP 350-65000 | 65 kV DC at 5 mA maximum output |
| Fiber Optic Temperature Probe System | OpSens | OTG-F Sensor/ XXX-XXX Control Unit | Readout speed 1 kHz, accuracy 0.01 K, probe size 120 μm |
| Long Wave Infrared Camera | IRCAM GmBH | Taurus 110K L | 168 FPS 384 x 288 Sensitivity < 30 mK |
| Long Wave Infrared Camera | FLIR | FLIR 620 | 30 FPS 640 x 480 pixel Sensitivity to < 45 mK |
| Dual Band Mid- and Long-Wave Infrared Camera | IRCAM GmBH | Geminis 110k ML | |
| Digital Camera | Canon | 550D | Used for both video and still frames |
| Tripod | Manfrotto | 475B/405 | |
| 18.2 MΩ Water | Milli-Q | Advantage | Allow 24 hr to equilibrate after dispensing into clear borosilicate bottles |
| Methanol dehydrated with less than 0.0050% water AnalaR NORMAPUR | VWR-BDH | 20856.296 | Keep dry until needed |
| Glycerol anhydrous for synthesis | VWR - Merck Millipore | 8.18709.1000 | Keep dry until needed |
| Dimethylsulfoxide, ACS Grade | VWR-BDH | BDH1115-1LP | Keep dry until needed |
References
- Hertz, H. R. Ueber die Vertheilung der Electricitat auf der Oberflache bewegter. Leiter Wied Ann. 13, 266-275 Forthcoming.
- Quincke, G. Electrische Untersuchungen. 255, 3rd Ser, Ann Phys Chem. Leipzig. 705-782 (1883).
- Armstrong, L. W. Electrical phenomena. The Electrical Engineer. 10, 154-155 (1893).
- Fuchs, E. C., Woisetschläger, J., Gatterer, K., Maier, E., Pecnik, R., Holler, G., Eisenkölbl, H. The floating water bridge. J Phys-D-Appl Phys. 40, 6112-6114 (2007).
- Fuchs, E. C., Gatterer, K., Holler, G., Woisetschläger, J. Dynamics of the floating water bridge. J Phys-D-Appl Phys. 41, 185502-185507 (2008).
- Pellat, M. H. Mesure de la force agissant sur les diélectriques liquides non électrisés placés dans un champ élitrique. C R Acad Sci Paris. 123, 691-696 Forthcoming.
- Jones, T. B. An electromechanical interpretation of electrowetting. J Micromech Microeng. 15, 1184-1187 (2005).
- Saija, F., et al. Communication an extended model of liquid bridging. J Chem Phys. 133, 081104(2010).
- Wang, K. L., Jones, T. B. Frequency Dependent Electromechanics of Aqueous Liquids Electrowetting and Dielectrophoresis. Langmuir. 20, 2813-2818 (2004).
- Collins, R. T., Jones, J. J., Harris, M. T., Basaran, O. A. Electrohydrodynamic tip streaming and emission of charged drops from liquid cones. Nat Phys. 4, 149-154 (2008).
- Cloupeau, M., Foch, B. P. Electrohydrodynamic Spraying Functioning Modes A Critical Review. Journal of Aerosol Science. 25 (6), 1021-1036 (1994).
- Sumoto, I. An interesting phenomenon observed on some dielectrics. J Phys Soc Jpn. 10 (6), 494(1955).
- Okano, K. On the rotatory motion of dielectrics in static electric field. J J App Phys. 4 (4), 292-296 (1965).
- Pickard, W. F. Experimental Investigation of the Sumoto Effect. J Appl Phys. 32, 1888-1893 (1961).
- Pickard, W. F. Electrical Force Effects in Dielectric Liquids. Prog Dielectrics. 6, 1-39 (1965).
- Mirza, J. S. Sumoto effect under transient conditions. Jpn J Appl Phys. 19, 1297-1300 (1980).
- Pellat, M. H. Force agissant á la surface de séparation de deux diélectriques. CR Seances Acad Sci (Paris). 119, 675-678 (1894).
- Melcher, J. R., Taylor, G. I. Electrohydrodynamics A Review of the role of interfacial shear stresses. Annu Rev Fluid Mech. 1, 111-146 (1969).
- Melcher, J. R. Continuum Electromechanics. , MIT Press. Cambridge, MA. (1981).
- Druzgalski, C. L., Andersen, M. B., Mani, A. A Direct numerical simulation of electroconvective instability and hydrodynamic chaos near an ion-selective surface. Phys Fluids. 25, 110804(2013).
- Melcher, J. R. A tutorial on induced electrohydrodynamic forces. , MIT. Cambridge, MA. (1968).
- Woisetschläger, J., Wexler, A. D., Holler, G., Eisenhut, M., Gatterer, K., Fuchs, E. C. Horizontal bridges in polar dielectric liquids. Exp Fluids. 52, 193-205 (2012).
- Galliker, J., Schneider, H., Eghlidi, S., Kress, V. S. andoghdar, Poulikakos, D. Direct printing of nanostructures by electrostatic autofocussing of ink nanodroplets. Nature Communications. 3, (2012).
- Fuller, S. B., Wilhelm, E. J., Jacobson, J. M. Ink jet printed nanoparticle microelectromechanical systems. J Microelectromech Syst. 11, 54-60 (2002).
- Sutanto, E., Shigeta, K., Kim, Y. K., Graf, P. G., Hoelzle, D. J., Barton, K. L., Alleyne, A. G., Ferreira, P. M., Rogers, J. A. A multimaterial electrohydrodynamic jet (E-jet) printing system. J Micromech Microeng. 22, 045008(2012).
- Tao, W. E., Inai, R., Ramakrishna, S. Technological advances in electrospinning of nanofibers. Sci Technol Adv Mater. 12, 013002(2011).
- Kim, J. H., Oh, H. C., Kim, S. S. Electrohydrodynamic Drop-on-Demand Patterning in Pulsed Cone-Jet Mode at Various Frequencies. J of Aero Sci. 39, 819-825 (2008).
- Chung, H. J., Xie, X. N., Sow, C. H., Bettiol, A. A., Wee, A. T. S. Polymeric conical structure formation by probe-induced electrohydrodynamical nanofluidic motion. Appl Phys Lett. 88, 023116(2006).
- Hwang, T. H., Kim, J. B., Yang, D. S., Park, Y. -I., Ryu, W. H. Targeted electrohydrodynamic printing for micro-reservoir drug delivery systems. J Micromech Microeng. 23, 035012(2013).
- Sill, T. J., von Recum, H. A. Electrospinning Applications in drug delivery and tissue engineering. Biomat. 29, 1989-2006 (2008).
- Zeng, J., Korsmeyera, T. Principles of droplet electrohydrodynamics for lab on a chip. Lab Chip. 4, 265-277 (2004).
- Enayati, M., Chang, M. W., Bragman, F., Edirisinghe, M., Stride, E. In Colloids and Surfaces A-physicochemical and Engineering Aspects. Electrohydrodynamic preparation of particles, capsules and bubbles for biomedical engineering applications. , Elsevier Science BV. 154-164 (2011).
- Agostinho, L. L. F., Brouwer, S., Yurteri, C. U., Fuchs, E. C., Marijnissen, J. C. M. Insulated multinozzle system for electrohydrodynamic atomization in the simple-jet mode. Appl Phys Lett. 102, 194103(2013).
- Feynman, R. P. Feynman Lectures on Physics. Volume II Mainly Electromagnetism and Matter, California Institute of Technology Press. ISBN 0-201-02117-X-P (1964).
- Zhang, X., Zahn, M. K. err electro-optic field mapping study of the effect of charge injection on the impulse breakdown strength of transformer oil. Appl Phys Lett. 103, 162906(2013).
- Widom, A., Swain, J., Silverberg, J., Sivasubramanian, S., Srivastava, Y. N. Theory of the Maxwell pressure tensor and the tension in a water bridge. Phys Rev E. 80, 016301(2009).
- Marín, A. G., Lohse, D. Building water bridges in air; electrohydrodynamics of the floating water bridge. Phys Fluids. 22, 122104(2010).
- Morawetz, K. Theory of water and charged liquid bridges. Phys Rev E. 86 (2), 026302-026310 (2012).
- Onsager, L. Deviations from Ohm’s law in weak electrolytes. J Chem Phy. 2 (9), 599-615 (1934).
- Nishiumi, H., Honda, F. Effects of Electrolyte on Floating Water. Res Let Phys Chem. 2009, 371650(2009).
- Fuchs, E. C., Agostinho, L. L. F., Wexler, A., Wagterveld, R. M., Tuinstra, J., Woisetschläger, J. The behavior of a floating water bridge under reduced gravity conditions. J Phys D Appl Phys. 44, 025501-025508 (2011).
- Ponterio, R. C., Pochylski, M., Aliotta, F., Vasi, C., Fontanella, M. E., Saija, F. Raman scattering measurements on a floating water bridge. J Phys D Appl Phys. 43, 175405-175412 (2010).
- Piatkowski, L., Wexler, A. D., Fuchs, E. C., Schoenmakera, H., Bakker, H. J. Ultrafast vibrational energy relaxation of the water bridge. PCCP. 14, 6160-6164 (2012).
- Fuchs, E. C., Cherukupally, A., Paulitsch Fuchs, A. H., Agostinho, L. L. F., Wexler, A. D., Woisetschläger, J., Freund, F. T. Investigation of the Mid-Infrared Emission of a Floating Water Bridge. J Phys D Appl Phys. 45, 475401(2012).
- Oshurko, V. B., Ropyanoi, A. A., Fedorov, A. N., Fedosov, M. V., Shelaeva, N. A. Spectrum of OH stretching vibrations of water in a “floating” water bridge. J Tech Phys. 57 (11), 1589-1592 (2012).
- Fuchs, E. C., Bitschnau, B., Di Fonzo, S., Gessini, A., Woisetschläger, J., Bencivenga, F. Inelastic UV Scattering in a Floating Water Bridge. J Phys Sc Appl. 1, 135-147 (2011).
- Skinner, L. B., Benmore, C. J., Shyam, B., Weber, J. K. R., Parise, J. B. Structure of the floating water bridge and water in an electric field. PNAS. 109, (2012).
- Kaneko, K. Effect of space charge on the breakdown strength under polarity reversal. Elec Eng Jap. 106, 3(1986).
- Hipp, M., Woisetschläger, J., Reiterer, P., Neger, T. Digital evaluation of interferograms. Measurement. 36, 53-66 (2004).
- Kreis, T. Handbook of Holographic Interferometry Optical and Digital Methods. , Wiley VCH. 554(2004).
- Eisenhut, M., Guo, X., Paulitsch Fuchs, A. H., Fuchs, E. C. Aqueous Phenol and Ethylene Glycol Solutions in Electrohydrodynamic Liquid Bridging. Cent Eur J Chem. 9 (3), 391-403 (2011).
- Paulitsch Fuchs, A. H., et al. Prokaryotic transport in electrohydrodynamic structures. Phys Biol. 9, 026006-026016 (2012).
- Stanley, H. E., et al. Advances in Solid State. Liquid Polyamorphism and the Anomalous Behavior of Water. Haug, R. 48, 249-266 (2009).
Reprints and Permissions
Erratum
Formal Correction: Erratum: The Preparation of Electrohydrodynamic Bridges from Polar Dielectric Liquids
Posted by JoVE Editors on 1/01/1970. Citeable Link.
An erratum was issued for The Preparation of Electrohydrodynamic Bridges from Polar Dielectric Liquids. Figure 3 was updated because it had an incorrect representation of the power used in an operating bridge.
Figure 3 has been updated from:

Figure 3. Characteristic curves for a liquid water bridge. The current-voltage relationship for liquid water bridges at 0, 5, 10, 15 mm separation distance is plotted. A lower threshold below which no liquid bridge will form (see inset photo at lower left), and an upper threshold above which bridges are unstable (inset photos 1-4) bound the region of stability. For most bridges with some measureable extension (i.e. ≥ 5 mm) the total power dissipation lies between 10 and 20 watts. The rupture of a bridge beyond the upper threshold will often follow a sequence of events progressing from normal operation (inset 1), to leaking (inset 2), sagging (inset 3), and finally rupture (inset 4).
to:
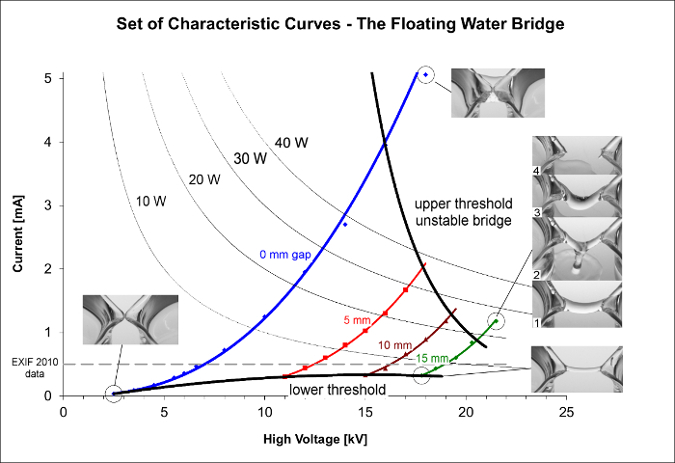
Figure 3. Characteristic curves for a liquid water bridge. The current-voltage relationship for liquid water bridges at 0, 5, 10, 15 mm separation distance is plotted. A lower threshold below which no liquid bridge will form (see inset photo at lower left), and an upper threshold above which bridges are unstable (inset photos 1-4) bound the region of stability. Power dissipation is a tunable parameter where longer bridges have a more narrow tuning range than shorter bridges. The rupture of a bridge beyond the upper threshold will often follow a sequence of events progressing from normal operation (inset 1), to leaking (inset 2), sagging (inset 3), and finally rupture (inset 4).
