Methods for mapping in vivo protein-DNA interactions are becoming crucial for every aspect of genomic research but they are laborious, costly, and time consuming. Here a commercially available robotic liquid handling system that automates chromatin immunoprecipitation for mapping in vivo protein-DNA interactions with limited amounts of cells is presented.
Method Article
Automating ChIP-seq Experiments to Generate Epigenetic Profiles on 10,000 HeLa Cells
In This Article
Summary
Abstract
Chromatin immunoprecipitation followed by next generation sequencing (ChIP-seq) is a technique of choice for studying protein-DNA interactions. ChIP-seq has been used for mapping protein-DNA interactions and allocating histones modifications. The procedure is tedious and time consuming, and one of the major limitations is the requirement for high amounts of starting material, usually millions of cells. Automation of chromatin immunoprecipitation assays is possible when the procedure is based on the use of magnetic beads. Successful automated protocols of chromatin immunoprecipitation and library preparation have been specifically designed on a commercially available robotic liquid handling system dedicated mainly to automate epigenetic assays. First, validation of automated ChIP-seq assays using antibodies directed against various histone modifications was shown, followed by optimization of the automated protocols to perform chromatin immunoprecipitation and library preparation starting with low cell numbers. The goal of these experiments is to provide a valuable tool for future epigenetic analysis of specific cell types, sub-populations, and biopsy samples.
Introduction
As Next-Generation Sequencing (NGS) technologies have become widespread and more accessible, the primary method for genome-wide mapping of protein-DNA interactions is now chromatin immunoprecipitation followed by NGS detection (ChIP-seq), which enables the discovery of transcription factor binding sites or patterns of histone modifications. ChIP-seq is advantageous in providing high-throughput data of the whole genome that can be used for quantitative and qualitative analysis of the protein-DNA interactions by the measurement of the enriched DNA fragments. However, there are some disadvantages in standard ChIP-seq experiments such as the difficulty in obtaining enough material to create a sequencing library.
ChIP experiments are divided into six basic steps including 1) crosslinking protein-DNA binding regions 2) sample preparation which includes cell lysis and shearing the chromatin by sonication, 3) formation of the immunocomplexes, 4) precipitation of the immunocomplexes, 5) washing of the immunocomplexes, and 6) elution of the enriched material and analysis by qPCR and NGS.
The success of a ChIP assay is dependent on three main factors: a good chromatin preparation, the amount of antigen in the original sample, and the specificity and affinity of the antibody for its cognate antigen. A major limitation is the requirement for high amounts of starting cell numbers in order to obtain enough enriched DNA to create a sequencing library. For scientists who work with limited sample amounts, such as biopsy samples or cell sub-populations, ChIP-seq experiments are very challenging. Recent studies have shown that ChIP-seq assays can be performed when working with a low amount of cells1, 2. Diagenode has developed a robotic liquid handling system that can fully automate ChIP-seq experiments when starting with a limited number of cells.
Automation provides many advantages over manual preparation of ChIP-seq samples as it diminishes human error, reduces variability, and reduces experimental cost. Semi-automated protocols for chromatin immunoprecipitation and library preparation have been reported but none of these studies has shown data when using low cell numbers3, 4, 5, 6.
In this paper a complete automated workflow is described for both chromatin immunoprecipitation and library preparation assays in a robotic liquid-handling system that uses magnetic bead-based technology and that can address multiple parameters in the protocol optimization. Here, automated ChIP-seq experiments were successfully performed on a limited number of cells with the goal of simplifying, standardizing, and providing a reliable solution to study epigenetic profiles in small cell populations. The automated ChIP protocol described in this paper has been optimized on HeLa cells using specific histone antibodies and reagents but the workflow can be adapted to other cell lines and antibodies with corresponding experimental optimization.
Protocol
1. Standard ChIP Experiments
- Cell collection and DNA-protein crosslinking.
- Grow HeLa-S3 cells to a confluence of 80%-90%. Remove culture medium, wash the dish twice with 10 ml of 1x phosphate buffered saline (PBS), and add Trypsin-EDTA (1x) to the cultured plate. Incubate for a maximum of 2 min to detach the cells from the dish. Collect cells and wash twice with 10 ml PBS.
NOTE: Longer incubation times will lead to cell damage. - Centrifuge the cells for 5 min at 500 x g and resuspend the cells in 20 ml of PBS. Proceed to count the cells.
- Centrifuge the cells for 5 min at 500 x g, discard the supernatant and add 500 μl of PBS. The optimal number of cells for the fixation step is 10 million cells per 500 μl of PBS.
- Add 13.5 μl of fresh 37% formaldehyde into each aliquot of 500 μl of cell suspension. Fixate the cells for 8 min at RT.
- Add 57 μl of 1.25 M glycine solution to stop the fixation. Incubate for 5 min at RT with constant mixing by gentle vortex. Work on ice from this point onwards.
- Centrifuge the cells at 500 x g for 5 min at 4 °C and discard the supernatant without disturbing the cell pellet.
- Wash the cells twice with 1 ml PBS. Discard gently the supernatant and keep the cell pellet on ice.
- Grow HeLa-S3 cells to a confluence of 80%-90%. Remove culture medium, wash the dish twice with 10 ml of 1x phosphate buffered saline (PBS), and add Trypsin-EDTA (1x) to the cultured plate. Incubate for a maximum of 2 min to detach the cells from the dish. Collect cells and wash twice with 10 ml PBS.
- Cell lysis and chromatin shearing
- Add 10 ml of ice cold lysis buffer iL1 to the cell pellet (1 ml of lysis buffer per 1 million cells is the optimal ratio). Pipette up and down several times and incubate for 10 min at 4 °C with gentle mixing.
- Centrifuge the lysate for 5 min at 500 x g and 4 °C. Discard the supernatant.
- Add 10 ml of ice cold lysis buffer iL2 to the lysates and mix gently by pipetting up and down. Incubate the lysates for 10 min at 4 °C.
- Centrifuge for 5 min at 500 x g and 4 °C and discard the supernatant.
- Prepare the complete shearing buffer adding the 200x protease inhibitor cocktail (PIC) to the iS1 shearing buffer. Keep the buffer on ice for 5 min and work on ice afterwards. Add 1 ml of the complete iS1 shearing buffer to each 10 million cells pellet and gently mix by pipetting up and down. Prior to sonication incubate the samples on ice for 10 min to reduce viscosity of the sample.
- Shear 300 µl aliquots of chromatin by sonication using a water bath sonicator for 2 to 3 sets of 10 cycles each. A cycle consists of 30 sec “ON” and 30 sec “OFF” on a high power setting. Alternatively, use a pico-sonication device with a shorter sonication time of 5 to 10 cycles of 30 sec “ON”, 30 sec “OFF”. Briefly vortex and spin the tubes between the runs. When using other types of sonicators, follow corresponding manufacturer’s instructions for chromatin shearing.
- Centrifuge the sheared chromatin at 16,000 x g for 10 min and collect the supernatant to be used immediately in the IP step. Alternatively, store the chromatin at -80 °C for up to 2 months for future use.
- Analyze the chromatin shearing efficiency prior to immunoprecipitation step using 1-1.5% TAE agarose gels or bionalyzer. Optimal chromatin fragment sizes range between 100-600 bp.
2. Low Cell ChIP Experiments
- Cell collection and DNA-protein crosslinking
- Grow HeLa-S3 cells to a confluence of 80%-90%. Remove culture medium, wash the dish twice with 10 ml of 1x phosphate buffered saline (PBS), and add 1x Trypsin-EDTA to the cultured plate. Incubate for a maximum of 2 min to detach the cells from the dish.
NOTE: Longer incubation times will lead to cell damage. - Collect cells by adding 1 ml culture medium containing serum into a 1 ml centrifugation tube. Count the cells.
- Centrifuge the cells for 5 min at 500 x g. Bring the cell number to 10,000 cells per ml of culture medium for the fixation.
- Add 27 μl of 36.5% fresh prepared formaldehyde into each tube for the fixation. Invert the tube two or three times and incubate 10 min at RT.
- Add 115 μl of 1.25 M glycine solution to the sample, invert the tube two or three times and incubate 5 min at RT. Work on ice from this point onwards.
- Centrifuge the cells at 300 x g for 10 min at 4 °C. Discard the supernatant slowly.
- Wash cells with 1 ml ice cold HBSS with PIC (200x, final concentration 1x). Invert the tube two or three times to resuspend the cells and centrifuge at 300 x g for 10 min at 4 °C. Discard gently the supernatant and keep the cell pellet on ice.
- Grow HeLa-S3 cells to a confluence of 80%-90%. Remove culture medium, wash the dish twice with 10 ml of 1x phosphate buffered saline (PBS), and add 1x Trypsin-EDTA to the cultured plate. Incubate for a maximum of 2 min to detach the cells from the dish.
- Cell lysis and chromatin shearing
- Add 25 μl of complete Lysis Buffer tL1 (Lysis Buffer tL1 + PIC) per 10,000 cells and agitate manually the bottom of the tube to resuspend the cells. Incubate on ice for 5 min.
- Add 75 μl of complete HBSS (HBSS + PIC) buffer into each aliquot containing 10,000 cells.
- Shear 100 μl aliquots of 10,000 cells by sonication for 5 sets of 5 cycle each. A cycle consists of 30 sec “ON” and 30 sec “OFF” on the high power setting. Alternatively, use a pico-sonication device used with a shorter sonication time of 5 cycles of 30 sec “ON”, 30 sec “OFF”. Optimal chromatin fragment sizes range between 100-600 bp. Note that chromatin preparations, cell types and different sonicators require separate shearing optimization experiments.
- Centrifuge the sheared chromatin at 14,000 x g for 10 min to discard the insoluble material and collect the supernatant to be used immediately in the IP step. Alternatively, store the chromatin at -80 °C for up to 2 months for future use.
- Analyze the chromatin shearing efficiency prior to immunoprecipitation step using 1-1.5% TAE agarose gels or the bionalyzer. Treat samples with RNase prior to agarose gel analysis in order to improve the visual assessment of shearing. Optimal chromatin fragment sizes range between 100-600 bp.
3. Chromatin Immunoprecipitation and Library Prep
- For standard automated ChIP experiments
- Add 120 μl of ChIP Buffer H (ChIP Buffer H + PIC) to 100 μl sheared chromatin. Use 200 μl for the IP and keep 2 μl to 20 μl as input sample.
- Select the automated ChIP 200 μl protocol in the automation instrument. The throughput of the protocol is 1 to 16 samples per run.
- Run an automated ChIP experiment using, chromatin corresponding to 1-2 million cells, 1-2 μg of anti-H3K79me3, -H3K27me3, -H3K4me3, -H3K4me2, -H3K9ac, -H3K9/14ac, -H3K36me3 and H3K9me3 ChIP-seq grade rabbit polyclonal antibodies. Optimal antibody amounts vary depending on the histone modification and the affinity and specificity of the corresponding antibody.
- Use equal amounts of non-immune rabbit IgG as an isotype control antibody. Alternatively, use uncoated beads or specific blocked antibody as ChIP controls. Add 20 μl of Protein-A coated magnetic beads for each reaction.
- Use the automated histone ChIP-seq kit reagents to perform automated ChIP experiments with anti-H3K79me3 and -H3K4me2 polyclonal antibodies. Use the ideal ChIP-seq kit reagents to perform ChIP experiments with anti-H3K27me3, -H3K4me3, -H3K9ac, -H3K9/14ac, -H3K36me3 and -H3K9me3.
- Select the automated ChIP protocol following the software instructions implemented in the automation device. Set the ChIP experimental parameters to 4 hr for the antibody coating step and 15 hr for the immunoprecipitation step. The reverse crosslinking step takes place in the automated instrument at 65 °C for 4 hr.
- Purify the reverse cross-linked DNA on the automated system. Select automated protocols for DNA purification with a protocol or kit using magnetic bead based DNA purification. Elute the DNA in 25 μl of water.
- Quantify the immunoprecipitated DNA by extracting 10% of the immunoprecipitated DNA. The immunoprecipitated DNA yield depends on the quality of the chromatin and antibody, cell type and the target histone modification. Quantify the DNA using an assay kit according to manufacturer’s instructions.
- Analyze the quality of the immunoprecipitated DNA by quantitative PCR using primers for at least 1 positive and 1 negative control genomic regions. Do not use more than 10% of the total immunoprecipitated DNA for assessing ChIP enrichments.
- Prepare the qPCR reactions. Add 10 μl of a 2x SyberGreen qPCR master mix, 1 μl of primer mix, 1-5 μl of immunoprecipitated or input DNA and sterile water up to 20 µl final reaction volume. The qPCR program includes an initial denaturation step at 95 °C for 5-10 min depending on the provider of the Taq polymerase and the annealing temperatures should be set according to the primers selected.
- Use automated library prep protocols compatible with the commercially available Illumina ChIP-seq library preparation reagents to build the libraries using both ChIP DNA as well as the saved input DNA from the same chromatin preparation. Use 10-20 ng of immunoprecipitated DNA from each antibody for library preparation. Prepare up to 16 automated libraries per run.
- Sequence the libraries and generate clusters according to Illumina manufacturer’s instructions. Perform primary bioinformatics analysis (cluster filtering, base calling, etc.) following the standard Illumina pipeline, filter and align the reads to the latest human genome assembly (current version is GRCh38) with the ELAND aligner. Use SICER7 or MACS8 for peak calling and perform the downstream analyses of peaks with Homer9, BEDTools10 or preferred software.
- For low cell number automated ChIP experiments
- Add 120 μl of complete ChIP buffer tC1 (ChIP Buffer tC1 + PIC) to 100 μl sheared chromatin. Use 200 μl for the IP and keep 20 μl as input.
- Select automated ChIP 200 μl protocol in the automation system. The throughput of the protocol is 1 to 16 samples per run.
- Run an automated ChIP-seq experiment using automated ChIP reagents and ChIP grade antibodies optimized to work on low chromatin quantities. Use chromatin corresponding to 10,000 cells and 100,000 cells, 0.5 μg of anti-H3K27me3, 0.25 μg -H3K4me3, 0.1 μg -H3K27ac, 0.25 μg -H3K9me3 rabbit Premium ChIP-seq grade rabbit polyclonal antibodies. Optimal antibody amounts vary depending on the histone modification and the affinity and specificity of the corresponding antibody.
- Use equal amount of non-immune rabbit IgG as an isotype control antibody. Alternatively, use uncoated beads or specific blocked antibody as ChIP controls. Add 10 μl of Protein-A coated magnetic beads for each reaction.
- Select the automated ChIP protocol following the software instructions implemented in the automation device. Set the ChIP experimental parameters to 4 hr for the antibody coating step and 15 hr for the immunoprecipitation step. The reverse crosslinking step takes place in the automated instrument at 65 °C for 4 hr.
- Purify reverse cross-linked DNA using spin columns following manufacturer’s instructions and elute in volumes from 6 μl to 25 μl of water.
- Quantify the DNA using a commercial assay kit. Analyze the results by qPCR using primers for positive and negative control regions to evaluate the ChIP quality.
- Use a library preparation kit with optimized library preparation reagents to prepare libraries with low DNA quantities. Use 30 pg and 300 pg of ChIP DNA (corresponding to 10,000 and 100,000 cells experiments respectively) for library preparation. Prepare libraries using the automated protocol compatible with library preparation reagents. The automated library prep throughput is 1 to 48 libraries per run.
- Following the end repair of the double-stranded DNA templates, ligate the cleavable stem-loop adaptors containing the sequencing primer sites. Following the DNA extension step, amplify the sample with the high fidelity amplification method described in the library preparation kit protocol.
- After library amplification, quantify and purify the libraries following the library preparation kit guidelines. Note that size selection after purification is not necessary.
- Sequence the libraries and generate clusters according to the manufacturer’s instructions. Perform primary bioinformatics analysis (cluster filtering, base calling, etc.) following the standard manufacturer pipeline, filter, and align the reads to the latest human genome assembly (current version is GRCh38) with the ELAND7 aligner. Use SICER8 or MACS9 for peak calling and perform the downstream analyses of peaks with Homer, BEDTools10, or any preferred software.
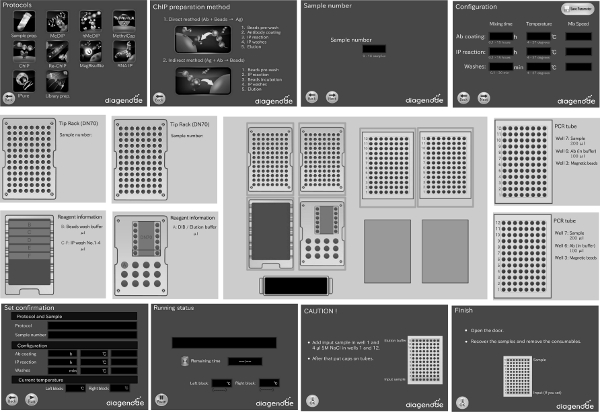
Figure 1. Screenshots of the software showing how to set up automated ChIP experiments in the IP-Star Compact. The software provides the flexibility to select the amount of samples per run as well as to change key experimental parameters (Antibody Coating, IP and washes) according to the researcher needs. The automated procedure allows testing different conditions in parallel (i.e., different types and amounts of antibodies, different types and amounts of cells and even different types and amounts of magnetic beads in the same run. Please click here to view a larger version of this figure.
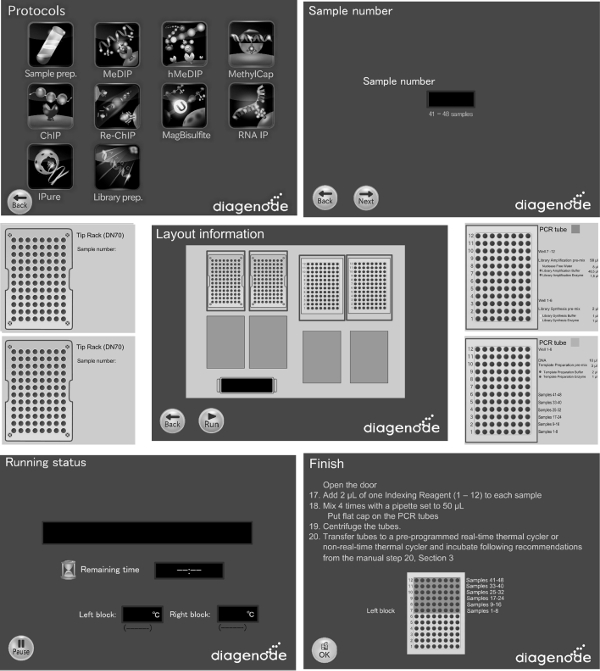
Figure 2. Screenshots of the software showing how to set up automated library preparation for next generation sequencing using the library kit in the automation system. Please click here to view a larger version of this figure.
Results
Optimizing automated ChIP-seq experiments for eight different histone markers
In order to successfully develop and validate the automated ChIP protocols, ChIP-seq grade antibodies that were previously validated in manual ChIP-Seq experiments (data not shown) were selected. The following ChIP-seq grade antibodies were chosen for this study: anti-H3K79me3, -H3K27me3, -H3K4me3, -H3K4me2, -H3K9ac, -H3K9/14ac, -H3K36me3 and -H3K9me3. The specificity of all ChIP-seq grade antibodies was previously confirmed by dot blot, peptide arrays and Western Blot experiments (data not shown). Pilot ChIP-qPCR experiments with increasing antibody amounts were performed to determine the sensitivity of the antibodies (Figure 3). qPCR with at least two positive and two negative control targets were analyzed and profiles with enrichments of positive over negative target higher than fivefold are qualified for sequencing experiments. It is important to perform ChIP and ChIP-seq experiments with a high quality of sheared chromatin. All ChIP experiments shown in this publication were performed using fresh chromatin. It is also possible to freeze the fixed cells at -80 °C and proceed with the chromatin preparation and shearing on a different day. However, chromatin prepared from frozen fixed cells may behave differently from chromatin freshly prepared and therefore sonication conditions may need to be optimized for each chromatin preparation. When working with different cell types, shearing buffers with different detergent compositions (SDS) can be used. Cell types such as primary cell lines or cell grown in suspension are difficult cells to shear and will require of high SDS concentrations (1%) whereas cell lines that are easy to shear such as HeLa will require low SDS concentrations (0.1%) in the shearing buffers.
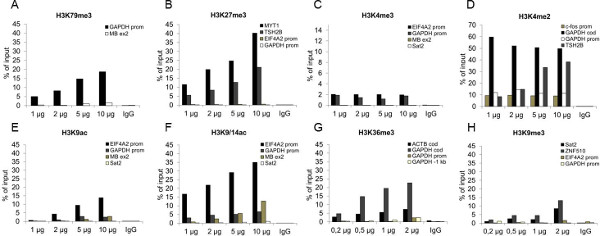
Figure 3. Validation of ChIP-grade antibodies using the automation system. ChIP was performed with anti-H3K79me3, -H3K27me3, -H3K4me3, -H3K4me2, -H3K9ac, H3K9/14ac, -H3K36me3 and -H3K9me3 rabbit polyclonal antibodies on sheared chromatin from 1 million HeLa-S3 cells depending on the histone modifications. Automated ChIP protocols with 200 µl working volumes were used in the automation instrument for antibody titration experiments. Antibody quantities of 1, 2, 5 and 10 μg were tested per ChIP experiment and 2 μg IgG were used as negative control in each experiment. Enrichments were assessed by qPCR. Results are shown as a % of input (the relative amount of immunoprecipitated DNA compared to input DNA after qPCR analysis). Please click here to view a larger version of this figure.
After validating and determining optimal amounts of ChIP-grade antibodies to be used in the automation system, automated ChIP-seq experiments were performed in order to generate sequencing profiles for each histone modification (Figure 4).
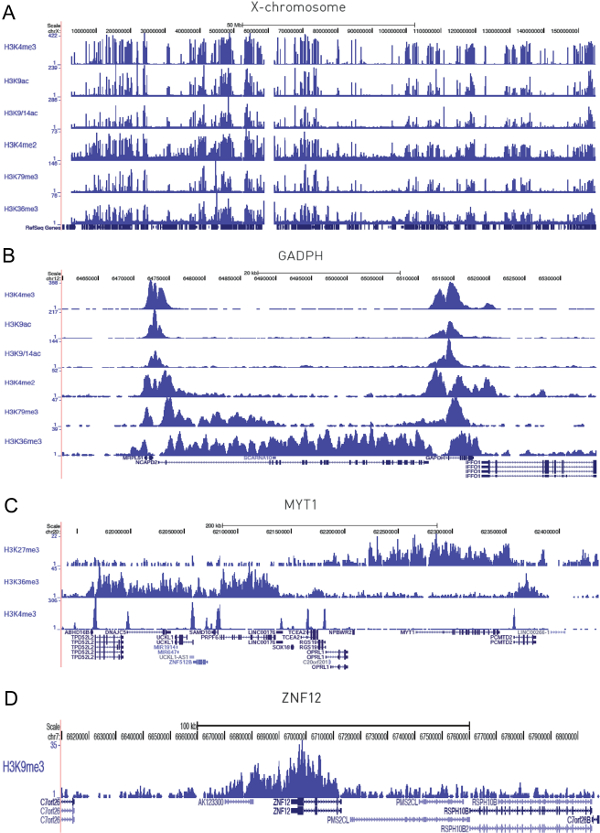
Figure 4. Histone ChIP-seq profiles generated by automated ChIP-seq experiments. The figure shows the ChIP-seq profiles in different genomic regions for H3K4me3, H3K9ac and H3K9/14acH3K4me2 H3K79me3, and H3K36me3. 4A shows the peak distribution along the complete X-chromosome and 4B the distribution in a 75 kb region surrounding the GAPDH gene. 4C shows the profiles of H3K27me3, H3K36me3 and H3K4me3 in a 500 kb region surrounding the MYT1 gene and 4D shows the distribution of H3K9me3 in a 200 kb region surrounding ZNF12. Please click here to view a larger version of this figure.
Histone epigenetic profiles for six different histone modifications associated with gene expression were generated (H3K4me3, H3K9ac, H3K9/14ac, H3K4me2, H3K79me3 and H3K36me3). Figure 4A shows ChIP-seq profiles along the chromosome X for the different histone markers. The highly peak correlation observed between the 6 different histone profiles indicates the capabilities of automated system to generate accurate and reliable data. Figure 4B, 4C and 4D show the distribution of peaks for different histone modifications at specific genomic regions.
Automated chromatin immunoprecipitation experiments down to 200 cells
The minimum amount of cells that can be used in ChIP experiments depends on the quality of the chromatin, the specificity and sensitivity of the antibody and the abundance of the histone modification or protein studied. Selecting good ChIP-seq grade antibodies is important when working with limited amounts of sample and the selection of optimal reagents and different carriers improves the efficiency of the DNA recovery and contribute to the success of the ChIP experiment. To determine the minimum amount of cells that the automated ChIP protocol can process, different quantities of chromatin, antibody, and magnetic beads were tested in the IP-Star automated system using ChIP reagents specifically optimized to work with low quantities of chromatin.
First, chromatin from 10,000 cells was sonicated as described in the protocol. The ChIP results were confirmed by qPCR (Figure 5A) which shows significant enrichments with H3K4me3 antibody in positive control regions and negligible signal in negative control regions. For comparison and proof of consistency, additional data obtained with H3K27ac, H3K9me3, and H3K27me3 antibodies, using 10,000 cells is provided.
Automated ChIP experiments were performed then to demonstrate the capabilities of the automated system to work with low quantities of cells using the same H3K4me3 antibody. The automated ChIP performed well, demonstrated by a series of ten IP reactions that were reproducible and highly comparable with the manual ChIP results (Figure 5B). Manual and automated experiments were performed and benefits of the automated protocols were seen in reducing experiment to experiment variability (Figure 5C).
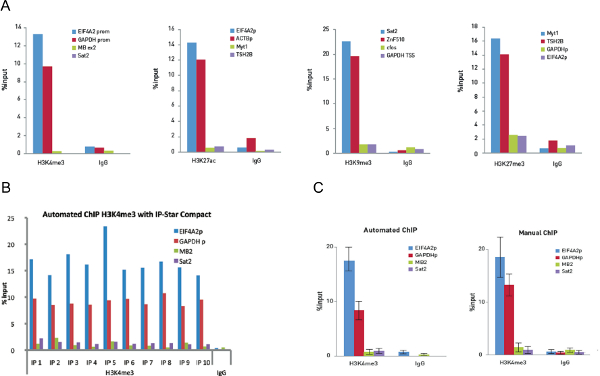
Figure 5. Optimization of ChIP and Auto ChIP experiments on 10,000 cells Manual ChIP experiments were performed on 10,000 cells and using 0.25 μg of H3K4me3, 0.1 μg of H3K27ac, 0.5 μg of H3K9me3 and 0.25 μg of H3K27me3 antibodies. Identical quantities of rabbit IgG were used as a control. The qPCR was performed with primers for two positive loci and two negative loci for each ChIP assay. Figure 5A shows the recovery, expressed as a percentage of input (the relative amount of immunoprecipitated DNA compared to input DNA after qPCR analysis). Figure 5B shows 10 ChIP reactions run on the IP-Star Compact using 0.25 μg H3K4me3 polyclonal antibody and 0.25 μg of rabbit IgG as negative control antibody. Then qPCR analysis was performed with primers for the positive loci EIF4A2 promoter and GAPDH TSS and the negative loci Myoglobin exon2 and Sat2. The figure shows the recovery, expressed as a percent of input (relative amount of immunoprecipitated DNA compared to input DNA after qPCR analysis). Figure 5C shows H3K4me3 ChIP data of 10 manual ChIP experiments in comparison to 10 automated ChIP experiments. Error bars represent standard deviations of each of the ten replicates. Please click here to view a larger version of this figure.
In order to understand the sensitivity of the automated ChIP protocols, experiments were performed using an amount of cells that ranged from 100,000 down to 200 cells per IP. The anti-H3K27me3 antibody was used as it is a very common histone modification. The use of other histone or non-histone antibodies may require more or less cells, depending on the abundance of the epitope and the quality of the antibody. The experiments were validated by quantitative PCR and it was observed that by reducing amounts of beads and antibody background in the experiments is reduced allowing successful ChIP-qPCR results with as little as 200 cells antibody (Figure 6).
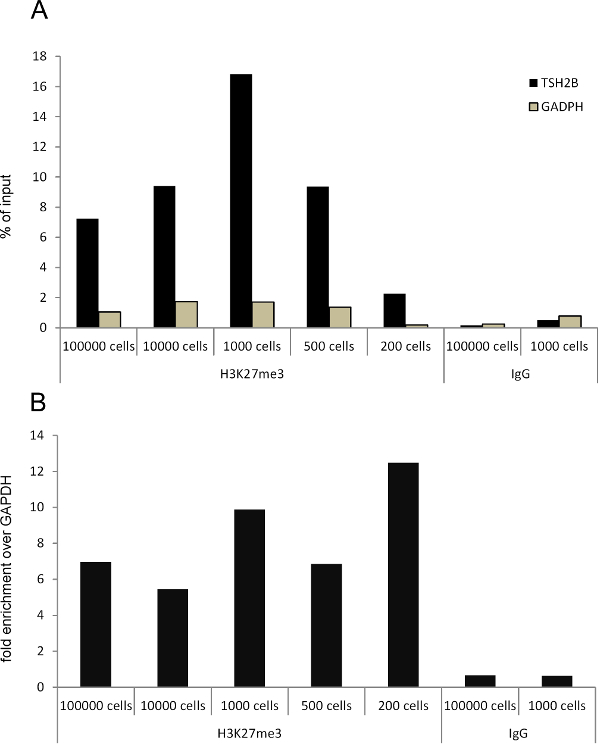
Figure 6. Automated ChIP assays on 200 cells. Hela-S3 cells and antibody directed against H3K27me3. Chromatin was sheared from 1 million cells and serial dilutions of this chromatin (from 100,000 to 200 cell equivalent) were used per ChIP reaction. 1 µg of H3K27me3 and 10 μl of protein A-coated magnetic beads were used on 100,000 cells experiment, 0.5 µg of H3K27me3 and 10 µl of beads on 10,000 and 1,000 cells, and 0.25 µg of H3K27me3 and 5 µl of beads with 500 and 200 cells. 1 µg and 0.5 of μg of rabbit IgG were used as negative control antibody when performing experiments with 100,000 cells and 1,000 cells respectively. 6A shows the occupancy of TSH2B and GAPDH genes in % over input. 6B shows relative occupancy of TSH2B versus negative GAPDH control genomic region.
Downstream analysis of ChIP-seq results on 10,000 cells
In order to assess the global quality of the automated ChIP-seq experiments with low starting numbers of cells, automated ChIP-seq assays were performed with 0.25 µg of the H3K4me3 antibody on 10,000 HeLa cells and ChIP experiments on 100,000 HeLa-S3 cells were used as positive control for the experiment. The automated libraries were prepared using the MicroPlex library preparation kit reagents adapted to prepared libraries with low DNA amounts. Note that even though it is possible to perform successful automated ChIP-experiments with less than 10,000 cells, the amounts of pulled down DNA will not be enough to prepare libraries using the kit reagents. Cluster generation and sequencing were performed according to the manufacturer’s instructions. The bioinformatics analyses after the sequencing show outstanding results from the low cell number ChIP samples. The 30 pg dataset (corresponding to 10,000 cells of starting material) contain low background noise and highly reliable enrichment peaks which are confirmed by both the 300 pg dataset (corresponding to 100,000 cells of starting material) and the H3K4me3 dataset generated by the Broad Institute for the ENCODE project which was used as an external reference. It is important to note the Top 40 overlap ratio data, which refers to a standard method used in the ENCODE11 project in which the ChIP-seq is considered reproducible if comparing two datasets there is at least an 80% overlap of the best 40% of the peaks ranked by significance score. The 30 pg dataset fulfills these criteria when compared to both the 300 pg dataset (considering all of its peaks, not just the best 40%) and the Broad Institute data (Table 1). The 300 pg dataset shows almost identical peaks to Broad Institute data with a 98% Top 40 overlap ratio (Figure 7).
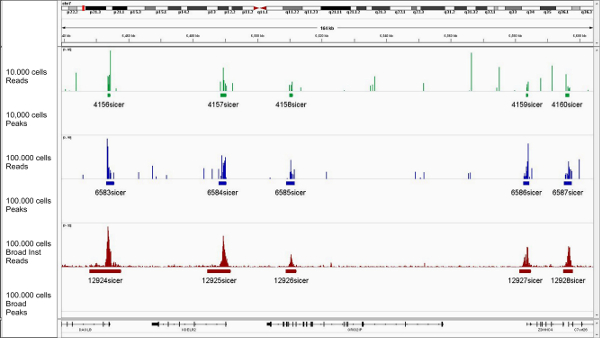
Figure 7. ChIP assays and library generation on 10,000 cells ChIP-seq experiments were generated on 10,000 and 100,000 HeLa-S3 cells using H3K4me3 antibody (0.25 µg/µl). The 35 bp tags were mapped to the human genome with the ELAND aligner. During the subsequent peak calling SICER could reliably identify the enrichments from low cell numbers as well as from millions of cells. The datasets were analyzed and compared with each other and to the reference data generated by the Broad Institute. The low cell samples are consistent and have very high similarity. The 30 pg sample fulfills the ENCODE criteria11 (min. 80% of the top 40% of the peaks should overlap). Please click here to view a larger version of this figure.
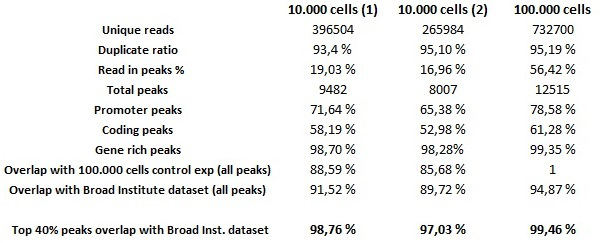
Table 1.
Discussion
Chromatin immunoprecipitation followed by sequencing is now a standard procedure. Here an automated ChIP-seq protocol that can generate chromatin epigenetic profiles with as few as 10,000 cells of starting material is presented.
Automating ChIP and library preparation assays allows standardizing the ChIP optimization procedure and reducing experimental variability. The liquid handling system presented here eliminates many of the manual procedures associated with ChIP reducing the hands on time to just 30 min, minimizes sample loss, and enables accurate ChIP-seq with just a few picograms of library input. In order to achieve successful automated ChIP-seq experiments, it is also crucial to use high quality sheared chromatin preparations and ChIP-seq grade antibodies in each experiment The system uses magnetic bead-based technology and offers flexibility to change main experimental parameters such as incubation time for the antibody coating and immunoprecipitation steps or modification of the washing conditions allowing the researcher to conduct all necessary experiments for ChIP-seq optimization. The automated system is an “open” platform that also allows comparison of multiple reagents in parallel for optimization of experimental conditions for each individual cell line and antibody and enables direct comparison of various types and concentrations of chromatin, different antibodies and even different types of magnetic beads.
One of the limitations of the automated system is the need of automating all protocols in volumes that range from 5 μl to 200 μl. However, the miniaturization of the experiments in this automated platform also enables saving costs in reagents.
In addition to the protocols described in this study, the system is adaptable and also automates a variety of other magnetic bead based applications such as immunoprecipitation and capture of methylated DNA (MeDIP and MethylCap technologies), immunoprecipitation of hydroxylmethylated DNA (hMEDIP), sequential chromatin immunoprecipitation (ReChIP), RNA immunoprecipitation (RNA-IP), bisulfite conversion, and DNA purification assays.
Disclosures
The authors of this article, at the time of its writing, are employed by Diagenode S.A. and Diagenode, Inc., the manufacturer of the automated system described.
Acknowledgements
This work was supported by the BLUERPINT EU grant (BLUEPRINT – A BLUEPRINT of Haematopoietic Epigenomes). We also thank the Walloon Region (DG06) for its financial support.
Materials
| Name | Company | Catalog Number | Comments |
|---|---|---|---|
| PBS | Life technologies | 14190-094 | |
| Trypsin-EDTA | Sigma | T3924-100ML | |
| Formaldehyde 37% | Sigma | F8775-25 | |
| 1.25 M Glycine Solution | Diagenode | C01020010 | Component of the ideal ChIP-seq kit |
| Lysis Buffer iL1 | Diagenode | C01020010 | Component of the ideal ChIP-seq kit |
| Lysis Buffer iL2 | Diagenode | C01020010 | Component of the ideal ChIP-seq kit |
| Shearing Buffer iS1 | Diagenode | C01020010 | Component of the ideal ChIP-seq kit |
| Protease Inhibitors Mix (200x) | Diagenode | C01010130 | Component of the Auto True Micro ChIP kit |
| HBSS (no calcium, no magnesium, no phenol red) | Life technologies | 14175-053 | |
| Lysis Buffer tL1 | Diagenode | C01010130 | Component of the Auto True Micro ChIP kit |
| ChIP Buffer tC1 | Diagenode | C01010130 | Component of the Auto True Micro ChIP kit |
| ideal ChIP-seq kit | Diagneode | C01010051 | |
| ChIP-Buffer H | Diagenode | C01010020 | Component of the Auto Histone ChIP-seq kit |
| Auto Histone ChIP-seq kit | Diagenode | C01010020 | |
| Auto True Micro ChIP kit | Diagenode | C01010130 | |
| H3K79me3 polyclonal antibody-Classic | Diagenode | C15310068 | |
| H3K27me3 polyclonal antibody-Classic | Diagenode | C15410069 | |
| H3K4me3 polyclonal antibody-Classic | Diagenode | C15410030 | |
| H3K4me2 polyclonal antibody-Classic | Diagenode | C15410035 | |
| H3K9ac polyclonal antibody-Premium | Diagenode | C15410004 | |
| H3K9/14ac polyclonal antibody-Premium | Diagenode | C15410200 | |
| H3K36me3 polyclonal antibody-Premium | Diagenode | C15410058 | |
| H3K9me3 polyclonal antibody-Premium | Diagenode | C15410193 | |
| Rabbit IgG | Diagenode | C15410206 | |
| Protein-A coated paramagnetic beads | Diagenode | C01010020 | |
| Auto IPure | Diagenode | C03010010 | |
| MicroChIP DiaPure columns | Diagenode | C03040001 | |
| Universal SyberGreenMaster Mix 1.25 ml | Diagenode | DMMLD2D100 | |
| Quant-IT dsDNA | Invitrogen | Q32854 | |
| Illumina Sample Preparation kit fro Genomic DNA | Illumina | FC-121-3001 | |
| Illumina True-seq kit ChIP library Prep kit | Illumina | IP-202-1012 | |
| MicroPlex Library Preparation Kit | Diagenode | C05010010 | |
| Agencourt AMPure XP beads | Beckman Coulter | A63881 | |
| Illumina Library prep Quantification kit | Kapa Biosystems | KK4844 | |
| IP-Star Compact Automated System | Diagenode | B03000002 | |
| Bioruptor Plus | Diagenode | B01020001 | |
| Bioruptor Pico | Diagenode | B01060001 | |
| Qubit system | Invitrogen | Q32857 | |
| Illumina Hiseq systems | Illumina |
References
- Dahl, J. A., Collas, P. A rapid micro chromatin immunoprecipitation assay (microChIP). Nature Protocols. 3, 1032-1045 (2008).
- Adli, M., Bernstein, B. E. Whole-genome chromatin profiling from limited numbers of cells using nano-ChIP-seq. Nature Protocols. 6, 1656-1668 (2011).
- Blecher-Gonen, R., et al. High-throughput chromatin immunoprecipitation for genome-wide mapping of in vivo protein-DNA interactions and epigenomic states. Nature Protocols. 8, 539-554 (2013).
- Aldridge, S., et al. AHT-ChIP-seq: a completely automated robotic protocol for high-throughput chromatin immunoprecipitation. Genome Biology. 14, 124(2013).
- Farias-Hesson, E., et al. Semi-automated library preparation for high-throughput DNA sequencing platforms. Journal of Biomedicin., & Biotechnology. 2010, (2010).
- Callejas, S., Alvarez, R., Benguria, A., Dopazo, A. AG-NGS: a powerful and user-friendly computing application for the semi-automated preparation of next-generation sequencing libraries using open liquid handling platforms. BioTechniques. 56, 28-35 (2014).
- Zang, C., et al. A clustering approach for identification of enriched domains from histone modification ChIP-Seq data. Bioinformatics. 25, Oxford, England. 1952-1958 (2009).
- Zhang, Y., et al. Model-based analysis of ChIP-Seq (MACS). Genome Biology. 9, 137(2008).
- Heinz, S., et al. Simple combinations of lineage-determining transcription factors prime cis-regulatory elements required for macrophage and B cell identities. Molecular Cell. 38, 576-589 (2010).
- Quinlan, A. R., Hall, I. M. BEDTools: a flexible suite of utilities for comparing genomic features. Bioinformatics (Oxford, England). 26, 841-842 (2010).
- Landt, S. G., et al. ChIP-seq guidelines and practices of the ENCODE and modENCODE consortia. Genome Research. 22, 1813-1831 (2012).
Reprints and Permissions
