

Summary
The neuromuscular junction (NMJ) is altered in a variety of conditions that can sometimes culminate in synaptic failure. This report describes fluorescence microscope-based methods to quantify such structural changes.
Abstract
The neuromuscular junction (NMJ) is the large, cholinergic relay synapse through which mammalian motor neurons control voluntary muscle contraction. Structural changes at the NMJ can result in neurotransmission failure, resulting in weakness, atrophy and even death of the muscle fiber. Many studies have investigated how genetic modifications or disease can alter the structure of the mouse NMJ. Unfortunately, it can be difficult to directly compare findings from these studies because they often employed different parameters and analytical methods. Three protocols are described here. The first uses maximum intensity projection confocal images to measure the area of acetylcholine receptor (AChR)-rich postsynaptic membrane domains at the endplate and the area of synaptic vesicle staining in the overlying presynaptic nerve terminal. The second protocol compares the relative intensities of immunostaining for synaptic proteins in the postsynaptic membrane. The third protocol uses Fluorescence Resonance Energy Transfer (FRET) to detect changes in the packing of postsynaptic AChRs at the endplate. The protocols have been developed and refined over a series of studies. Factors that influence the quality and consistency of results are discussed and normative data are provided for NMJs in healthy young adult mice.
Introduction
The neuromuscular junction (NMJ) is the critical relay synapse that mediates communication between the nervous system and skeletal muscle. It is required for all voluntary movement. Fluorescence microscopy has long been used to study the effects of transgenes on the mouse NMJ 1-3 or to compare the effects of age, diet, exercise and disease upon rodent NMJs 4-11. Such studies have taught us much about the physiology and pathophysiology of the NMJ, but the diverse parameters reported (e.g., AChR area, endplate area, perimeter length, fragmentation indices) often make it difficult to compare the findings of these studies. There is an increasing expectation for pre-clinical researchers to be able to demonstrate reproducibility, particularly in studies with rodent models of disease 12. The protocols described here were refined through a series of studies that investigated developmental, physiological and pathophysiological changes to the NMJ. Such studies require measurement of the area of synaptic specializations at the mouse motor endplate and the relative density of packing of synaptic proteins within postsynaptic specializations13-15.
The utility of these methods is illustrated by recent studies in a mouse model of anti-MuSK myasthenia gravis. Daily injections of IgG from anti-MuSK-positive myasthenia gravis patients into adult mice caused them to become weak within 2 weeks 16. Confocal maximum-projection images of muscle sections that were double-labeled for synaptophysin (in nerve-terminals) and postsynaptic AChRs revealed a progressive decline in the area of AChR staining as the primary change. Importantly the rate of decline was sufficient to explain comparable declines in the amplitude of synaptic potentials, failure of synaptic transmission and muscle weakness 17,18. Qualitatively similar findings were reported by other research groups 10,19. The same NMJ measurement methods have since been used to assess the impact of three drugs for treating anti-MuSK myasthenia gravis in this mouse model 20,21.
Sedentary aging can lead to loss of neuromuscular connections. The protocols described here have revealed an age-associated decline in the area of nerve terminal synaptophysin at motor endplates as mice progress into old age. The same methods revealed that voluntary exercise could largely prevent the reduction in presynaptic nerve terminal area 22, consistent with previous work by other groups 4. Loss of neuromuscular connections also occurs in the SOD1G93A mouse model of amyotrophic lateral sclerosis 9,23.
The studies mentioned above demonstrate that a variety of health conditions may lead to reductions in the area of either pre- or post-synaptic specializations at the NMJ. This may result in impaired synaptic function or may herald complete loss of the neuromuscular connection. Three protocols are described that allow quantitation of the area and density of synaptic specializations. The purpose of the first protocol is to provide a practical and reproducible measure of the areas of pre- and post-synaptic specializations and their alignment at mammalian NMJs, using fluorescence microscopy. Two-dimensional maximum projection confocal images and image analysis with NIH ImageJ is used to detect changes in the area of synaptophysin staining (synaptic vesicles), postsynaptic AChRs and synaptic overlap area. Confocal imaging parameters (gain and offset level) are optimized for each NMJ so as to maximize the visual information used to discern the area of synaptic specialization. Neuromuscular failure can also result from changes in the density of postsynaptic AChR and/or other synaptic proteins. The second protocol can be applied to detect changes in the relative density of postsynaptic proteins such as MuSK, rapsyn, dystroglycan, phosphorylated Src kinase and phosphorylated AChR 18,21.
In myasthenia gravis, a reduced density of AChR within the postsynaptic membrane is the immediate cause of synaptic failure and muscle weakness. The third protocol describes a Fluorescence Resonance Energy Transfer (FRET) method to assess changes in the proximity of adjacent AChRs within postsynaptic membranes 14,15. This method detects energy transfer between neighboring AChRs labeled with fluorescent-α-bungarotoxin (BGT). FRET occurs only when the fluorescent donor and acceptor probes are less than 10 nm apart. This can reveal (submicroscopic) changes in the tightness of AChR packing that may directly relate to the amplitude of synaptic potentials.
These three protocols, refined over the past decade, provide complementary measures of NMJ integrity in a consistent and reproducible way. Use of standardized protocols and parameters should facilitate comparison of the effects of genes and environmental interventions upon the mammalian NMJ.
Subscription Required. Please recommend JoVE to your librarian.
Protocol
NOTE: Design, conduct and reporting of animal experiments should take account of current guidelines 24. Such work must be approved in advance by the local animal welfare authority (in our case the Animal Ethics Committee of the University of Sydney).
1. Euthanasia of the Animal and Muscle Dissection
- Transfer the mouse from the holding room to a separate room where it is euthanized with an intraperitoneal injection of pentobarbitone solution (30 mg/kg) using the mouse handling method detailed by Shimizu 25. Place the mouse back into its cage.
- Once the breathing of the mouse has stopped for more than 1 min, test the foot-withdrawal reflex by gently pinching the foot, and the corneal reflex by lightly brushing the cornea. Only when reflex responses are absent can the mouse be prepared for dissection.
- Consult an atlas of rodent anatomy such as Chiasson 26 and/or seek the help of an experienced anatomist before attempting dissection of the muscle of interest. In each case remove hair from the overlying skin using a small electric shaver before opening the skin to expose the muscle.
NOTE: The dissection will differ for each anatomically-distinct muscle. - Using blunt forceps free the muscle from overlying membranes and surrounding tissues. Grasp and cut the distal tendon to separate the muscle from its insertion.
- Gently tease and snip the muscle free from surrounding tissue right back to its origin. Briefly place the newly dissected muscle into 0.1 M phosphate buffered saline (PBS) solution or Ringer’s Solution prior to further processing.
2. Preparing the Muscle for Cryosectioning
NOTE: Optimal structural preservation can be achieved by whole animal perfusion as previously detailed 27, or immersion fixation (for small muscles) as described in optional step 2.1. However, 4% paraformaldehyde fixation can impair subsequent staining with many antibody probes and with fluorescent-BGT. Glutaraldehyde particularly should be avoided. If muscles are not to be fixed they must be immediately snap frozen (proceed to 2.3).
- Optional immersion fixation: Pin the muscle to wax in a Petri dish at resting length. Cover the muscle with 2% w/v paraformaldehyde (freshly dissolved in PBS) for 2 hr at RT. Wash it with 3 changes of PBS over 30 min (3 x 10 min) then replace the PBS with 30% w/v sucrose in PBS and incubate O/N at 4 °C.
- Make molds ('boats') in advance by folding 2 cm x 1.5 cm pieces of aluminum foil as shown in Figure 1. Place a piece of nitrocellulose membrane in the bottom of the boat. Gently pour cryostat embedding matrix (Materials table) into the boat to a depth of 2 mm, taking care to avoid air bubbles. Place the muscle into the boat, aligning it with the ball-point pen lines on the nitrocellulose. Add more embedding matrix so as to completely cover the muscle (Figure 1).
- Pre-label polypropylene tubes with an indelible marker. Place a drop of water in each tube and chill the tube in liquid nitrogen.
NOTE: The frozen water drop maintains the vapor pressure and prevents desiccation during prolonged -80 °C storage - Using a face shield, thick protective gloves and a large pair of blunt forceps, partially lower a small metal beaker (3 cm diameter, 8 cm deep) containing 2 cm depth of isopentane into a container of liquid nitrogen for 30 sec. Remove the beaker and place it on the bench top. Using a smaller pair of blunt forceps place the mold containing the muscle and embedding matrix into the chilled isopentane. Take care to avoid liquid nitrogen mixing with the isopentane.
- Allow 2 min for the block to freeze completely before using blunt forceps to lift the frozen block out and seal it in the correct pre-labeled and pre-chilled tube (step 2.3).
- Store the tubes temporarily in the liquid nitrogen prior to transfer to -80 °C. Log all samples in a spreadsheet of freezer contents.
3. Cryosectioning and Fluorescence Staining for En Face Images of NMJs
- Peel away the aluminum mold. Within the -20 °C cryostat chamber attach the frozen block to the cryostat chuck so as to cut 20 μm cryosections parallel to the long axis of the muscle fibers (Figure 1). Pick up the sections on poly-L-lysine or gelatin coated microscope slides.
- NOTE: Omit this step if the tissue is fixed prior to freezing. After allowing 30 min for sections to dry onto the slides, fix them by placing a drop of 2% paraformaldehyde in PBS over each section for 15 min at RT.
- Wash slides 3 x 10 min in PBS in a Coplin jar, and then immerse the slides in PBS containing 0.1 M glycine for 30 min to block residual aldehyde groups.
- Wash slides for 10 min in PBS, then immerse in methanol (chilled to -20 ºC) for 7 min. This permeabilization step is a routine part of double labeling with fluorescent-BGT and anti-synaptophysin but it may adversely affect immunostaining for some other proteins.
- Wash slides 2 x 10 min in PBS then place each slide in a stable and leveled humidified chamber. Immediately cover each section with 20 µl of blocking solution (0.2% Triton X-100, 2% bovine serum albumin (BSA) in PBS) for 1 hr at RT. Sections must not be allowed to dry out at any stage of the immunostaining process.
- Carry out the primary incubation: Taking one slide at a time carefully remove the excess blocking solution from over each section and replace it with 20 µl of rabbit anti-synaptophysin (diluted 1:200 in the blocking solution).
- Include a negative-control slide that will be incubated with blocking solution only. This 'no-primary antibody control' is essential in every immunostaining run.
- Taking care that the primary antibody remains in place over each section, close the humidified chamber and incubate for 1-2 days at 4 ºC.
- Inspect each section to confirm that the primary antibody remains in place. Use a Pasteur pipette to gently rinse each slide with PBS and place it in a Coplin jar. Wash all the slides 3 x 10 min in PBS.
- Carry out secondary incubation. Taking one slide at a time, carefully remove excess PBS, lay it in the humidified chamber and cover each section with 20 µl of a mixture containing FITC-conjugated donkey anti-rabbit IgG and BGT conjugated to tetramethyl rhodamine or another red fluorophor (TRITC-/redBGT; 5 g/ml) diluted in blocking solution. Incubate at RT for 2 hr.
- Wash slides 3 x 10 min in PBS in Coplin jars.
- Taking one slide at a time, carefully remove excess PBS and mount with a coverslip using a minimal volume of, glycerol-based, fade-resisting mounting medium. Seal the edges of the coverslips with clear nail varnish. Allow it to dry hard.
- Store the slides in the dark at 4 ºC for up to one week, or at -20 ºC for longer storage periods (up to several months).
4. Unbiased Sampling and En Face Imaging of Motor Endplates
- Blind the slides by labeling each slide with a random code number that remains known only to a second researcher (not involved in the analysis). As a result the operator remains blind to treatment groups until quantitation of NMJ parameters is complete for all the samples.
- Place the slide on the microscope stage and view it under wide field illumination with the TRITC filter set (63X oil 1.3 N.A. objective). Move progressively (field by field) left to right and back until an endplate appears in the field (Figure 2A).
NOTE: Sampling criterion: Every AChR-stained structure that is relatively flat and faces the objective (i.e., extends <15 m in the z-dimension) is considered an endplate and is imaged for analysis (crescents of AChR staining represent cross-sections through endplates and are therefore excluded). - With the confocal pinhole set to 1.0 Airy unit and low laser power optimize the gain and offset levels for TRITC/red-BGT (532 nm laser) at the endplate that is to be imaged. Next optimize FITC/synaptophysin fluorescence using the 488 nm laser. Collect a z-stack of the endplate with a 0.7 μm interval between each optical slice. Save the images with a file name that includes the date of the imaging session, the code name of the slide and the number of the endplate.
NOTE: The scans using the 488 nm and 532 nm lasers (FITC and TRITC) should be collected sequentially (not simultaneously) to avoid contamination of the FITC channel by fluorescence from the red fluorophore and vice versa (bleed-through). - Repeat the sampling and imaging of steps 4.2-4.3 until 20 endplates are collected from the slide/sample.
- Change to the next coded slide and repeat 4.2-4.4. Repeat this for each of the coded slides.
- Collect a few images of endplates from the control slide (no-primary antibody control) using confocal settings that were found optimal for the experimental slides (the FITC fluorescence channel should appear dark).
- At the end of the confocal session transfer the image files to another computer and back up the original files on an external drive or server.
5. Measuring the Area of Synaptic Specializations in En Face Images
- Use NIH ImageJ freeware (http://imagej.nih.gov/ij/) to prepare maximum projection (MIP) images from each z-stack. Save them as tiff files (Figure 2A & B). Filenames should include the image session date, sample code, endplate number and fluorescent channel (e.g., 060414_5723_7_FITC.tiff ).
- Open the z-projection image in ImageJ. Select the acetylcholine receptor image channel (Figure 3A) and select: Image > Type > 8-bit to convert the 24-bit RGB colored image into three 8-bit grayscale images on the screen.
- Using the ImageJ polygon tool draw a rough outline around the endplate of interest in the redBGT stained (ACHR) channel so as to include all apparent stained regions of the particular individual endplate, whilst excluding any staining that does not originate from the endplate of interest (Figure 3C).
- Apply a minimum intensity threshold to the image by selecting: Image > Adjust > Threshold (Figure 3E and associated ImageJ screenshots).
- Adjust the threshold level so as to isolate the AChR-stained portions while excluding surrounding background signal as sub-threshold (Figure 3E). Open a second window with the original (continuous-tone) image immediately beside the window for comparison, to facilitate the decision about the threshold value. Record the threshold value for later use in colocalization analyses.
- Retaining the polygon outline around the endplate select: Analyze > Analyze Particles. In the pop-up menu specify the range of sizes as: 50 to infinity pixels (this eliminates tiny artifacts arising from electrical noise in the photomultiplier).
- Analyze Particles command generates a window with a list of discrete supra-threshold areas and their fluorescence intensity values numbered as they appear in the binary image (Figure 3G and associated ImageJ screenshot). Copy this data into a labeled spreadsheet.
- Measure the Total endplate area (area within the polygon) by selecting: Analyze > Measure. This yields the total endplate area. Copy and paste the data for AChR areas and intensities into a spreadsheet making sure to label columns appropriately, rows will be used for individual endplates for specific slides.
- Switch to the anti-synaptophysin fluorescence channel and repeat steps 5.1 - 5.5, but for the FITC channel (Figure 3B, D and F). The aim is to adjust the threshold so that it creates a binary image that, as closely as possible, matches the boundaries of staining as perceived by eye. Record the threshold value.
- Measure the area of overlap by applying the following steps: Open the original file containing the two channel images and split it into two separate images by selecting: Image > Stacks > Stack to Images.
- Using the Colocalization plugin (downloaded and installed from the ImageJ webpage) Select: Pluggin > Colocalization and input the threshold values previously recorded for the AChR and nerve channels into the respective channel query box. This will yield an overlap image in white pixels (Figure 3H and associated ImageJ screenshots).
- Convert the newly created overlap image into a grayscale format and apply a threshold to the maximum value. The maximum threshold will only select the white pixels, corresponding to the overlap area of the two previous channels. Record in the spreadsheet the resulting area value of 'colocalization', which represents the area of overlap in pixels.
- Prepare a spreadsheet of data sample means, calculate and plot standard deviations and standard errors as histograms or scatterplots 20,22. Note that the value of n generally represents the number of mice per sample group for statistical purposes.
- Plot endplate AChR areas as scatterplots or frequency histograms to determine whether the data is normally distributed before statistical testing (Figure 6).
6. Relative Staining Intensities Compared Using Transverse Optical Sections
NOTE: For this protocol process all muscle samples together and image in a single confocal session. In planning an experiment allow up to 30 min imaging time per muscle sample.
- Cut 15 µm cryosections transverse to the long axis of the muscle fibers and collect onto slides as described at step 3.1.
- Carry out fluorescence staining as described in steps 3.2-3.13.
- Code the stained slides so that imaging and analyses are undertaken with the operator blind to treatment group, as described in step 4.1.
- Using a 40X fluorescence objective (N.A. 0.75) briefly survey a section from each slide to determine a single gain and offset level setting for AChR that will be suitable for all the endplates across all sample slides. The brightest endplate should then be just below 256 grey on the scale. This optimization should be done separately for the second fluorescence channel (collected successively). Record the fixed gain and offset level settings and do not alter them throughout the imaging session.
- Collect images of a fluorescence standard slide (e.g., non-bleaching fluorescent beads), using the same parameters, at the beginning and end of the confocal session to detect any possible fluctuation in laser intensity.
- Use the AChR channel to scan the slide progressively to locate endplates.
- Focus to find the single optical section plane in each microscope field that contains the most number of AChR-stained endplates.
- Scan this single optical section twice and save the averaged image (Figure 4G).
- Keeping the same focal plane switch to the second fluorescence channel (protein of interest) and collect the image as at step 6.8. Save the image file, including in the file name: date of imaging session, sample code, image number and a symbol to indicate the fluorescent channel. Figure 4A-F shows examples of the endplate distribution of AChR compared to rapsyn, MuSK or -dystroglycan (-DG).
- Move the stage to the next field that contains one or more endplates and repeat step 6.8-6.9. Repeat this until a total of 60 endplates are imaged.
- At the end of the imaging session transfer all files to another computer and back them up.
- Open each original image file and while viewing the AChR channel, select: Image > Stacks > Stack to Images, to split channels.
- Select: Image > Type > 8bit to convert to 8-bit grayscale format on the screen. Do this for both fluorescence channels.
- Select: Image > Stacks > Images to Stack. Open a new stack from two previously separated 8-bit images. One can then switch conveniently between the two fluorescence channels within the single window.
- Use the polygon tool to draw a line tightly around the boundary of the AChR staining (Figure 4I).
- Select: Analyze > Measure to measure the average pixel intensity for AChR within the enclosed area (note the importance of drawing the line tightly). Copy this value into a labeled spreadsheet.
- Retaining the same polygon outline (to define the area to be measured), switch to the second fluorescent channel (e.g., Figure 4B, D, F) and select: Analyze > measure. This will yield the average staining intensity for the protein of interest within the synaptic area defined by AChR staining.
- Choose an area away from visible endplate staining then select: Analyze > Measure to measure the average background fluorescence intensity. Repeat this for the other fluorescence channel/s and copy the background values into the spreadsheet of fluorescence values.
- Subtract the average background values from endplate values to obtain the corrected intensities for AChR and the protein of interest at each endplate.
- Divide the corrected endplate intensity values for the protein of interest by the corrected BGT fluorescence intensity to yield the fluorescence intensity ratios 14,21
7. Comparing the Postsynaptic Membrane AChR Density Using FRET
NOTE: This protocol assesses the extent to which AChRs are closely packed (<10 nm spacing) in the postsynaptic membrane. The precise donor and acceptor fluorophore combination is critical to this FRET assay. Names and details of the fluorophores are given in the Materials table. Their spectral properties, in relation to FRET, are discussed in our previous papers 14,15.
- Prepare fixed transverse cryosections as described in section 6.1. All sample groups must be processed together and imaged in the same confocal session.
- Thoroughly mix 2.5 g/ml red-BGT (FRET donor) with 10 g/ml far red-BGT (FRET acceptor) with blocking solution in a small plastic tube by pipetting up and down 12 times. This 1:4 molar mixture maximizes the efficiency of FRET 14.
- Place each slide in a humidified chamber, carefully cover each section with a drop (12 µl) of the above mixture and incubate for 1.5 hr at RT.
- Control sections: cover small numbers of sections with 2.5 g/ml red-BGT (donor only; labeled C1 controls), and also some sections with 10 g/ml far-red-BGT (acceptor only; labeled C2 controls). Incubate these controls as at step 7.3.
- Wash slides 3 x 10 min in PBS and mount in glycerol-based, fade-resisting mounting medium (see step 3.12).
- Perform sampling of endplates as in step 6.7. Fluorescence from the donor and acceptor should be perfectly co-localized at endplates due to the random binding of the fluorescent-BGT molecules.
- Control images: Using the 40X objective and low laser power optimize redBGT gain and offset level settings for endplates from a control slide C1. Optimize far-redBGT gain and offset levels for endplates from control slide C2. Confirm the absence of any fluorescence bleed-through.
- Without changing the laser power, gain or offset-level settings move to the experimental slides and collect images (pre-photobleach) for both fluorescence channels.
- Selectively photobleach the far-red-BGT over a portion of a single endplate by zooming in the scan area then scanning 10 times with the 633 nm laser at 100% power. The fluorescence in the scanned area should become dim.
- Reset the laser power and zoom and collect post-bleach images on both fluorescent channels using the confocal settings established at 7.7.
- Calculate the FRET efficiency (E) from the percentage increase in donor (red-BGT) fluorescence following photobleach of the acceptor (far-red-BGT) according to the following formula*:

*For all situations where the fluorescence of the donor increases after photobleaching the acceptor.

Subscription Required. Please recommend JoVE to your librarian.
Representative Results
Measurement of Synaptic Area at the NMJ
Any estimate of area relies upon the drawing of a boundary to define the extent of synaptic specializations. In healthy young adult muscles NMJ images should display well-defined boundaries for both AChR and synaptophysin staining (Figure 2A and B). Fluorescence intensity for both AChR and synaptophysin rises sharply at the boundary between the peri-synaptic and synaptic portion of the motor endplate (Figure 5A' and B'). For such images a minimum threshold (just above extrasynaptic background fluorescence) will readily isolate the AChR-rich or synaptophysin-rich area of the endplate (horizontal dashed lines in (Figure 5A' and B')). In aged mice and in some disease states endplate staining for AChR may be less intense, AChR cluster edges may appear blurred and there may be higher levels of extrasynaptic autofluorescence (Figure 5D; 17,22). Fluorescence staining with indistinct boundaries can introduce error into estimates of synaptic area. In all situations the aim is to choose a threshold that yields a binary image similar in shape and size to the AChR- or synaptophysin-rich areas as they appear to the eye in the original, continuous-tone image. Conducting the analysis blind to the treatment group should reduce the risk of subjective bias at the thresholding step (step 4.1). Sometimes faint or blurred endplate images can result from sub-optimal processing. Figure 2C and D shows an example of a low quality endplate image from a healthy 2 month old mouse. Blurred edges and faint synaptophysin staining may have arisen in this instance from partial thawing and refreezing of the muscle prior to cryosectioning. Some sections of young healthy (positive control) muscle should be sectioned and processed in parallel with experimental samples to ensure that any impairment evident in the NMJ images is not due to problems with immunostaining. Batches of images compromised by sub-optimal processing should be excluded from analyses.
For en face z-stack images, 15-20 endplates is a reasonable sample size for estimating synaptic areas. A wide diversity in the shapes and sizes of NMJs are found within any given muscle. Scatterplots reveal a considerable range in the AChR-rich area among endplates of the tibialis anterior muscle of any individual mouse (Figure 6A). Nevertheless, the average AChR area (based upon 15-20 en face endplate images) was similar among seven sample mice (~200 m2; Figure 6A). The area of endplate synaptophysin staining also varied considerably among endplates from a given muscle. Once again, using a sample size of 15-20 endplates the mean area of endplate synaptophysin was similar among the 7 mice studied (~170m2; Figure 6B). Frequency histograms of pooled data revealed roughly normal distributions for the area of endplate AChR and synaptophysin (Figure 6A' and B'). However a normal distribution of synaptic areas cannot be assumed in disease states such as myasthenia gravis 16,20. This may affect the choice of the statistical test.
Table I lists areas of pre- and post-synaptic specializations for NMJs for healthy 2 month old (young adult) female C57Bl/6J mice from previous studies. The areas of both pre- and post-synaptic specializations declined with sedentary aging 22. AChR area was also markedly reduced in mice injected with IgG from anti-MuSK myasthenia gravis patients 17,21. Myasthenic mice treated with the cholinesterase inhibitor drug, pyridostigmine, displayed a further significant reduction in endplate AChR area 20.
Relative Intensity of Endplate Fluorescence Labeling
The relative intensity of immunofluorescence labeling can reveal changes in the density of a synaptic protein-of-interest with age, genotype and/or disease state. AChR fluorescence (red-BGT or far-red-BGT) is first used to define the location of the NMJ. The brightness of fluorescence within the 8-bit AChR-rich area is then used to assess changes in the concentration of the protein of interest, relative to control animals. In transverse sections the endplate AChRs typically appear as a crescent shape, but this shape is often irregular (Figure 4A, C, E, H). Low intensity background fluorescence usually reveals whether a patch of AChR staining represents a single endplate, or two separate endplates located on adjacent muscle fibers. Many synaptic proteins (such as rapsyn, MuSK and Src) are colocalized with AChR at the endplate (Figure 4A-D). Immunofluorescence staining with phospho-specific antibodies can also be used to compare the effect of experimental interventions on the phosphorylation status of particular postsynaptic membrane proteins 21.
The reliability and reproducibility of fluorescence intensity measurement depends heavily upon the integrity of the frozen muscle and the quality of the immunostaining. Muscles should be dissected and immediately snap-frozen or paraformaldehyde-fixed (within minutes of the death of the animal) to avoid degenerative changes to the NMJ. Immunostaining depends highly upon the quality of the reagents and optimizing the staining protocol for specific antibodies. For any new batch of primary antibody pilot immunostaining experiments are needed. Freshly cut cryosections of healthy young muscles are incubated with serial 2-fold dilutions of the primary antibody. A known reliable secondary antibody is used and the results are compared. If the protein of interest is known to be restricted to the NMJ then the best antibody concentration is that which yields the highest ratio of NMJ fluorescence intensity relative to that found in extrasynaptic parts of the muscle (background fluorescence). Extrasynaptic (presumably non-specific) fluorescence intensity should not normally exceed 15% of the endplate fluorescence intensity. Similarly 'no primary antibody control' sections (incubated only with secondary antibody) should appear dark, confirming that the secondary antibody did not bind non-specifically. The quality of different batches of (polyclonal) secondary antibodies can vary markedly so alternative secondary antibody batches should be compared before establishing a standard protocol. The ideal test for the specificity of immunofluorescence involves a direct comparison of sections from wild-type mice and negative-control sections from mice that lack the protein-of-interest (gene knockout). The following references describe quantitation of endplate fluorescence staining for MuSK, rapsyn, dystroglycan, src and AChR 13,14,18,21.
Small sample sizes introduce error into estimates of relative fluorescence intensity. Individual endplates varied considerably in fluorescence intensity. Presumably this variability between endplates within a given muscle reflects the diversity of NMJ structure and chance differences in the optical section sampled. However, increasing the number of endplates sampled results in a more stable estimate of average fluorescence intensity (Figure 7). To estimate the average endplate fluorescence intensity 40-60 endplates from each muscle sample should be averaged.
AChR-AChR FRET
Each AChR is a pentamer with two binding sites for BGT (located one on each alpha-subunit). Binding of red-BGT and far-red-BGT to these two sites would yield a donor-acceptor separation of about 9nm 28-30. Thus low efficiency FRET can be detected even before AChRs assemble into clusters 14. However, the efficiency of FRET at murine endplates roughly doubled postnatally, consistent with the more efficient incorporation of AChRs into a tightly packed postsynaptic membrane lattice 14. Using red-BGT and far-red-BGT as the FRET donor and acceptor (respectively), the endplates of 1-2 month old mice produced average FRET efficiencies ranging from 20-37% (Table 2). FRET efficiencies of 20% or more are thought to represent tight packing of AChRs 14. Endplate FRET efficiency was slightly reduced following denervation 14, and markedly reduced after mice were injected with IgG from anti-MuSK-positive myasthenia gravis patients 18. These are conditions in which individual AChRs are less tightly packed into the postsynaptic membrane scaffold by the postsynaptic MuSK/rapsyn system 31.
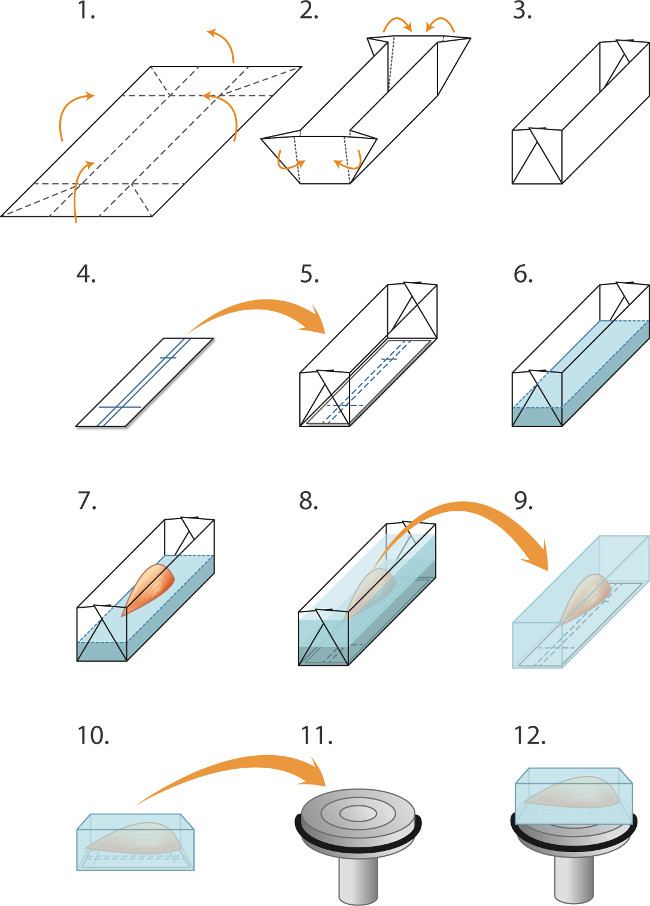
Figure 1. Embedding and freezing muscles for cryosectioning. (1-5) Preparing molds ('boats') prior to freezing a batch of muscles: (1) Aluminum foil is cut into rectangles (2.0 x 3.0 cm) and (2). Folded as indicted to create a mold/boat (3). (4) Rectangles of nitrocellulose immunoblotting paper are cut to fit in the mold and a ball point pen is used to rule lines for orientating the muscle. (5) The nitrocellulose rectangle is placed in the mold. (6-8) Embedding and freezing the muscles: (6) Cryostat embedding matrix fluid is gently poured into the mold (on top of the nitrocellulose) to a depth of 2 mm. (7) Fine forceps are used to lower the muscle, by its tendon into the embedding matrix, in alignment with the nitrocellulose rulings, (8) Additional embedding matrix is gently poured into the mold to cover the muscle, taking care to avoid creating bubbles. The embedded muscle is then snap frozen, sealed in tubes and stored at -80 °C as described in the text. (9-12) Preparation for cryosectioning: (9) Fine forceps are used to peel away the aluminum mold and the frozen block is then placed in the -20 °C cryostat chamber, (10) The markings in the nitrocellulose are used to align the muscle parallel to the face of the chuck (11) for longitudinal sectioning (12). A drop of liquid cryo-embedding medium is used to attach the block to the chilled chuck. Blunt forceps are used to manipulate the frozen muscle block. To obtain transverse sections, the block is instead mounted so that the muscle is perpendicular to the surface of the chuck (not shown).

Figure 2. En face images of NMJs from the tibialis anterior muscle of 2 month old female C57Bl6J mice. The fresh muscle was snap frozen and the sections fixed on the slide as described at step 3.2. Maximum intensity projection images of z-stacks were obtained as described in the first protocol. (A) red-BGT staining reveals a single motor endplate consisting of two sets of AChR-rich primary postjunctional gutters (en face view). (B) Synaptophysin staining with FITC-conjugated secondary antibody reveals the presynaptic nerve terminal, occupying the primary synaptic gutters. A portion of the pre-terminal axon is also visible in the upper part of the panel. (C & D) An example of a poor quality NMJ image from a young healthy mouse. Staining is weak and the boundaries of the pre- and post-synaptic specializations are blurred. This was attributed to deficiencies in the processing of the tissue and/or inadequate time allowed for the primary antibody incubation. Scale bar in panel D represents 10 μm. Please click here to view a larger version of this figure.

Figure 3. Steps in the processing of en face NMJ images (as outlined in protocol 1). (A & B) Original continuous tone MIP images show red-BGT fluorescence revealing AChR and green immunofluorescence for synaptophysin respectively. (C) AChR staining after conversion to an 8-bit grey-scale image and use of the polygon tool to delineate the endplate (thin yellow line). (D) Endplate boundary line carried over to the green synaptophysin image. (E) Application of a minimum intensity threshold command to create a binary image that isolates suprathreshold red-BGT (AChR) fluorescence. The sequence of ImageJ user interface screenshots is displayed to the left of the images. (F) Binary synaptophysin image after application of a separate threshold. (G) Identification of discrete suprathreshold AChR-rich domains within the endplate by application of the Analyze particles command to the binary red-BGT image. The corresponding ImageJ (left of panel (G) shows the input data required. The minimum size of suprathreshold pixel areas required should be entered. (H) Identification of regions of overlap of the binary synaptophysin and AChR images. Overlap is represented by white pixels. ImageJ user interface screenshots (below panel H) show the steps to arrive at the binary overlap image. The chosen minimum intensity threshold values for each fluorescence channel must be entered within the 'Colocalization' window. Scale bar represents 10 μm. Please click here to view a larger version of this figure.

Figure 4. Examples of transverse optical sections used to compare relative fluorescent intensities (protocol 2). The muscle was snap frozen and the sections fixed on the slide as described at step 3.2. (A & B) A single endplate double-labeled with far-red-BGT (AChR; shown here in blue pseudocolor) and FITC-anti-rapsyn illustrates the co-localization of these two interacting proteins in the postsynaptic membrane. (C & D) Two endplates on adjacent muscle fibers display co-localized AChR and MuSK. (E & F) An endplate double-labeled for AChR and -dystroglycan (-DG). The -DG extends right around the muscle fiber perimeter but is enriched at the endplate (scale bar in F, for panels A-F: 25 μm). (G-I) Isolating an endplate for intensity measurement. (G) A typical microscope field, containing three far-red-BGT-stained endplates (scale bar in panel G: 40 μm. (H) An enlarged image of the boxed endplate. (I) The same endplate converted to an 8-bit grayscale image and delineated using the polygon tool of ImageJ (thin yellow line). Average fluorescence intensity is measured within this boundary line (scale bar for H & I: 10 μm). Please click here to view a larger version of this figure.

Figure 5. Influence of image quality in assessing synaptic area. (A & B) High quality en face images of a healthy NMJ from a 2 month old mouse viewed on the red-BGT and anti-synaptophysin fluorescence channels. (A' & B') Fluorescence intensity profiles corresponding to the line drawn across the endplate for A and B respectively. The horizontal red dashed line indicates the minimum threshold used to create the binary image. (C & D) Endplate from an elderly mouse. Endplate synaptophysin staining generally is less intense. (C' & D') Intensity profiles show a high level of extrasynaptic (baseline) fluorescence fluctuation in the synaptophysin (FITC) channel (background) which affects determination of a suitable threshold. Much of this is broad-spectrum tissue autofluorescence. Scale bars represent 10 μm. Please click here to view a larger version of this figure.

Figure 6. Variability of synaptic areas among NMJs within a muscle and between mice. (A) Scatterplots show the total AChR-rich area of endplates from the tibialis anterior muscle of seven naive 2 month old female C57Bl/6J mice obtained by author NT. Each symbol represents an endplate. Each bar represents the mean ± SD for endplates sampled from one mouse. (B) Scatterplots showing the synaptophysin-rich area for the same endplates. (A') Frequency distribution for the AChR-rich area of endplates (pooled data). (B') Frequency distribution for the synaptophysin-rich area of endplates (pooled data). Please click here to view a larger version of this figure.

Figure 7. Effect of sample size upon estimates of endplate fluorescence intensity. Transverse optical sections were used to measure the fluorescence intensity (in arbitrary units) at 40 60 endplates from the tibialis anterior muscle of a healthy 2 month old mouse. Cumulative averages are plotted versus the number of endplates included in the average. (A) Endplate red-BGT fluorescence intensity obtained by author AV. (B) Anti-synaptophysin immunofluorescence intensity for the same endplates as in panel A. (C) Endplate far-red-BGT fluorescence intensity obtained from a second muscle sample by author NG. (D) Anti-rapsyn immunofluorescence intensity from the same endplates as in panel C.
| Study | Muscle | number of mice | AChR area | Synaptophysin area | Overlap area |
| mean ± SD (μm2) | mean ± SD (μm2) | mean ± SD (μm2) | |||
| Morsch et al. (2012)1 | gastrocnemius | 3 | 181 ± 7 | 163 ± 24 | 109 ± 29 |
| diaphragm | 3 | 130 ± 41 | 102 ± 21 | 76 ± 26 | |
| Morsch et al. (2013)1 | tibialis anterior | 3 | 166 ± 26 | 117 ± 21 | n.d. |
| Cheng et al. (2013)2 | tibialis anterior | 4 | 226 ± 18 | 150 ± 44 | 110 ± 34 |
| Tse (unpublished)2 | tibialis anterior | 7 | 213 ± 27 | 157 ± 23 | 111 ± 11 |
| 1 Imaged on a Zeiss LSM 510 Meta microscope but with fixed gain and offset levels. Thresholding and synaptic areas measurements used Metamorph software by MM. | |||||
| 2 Imaged on a Leica DM IRE2 microscope and analyzed following current protocol by the indicated first author, blind to treatment group. | |||||
| n.d. not determined. | |||||
Table 1. Synaptic areas for NMJs of 2 month old female C57Bl/6J mice (healthy controls)
| Study | Muscle | FRET efficiency (%)* | Range (%) |
| (mean ± SEM) | |||
| Brockhausen et al. (2008) | tibialis anterior | 24 ± 1 | n.a. |
| Cole et al. 2010 | tibialis anterior | 26 ± 1 | 22 - 30 |
| Morsch (unpublished) | diaphragm | 37 ± 1 | 24 - 47 |
| Ghazanfari (unpublished) | tibialis anterior | 30 ± 1 | 20 - 45 |
| * FRET between red-BGT and far-red-BGT (Förster radius for FRET pair = 51Å (Life Technologies). | |||
| n.a. data not available | |||
Table 2. Efficiencies for AChR FRET from young adult mice C57Bl6J mice
Subscription Required. Please recommend JoVE to your librarian.
Discussion
The protocols described here have enabled us to reliably measure and quantify changes in the properties of the NMJ across a range of conditions, including normal aging and disease states. The methods described for en face NMJ images will allow researchers to compare the area of pre- and postsynaptic specializations and the area of synaptic overlap/alignment. To compare the relative intensity of pre- and postsynaptic proteins the second protocol, which uses transverse optical sections, is preferred. The third protocol specifically tests for changes in the proximity of packing of AChRs in the postsynaptic membrane.
Specificity controls are vital in immunofluorescence microscopy. When using any primary antibody for indirect immunofluorescence it is necessary to first ensure that it binds specifically to its target protein in the muscle sections. Different kinds of tissue processing and fixation can differentially alter the specificity of antibodies. It is important to confirm that immunofluorescence staining (for say rapsyn) really is concentrated with AChR at the motor endplate. Negative control sections must also be inspected to ensure that the antibody binding is specific. For instance, the best negative control for rapsyn immunofluorescence would be sections from rapsyn-/- mice. These should show no endplate staining with anti-rapsyn. Non-specific fluorescence can also arise from endogenous fluorescent chemicals in the tissue (autofluorescence) or from non-specific binding by the fluorescent secondary antibody conjugate. Such fluorescence is often worsened by aldehyde fixation. In addition, TRITC-BGT staining of endplates can sometimes be detected in the FITC fluorescence channel and this fluorescent bleed-through might be confused with specific FITC immunofluorescence. To guard against the latter three forms of non-specific fluorescence, every batch of slides that are stained should include some 'no-primary antibody control' sections (steps 3.7 and 4.6). Images of endplates from these control sections should be compared to those from the experimental slides to ensure that the indirect immunofluorescent staining of NMJs truly reflects the binding of the primary antibody.
Transverse confocal sections are particularly useful for assessing differences in the relative intensity of immunostaining at the synapse. In transverse confocal sections it is easier to judge precise co-localization of synaptic proteins. The crescent-shaped endplate profile represents just a sample cut-through the NMJ in question. However, the background (extrasynaptic) fluorescence is generally lower compared to en face z-projection images. Thus, it can be easier to discriminate 'real' (specific) immunostaining and establish fixed confocal gain and offset values using transverse optical sections 13-15,18. For example, in a mouse model of myasthenia gravis (where endplate AChR staining is markedly reduced) endplates were clearly delineated in transverse optical sections 18,21. Differences in the average intensity of fluorescence at the NMJ are likely to reflect altered density of the target protein within the synaptic specialization. A caveat is that, in some situations, a structural change in the target protein or occlusion of antibody binding by neighboring proteins might explain altered staining intensity.
The design of experiments requires some consideration. In many cases the experiment would aim to test the impact of a transgene, gene knockdown or disease state upon the size of the NMJ. The experimental sample group might then be compared to healthy young (wild-type) mice of the same sex and genetic background. Baseline values for the area of endplate synaptophysin, AChR and synaptic overlap for several muscles are given in Table 1. Sample size will depend upon the degree of animal-to-animal variation within treatment groups and the effect size (difference in means for the experimental versus control groups per standard deviation). When analysis is restricted to good quality images a fair degree of consistency was found in the sample means for endplate areas among healthy 2 month old female C57Bl6J mice (Figure 6A and B). Thus, it was possible to demonstrate significant 30-40% reductions in synaptic area in mice injected with IgG from anti-MuSK-positive myasthenia gravis patients, compared to controls with a sample size of three mice 17,20,32. Elderly mice displayed greater animal-to-animal variation in endplate parameters than young mice 22. Consequently experiments involving aged mice might require larger sample sizes.
If the primary concern is to measure the size of the en face endplate then the gain and offset level settings should be optimized for every individual NMJ. Individual NMJs can vary considerably in the brightness of AChR and synaptophysin staining, particularly when disease states are examined. Moreover the intensity of extra-synaptic (non-specific) fluorescence is often higher and more variable in muscles of aging animals, compared to those of healthy young animals (Figure 5C and D). The 1 to 256 grey-scale should be fully exploited so as to maximize the tonal information that will be retained in the final images. This will involve adjusting the gain and offset levels for every NMJ for which a z-stack is to be collected. Figure 5D shows an example of an NMJ image where tonal information could be critical in defining the boundaries of area of pre- and post-synaptic specializations.
Measurements of synaptic areas can be applied to different muscle preparations and experiments. Most of our measurements of synaptic areas have employed longitudinal cryosections from snap frozen muscles. Freezing the muscle prior to fixation maintains the antigenicity of a wide range of proteins. When compatible with the antigen, paraformaldehyde fixation and sucrose infiltration prior to cryosectioning (step 2.1) can provide better preservation of NMJ structure. Optimal structural preservation might be obtained by cardiac perfusion with paraformaldehyde. Artifacts of freezing and sectioning can be completely avoided by labeling endplates on the surface of the intact muscle and imaging NMJs on fascicles teased from the fixed muscle 21. Regardless of the preparation, the procedures for sampling, imaging and area quantitation remain unchanged (protocol steps 4-5). Consistent application of blind sampling, imaging and analysis protocols (using different operators, different samples of mice and different times), can result in fairly reproducible average values (compare Cheng et al. and Tse results in Table 1).
Endplates have been described as becoming 'fragmented' in a variety of disease states. For example, in aging mouse muscles, sporadic degeneration of a muscle fiber (followed by its regeneration) resulted in remodeling of the pretzel-like endplate AChR plaque to form multiple smaller AChR clusters 6. In mice injected with IgG from anti-MuSK myasthenia gravis patients, fragmentation of the endplate was rather different. The endplate AChR pretzel largely dispersed, leaving behind a constellation of tiny (<4 m2) AChR 'microaggregates' 20,21. These two examples highlight the need to compare the size distributions for AChR clusters at endplates of control versus experimental animals 21.
Other methods have been reported for assessing synaptic area or staining intensity at the NMJ. Motor endplates can sometimes be folded so that the two-dimensional z-projection images used here might underestimate synaptic areas. Three-dimensional confocal reconstructions might provide more accurate measures if absolute synaptic area must be defined 33. A key advantage of the z-projection protocol described here, however, is its relative simplicity, which has permitted large numbers of endplates to be measured from multiple treatment groups and reliable identification of potential changes. The protocol for comparing endplate staining intensities can be adapted for studying changes in the levels of many different synaptic proteins. The method is limited, however, by the requirement that all samples are processed for immunofluorescence then imaged during the same confocal session. A recent study by Yampolsky et al. 5 described a method for measuring endplate AChR density that might help overcome this limitation. In this study, the same fields of endplates were imaged at several different laser power settings. The slope of the relationship between laser power and rhodamine-BGT fluorescence intensity was used to assess relative changes in AChR density at endplates in different mice 5. This method might be useful for comparing AChR intensity in samples imaged at different times over the course of a prolonged study.
AChR-AChR FRET provides specific and complementary information about the organization of endplate AChRs. Electron microscopic autoradiography using 125. I-α-BGT has shown AChRs to be packed tightly with a planar density of 104 m-2 immediately under each presynaptic site of transmitter release, while adjoining membrane infoldings contain much lower densities of AChR 34. AChR-AChR FRET makes it relatively easy to detect (sub-microscopic) changes in AChR packing. A reduction in FRET efficiency reflects a sub-microscopic redistribution of AChRs in the postsynaptic membrane that might not be detected by a change in average BGT fluorescence intensity. Multiple factors might cause a change in the efficiency of FRET. These include the donor-acceptor spacing and relative orientations, as well as the molecular environment 35,36. A reduction in endplate FRET efficiency might possibly arise from a change in the geometry of the AChR lattice. However, most likely it would be due to a reduction in the percentage of AChRs that are packed into the nano-scale postsynaptic molecular lattice 14.
Loss of the connection between motor neurons and muscle fibers seems to be the immediate cause of muscle weakness in motor neuron disease and in sedentary aging 9,22,23. Shared methods and parameters for measuring NMJs should make it easier for different research groups to compare and contrast published findings. The sharing of detailed protocols (and future improvements on them) may help accelerate progress in understanding the mechanisms of NMJ maintenance and how it can be affected in disease states.
Subscription Required. Please recommend JoVE to your librarian.
Disclosures
The authors declare they have no competing financial interests.
Acknowledgments
This work was supported by the National Health and Medical Research Council [570930]. Imaging was carried out at the Bosch Institute Advanced Microscopy Facility. Former members of the lab, whose work is cited, are thanked for their contributions to developing these methods.
Materials
| Name | Company | Catalog Number | Comments |
| Scanning confocal microscope | Leica | DM 2000 with TCS SP2 system | Most scanning confocal microscopes should be suitable. |
| Zeiss | LSM 510 Meta | ||
| Leica | SPE-II | ||
| Alexa555-a-bungarotoxin (red-BGT) | Life technologies | B35451 | Used for labelling AChRs |
| Alexa647-α-bungarotoxin (far-red-BGT) | Life technologies | B35450 | Far red fluorescence: barely visible through the eyepiece |
| rabbit anti-synaptophysin | Life technologies | 18-0130 | Different batches of primary antibody differ in effective working dilution |
| FITC-anti-rapsyn mab1234 | Milipore | FCMAB134F | Monoclonal antibody conjugated to FITC |
| FITC-donkey anti-rabbit IgG | Jackson | 711-095-152 | Polyclonal secondary antibodies can vary in quality according to source and batch |
| Optimal Cutting Temperature compound (O.T.C.) | ProSciTech | IA018 | Cryostat embedding matrix for freezing muscles |
| DABCO | Sigma | 10981 | Mounting medium that slows photobleaching of fluorophores |
References
- Schmidt, N., et al. Neuregulin/ErbB regulate neuromuscular junction development by phosphorylation of α-dystrobrevin. J Cell Biol. 195, 1171-1184 (2011).
- Amenta, A. R., et al. Biglycan is an extracellular MuSK binding protein important for synapse stability. J Neurosci. 32, 2324-2334 (2012).
- Samuel, M. A., Valdez, G., Tapia, J. C., Lichtman, J. W., Sanes, J. R. Agrin and Synaptic Laminin Are Required to Maintain Adult Neuromuscular Junctions. PLOS ONE. 7, e46663 (2012).
- Valdez, G., et al. Attenuation of age-related changes in mouse neuromuscular synapses by caloric restriction and exercise. Proc Natl Acad Sci (USA). 107, 14863-14868 (2010).
- Yampolsky, P., Pacifici, P. G., Witzemann, V. Differential muscle-driven synaptic remodeling in the neuromuscular junction after denervation). Eur J Neurosci. 31, 646-658 (2010).
- Li, Y., Lee, Y., Thompson, W. J. Changes in Aging Mouse Neuromuscular Junctions Are Explained by Degeneration and Regeneration of Muscle Fiber Segments at the Synapse. J Neurosci. 31, 14910-14919 (2011).
- Zhu, H., Bhattacharyya, B. J., Lin, H., Gomez, C. M. Skeletal muscle IP3R1 receptors amplify physiological and pathological synaptic calcium signals. J Neurosci. 31, 15269-15283 (2011).
- Valdez, G., Tapia, J. C., Lichtman, J. W., Fox, M. A., Sanes, J. R. Shared resistance to aging and ALS in neuromuscular junctions of specific muscles. PLoS ONE. 7, e34640 (2012).
- Perez-Garcia, M. J., Burden, S. J. Increasing MuSK Activity Delays Denervation and Improves Motor Function in ALS Mice. Cell reports. 2, 1-6 (2012).
- Klooster, R., et al. Muscle-specific kinase myasthenia gravis IgG4 autoantibodies cause severe neuromuscular junction dysfunction in mice. Brain. 135, 1081-1101 (2012).
- Pratt, S. J., Shah, S. B., Ward, C. W., Inacio, M. P., Stains, J. P., Lovering, R. M. Effects of in vivo injury on the neuromuscular junction in healthy and dystrophic muscles. J Physiol. 591, 559-570 (2013).
- Landis, S. C., et al. A call for transparent reporting to optimize the predictive value of preclinical research. Nature. 490, 187-191 (2012).
- Gervásio, O. L., Phillips, W. D. Increased ratio of rapsyn to ACh receptor stabilizes postsynaptic receptors at the mouse neuromuscular synapse. J Physiol. 562, 673-685 (2005).
- Gervásio, O. L., Armson, P. F., Phillips, W. D. Developmental increase in the amount of rapsyn per acetylcholine receptor promotes postsynaptic receptor packing and stability. Dev Biol. 305, 262-275 (2007).
- Brockhausen, J., Cole, R. N., Gervásio, O. L., Ngo, S. T., Noakes, P. G., Phillips, W. D. Neural agrin increases postsynaptic ACh receptor packing by elevating rapsyn protein at the mouse neuromuscular synapse. Dev Neurobiol. 68, 1153-1169 (2008).
- Cole, R. N., Reddel, S. W., Gervásio, O. L., Phillips, W. D. Anti-MuSK patient antibodies disrupt the mouse neuromuscular junction. Ann Neurol. 63, 782-789 (2008).
- Morsch, M., Reddel, S. W., Ghazanfari, N., Toyka, K. V., Phillips, W. D. Muscle Specific Kinase autoantibodies cause synaptic failure through progressive wastage of postsynaptic acetylcholine receptors. Exp Neurol. 237, 237-286 (2012).
- Cole, R. N., Ghazanfari, N., Ngo, S. T., Gervasio, O. L., Reddel, S. W., Phillips, W. D. Patient autoantibodies deplete postsynaptic Muscle Specific Kinase leading to disassembly of the ACh receptor scaffold and myasthenia gravis in mice. J Physiol. 588, 3217-3229 (2010).
- Viegas, S., et al. Passive and active immunization models of MuSK-Ab positive myasthenia: Electrophysiological evidence for pre and postsynaptic defects. Exp Neurol. 234, 506-512 (2012).
- Morsch, M., Reddel, S. W., Ghazanfari, N., Toyka, K. V., Phillips, W. D. Pyridostigmine but not 3,4-diaminopyridine exacerbates ACh receptor loss and myasthenia induced in mice by Muscle Specific Kinase autoantibody. J Physiol. 591, 2747-2762 (2013).
- Ghazanfari, N., Morsch, M., Reddel, S. W., Liang, S. X., Phillips, W. D. Muscle Specific Kinase autoantibodies suppress the MuSK pathway and ACh receptor retention at the mouse neuromuscular junction. J Physiol. 592, 2881-2897 (2014).
- Cheng, A., Morsch, M., Murata, Y., Ghazanfari, N., Reddel, S. W., Phillips, W. D. Sequence of age-associated changes to the mouse neuromuscular junction and the protective effects of voluntary exercise. PLoS One. 8, e67970 (2013).
- Schaefer, A. M., Sanes, J. R., Lichtman, J. W. A compensatory subpopulation of motor neurons in a mouse model of amyotrophic lateral sclerosis. J Comp Neurol. 490, 209-219 (2005).
- Kilkenny, C., Browne, W. J., Cuthill, I. C., Emerson, M., Altman, D. G. Improving bioscience research reporting: the ARRIVE guidelines for reporting animal research. PLos Biol. 8, e1000412 (2010).
- Shimizu, S. Routes of Administration. The Laboratory Mouse. Hedrich, H. J., Bullock, G. , Elsevier. (2004).
- Chiasson, R. B. Laboratory anatomy of the white rat. , Brown. Dubuque, Iowa. (1988).
- Gage, G. J., Kipke, D. R., Shain, W. Whole Animal Perfusion Fixation for Rodents. J. Vis. Exp. (65), e3564 (2012).
- Mitra, A. K., Stroud McCarthy, M. P., M, R. Three-dimensional structure of the nicotinic acetylcholine receptor and location of the major associated 43-kD cytoskeletal protein, determined at 22A by low dose electron microscopy and x-ray diffraction to 12.5A. J Cell Biol. 109, 755-774 (1989).
- Paas, Y., et al. Electron microscopic evidence for nucleation and growth of 3D acetylcholine receptor microcrystals in structured lipid-detergent matrices. Proc. Natl Acad. Sci. (USA). 100, 11309-11314 (2003).
- Samson, A. O., Scherf, T., Eisenstein, M., Chill, J. H., Anglister, J. The mechanism for acetylhcoline receptor inhibition by α-neurotoxins and species-specific resistance to α-bungarotoxin revealed by NMR). Neuron. 35, 319-332 (2002).
- Ghazanfari, N., et al. Muscle Specific Kinase: Organiser of synaptic membrane domains. Int J Biochem Cell Biol. 43, 295-298 (2011).
- Ghazanfari, N., Morsch, M., Tse, N., Reddel, S. W., Phillips, W. D. Effects of the β2-adrenoceptor agonist, albuterol, in a mouse model of anti-MuSK myasthenia gravis. PLoS ONE. 9, e87840 (2014).
- Prakash, Y. S., Miller, S. M., Huang, M., Sieck, G. C. Morphology of diaphragm neuromuscular junctions on different fibre types. J Neurocytol. 25, 88-100 (1996).
- Salpeter, M. M., Harris, R. Distribution and turnover rate of acetylcholine receptors throughout the junction folds at a vertebrate neuromuscular junction. J Cell Biol. 96, 1781-1785 (1983).
- Soper, S. A., Nutter, H. L., Keller, R. A., Davis, L. M., Shera, E. B. The photophysical constants of several fluorescent dyes pertaining to ultrasensitive fluorescence spectroscopy. Photochem Photobiol. 57, 972-977 (1993).
- Panchuk-Voloshina, N., et al. Alexa dyes, a series of new fluorescent dyes that yield exceptionally bright, photostable conjugates. J Histochem Cytochem. 47, 1179-1188 (1999).
