We outline a methodology for the processing of whole blood to obtain a variety of components for further analysis. We have optimized a streamlined protocol that enables rapid, high-throughput simultaneous processing of whole blood samples in a non-clinical setting.
A subscription to JoVE is required to view this content. Sign in or start your free trial.
Method Article
Rapid Fractionation and Isolation of Whole Blood Components in Samples Obtained from a Community-based Setting
In This Article
Summary
Abstract
Collection and processing of whole blood samples in a non-clinical setting offers a unique opportunity to evaluate community-dwelling individuals both with and without preexisting conditions. Rapid processing of these samples is essential to avoid degradation of key cellular components. Included here are methods for simultaneous peripheral blood mononuclear cell (PBMC), DNA, RNA and serum isolation from a single blood draw performed in the homes of consenting participants across a metropolitan area, with processing initiated within 2 hr of collection. We have used these techniques to process over 1,600 blood specimens yielding consistent, high quality material, which has subsequently been used in successful DNA methylation, genotyping, gene expression and flow cytometry analyses. Some of the methods employed are standard; however, when combined in the described manner, they enable efficient processing of samples from participants of population- and/or community-based studies who would not normally be evaluated in a clinical setting. Therefore, this protocol has the potential to obtain samples (and subsequently data) that are more representative of the general population.
Introduction
Multiple studies have characterized differences in gene expression, DNA methylation and cell subset in blood among individuals with and without mental (or other) illnesses1-4. These studies, however, have been obtained from clinical settings in which disease-associated differences may be magnified due to the generally more severe nature of the illnesses for which patients are seeking treatment. Due to advances in “omics” approaches, the past decade has seen an explosion of interest in obtaining biologic samples from community and/or epidemiologic settings5-7, in order to provide population-based estimates of disease prevalence and a broader picture of the environmental determinants of these mental and/or physical illnesses.
A key challenge in this regard is the requirement for rapid processing of the collected specimens. Degradation of mononuclear cells, key immune system components that are frequently used to assess the health of an individual, begins immediately upon blood draw with a significant decrease in recovery after 2 hr of collection8-10. To address this challenge, we present an optimized protocol in which multiple components of human whole blood are simultaneously isolated from samples obtained in homes of subjects living in a large metropolitan area. The protocol is based upon our compilation and modification of current techniques, including storage of all “extra” fractions in the event future techniques allow for further isolation/analyses. While alternative methods or kits may be employed in place of the individual methods described here, those outlined have proven to be a reliable and efficient means for processing samples in a high-throughput manner. High-quality fractions (PBMCs, DNA, serum, and RNA) of fresh blood can be produced within 2 hr of collection and all assay-ready specimens can be available within 2 days (Figure 1).
This protocol was developed to enable the efficient processing of samples collected from community-dwelling, adult residents of the city of Detroit for testing in the Detroit Neighborhood Health Study (DNHS; DA022720, RC1MH088283, DA022720-05-S1), a population-based study of the social and biological determinants of post-traumatic stress disorder (PTSD) and other mental illnesses. The prevalence of PTSD in Detroit is more than twice the national average11,12. Identifying biological determinants of PTSD in this population may help to develop appropriate pharmacologic and/or cognitive-behavioral interventions to aid those suffering from the disorder, both in this urban population, and in other high-risk populations (e.g., returning military veterans). Our laboratory, previously located at Wayne State University in Detroit, Michigan, was selected for processing based on our expertise in handling fresh tissue samples derived from a variety of sources, the necessity to begin processing the samples within 2 hr of collection, and our proximity to the collection sites. With this unique opportunity at hand, our goal was to optimize the processing for greatest yield of DNA, RNA, serum and peripheral blood mononuclear cells (PBMCs) from each specimen (a total of N=1,639 samples over 5 waves of specimen collection). The procedures outlined here can be performed simultaneously in a non-clinical setting, thus producing starting material (see Table 1 for average yields) for a multitude of downstream applications including microarray, epigenetic, real-time RT-PCR, and flow cytometry analyses.
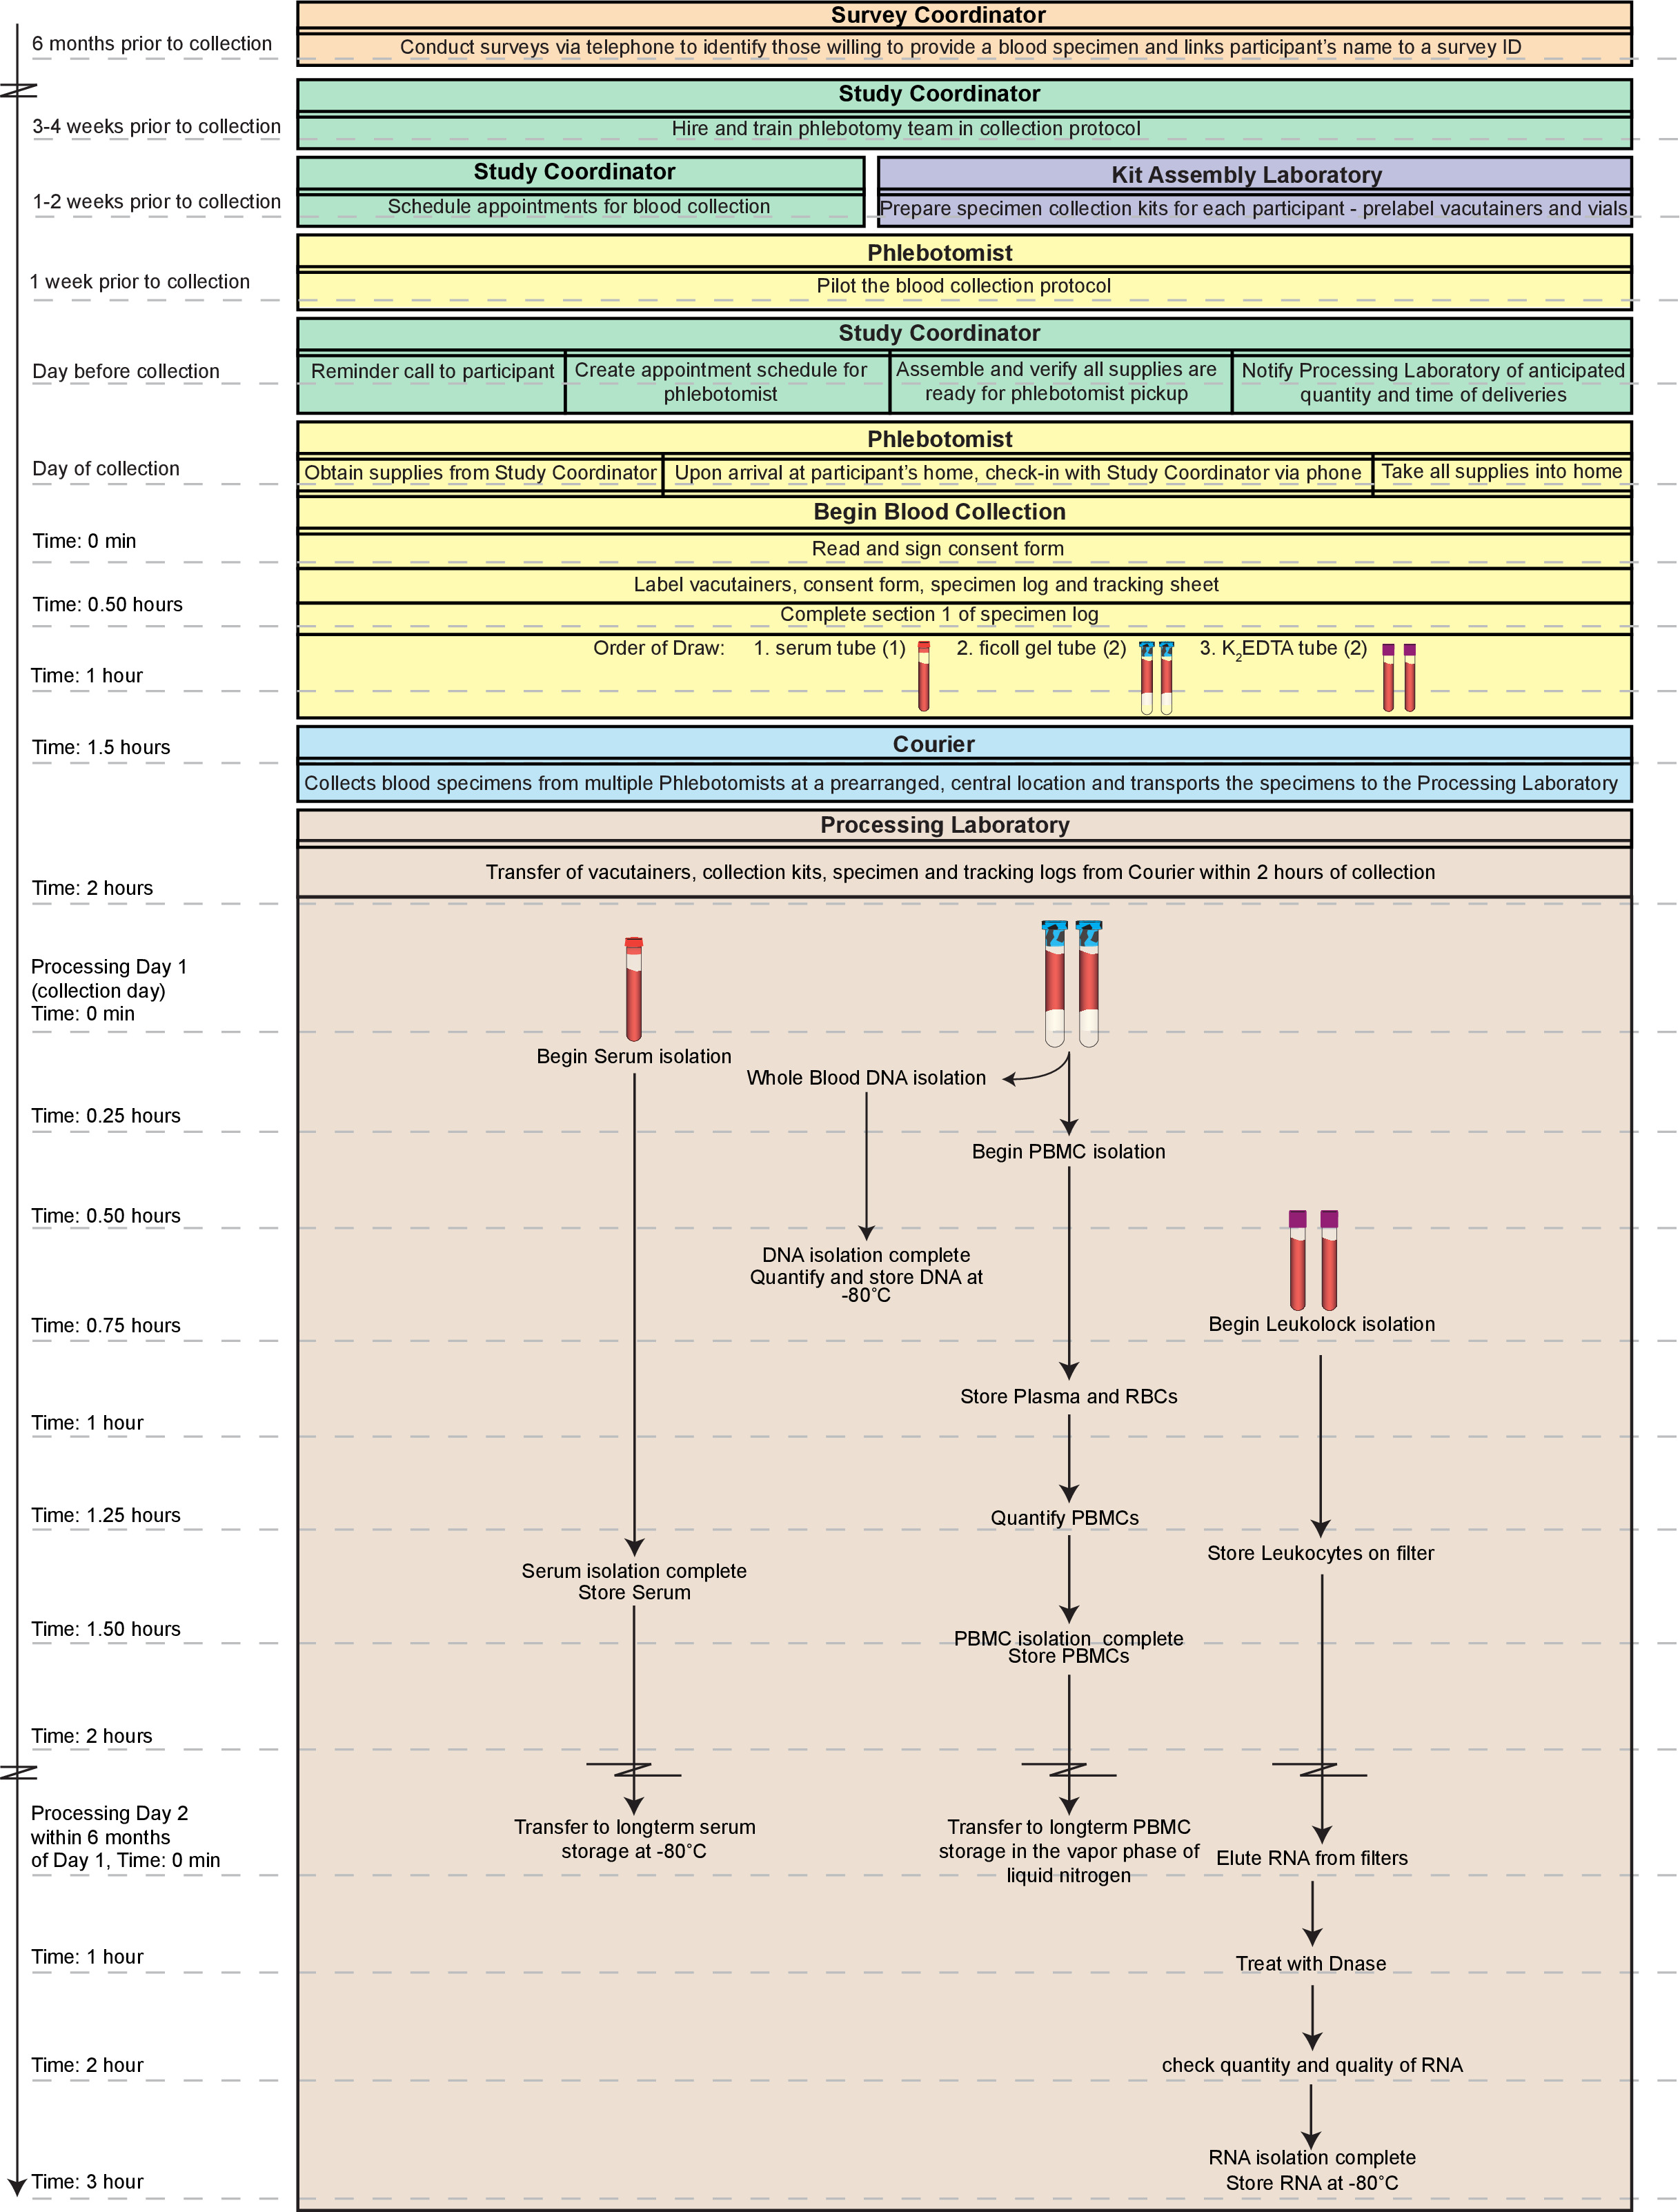
Figure 1. Overall work flow. The overall process depicted here includes the logistics of obtaining the blood specimens from identifying consenting participants to the blood draw itself. High-quality, fractions (peripheral blood mononuclear cells; PBMCs, DNA, serum, and RNA) of fresh whole blood can be produced within 2 hr of collection and all assay-ready specimens can be available within 2 days. Moreover, the fractions prepared through this method are suitable for long-term storage if samples are not to be tested immediately. The entire timeline outlined here could be completed in a single day (~5 hr total). However, such a day would be extremely labor intensive especially for a single technician with substantial experience with the techniques. Thus, we recommend dividing the procedures on Day 1 between at least two technicians and completing the RNA processing on Day 2. Please click here to view a larger version of this figure.
Access restricted. Please log in or start a trial to view this content.
Protocol
The Detroit Neighborhood Health Study was reviewed and approved by the University of Michigan's Institutional Review Board. All participants provided informed consent prior to their participation in the study.
1. Overview
- Properly document all stages from recruitment through analysis of endpoint data. Perform the protocols on Day 1 simultaneously, switching stages and overlapping as time permits. The sequence of stages is written to optimize performance efficiency. Figure 1 provides an overview of the entire process.
Note: The term, “participant” is used throughout to signify the de-identified blood sample drawn from a consenting individual. The times in parentheses below indicate hands-on time. Examples of the tracking sheet and specimen log can be found in supplementary Tables S1 and S2, respectively. Samples are collected by phlebotomists in homes of individuals identified as consenting participants by the study coordinator and transported to the lab by a courier (see Supplementary Information (SI) 1 for further pre-processing details).
2. Day 1 Setup
- Prepare 1x Phosphate-buffered saline (PBS).
- Preheat a heat block to 56 ºC.
- Prepare the protease (see SI 2) by aliquoting 20 µl into the appropriate number of microcentrifuge tubes for the day’s deliveries (2 per participant).
- Ensure Buffers AW1 and AW2 (wash buffers provided in the DNA isolation kit that increase the purity of the DNA) are ready for use, adding 100% ethanol as indicated on the label, if necessary.
- Cool down refrigerated centrifuge to 4 °C.
- Replace the cap on the bottle of 1x PBS with the provided rubber septum cap and pierce the rubber septum with a transfer spike, retaining the screw cap on top of the transfer spike to prevent evaporation. Repeat with the bottle of RNA stabilization solution.
- Following preparation of the buffers, centrifuge and heat block, document the time of vacutainer delivery on the sample tracking sheet (see Table SI).
3. Day 1: Processing Whole Blood Sample for DNA, PBMCs and Leukocyte RNA (2 hr)
- Overview
- Allot adequate time to minimize the delay between blood draw and processing start time. Begin processing of the Ficoll containing vacutainers within 2 hr of blood draw to avoid an increase in red blood cell contamination and a decrease in mononuclear cell recovery.
- Assume collection of 2 vacutainers containing Ficoll gel gradient, 2 K2 Ethylenediaminetetraacetic acid (EDTA) vacutainers, and 1 serum vacutainer per adult participant. Upon delivery of the vacutainers to the laboratory, have a technician sign the tracking sheet signifying acceptance of the samples. Begin processing immediately with the start time documented on a per vacutainer basis on the specimen log.
- Serum Isolation Stage 1 (1 min)
- Document the start time on the specimen log (see Table SI 2). Centrifuge (with brake and acceleration OFF) the 7.0 ml serum (red) vacutainer (1 per participant) using a swinging bucket rotor with aerosol caps (biosafety level 2; BSL2 certified) for 20 min, 1,300 x g, 4 ºC.
- DNA Isolation Stage 1 (15 min)
Note: For further details on this isolation procedure, see manufacturer’s protocol13.- Document the start time. In a BSL2 cell culture hood, invert the vacutainers containing the Ficoll gel 5 times then add 200 µl whole blood from the top of one of the vacutainers into each of two 20 µl aliquots of protease (400 µl total per participant). Leaving the protease + blood microcentrifuge tubes in the hood, continue to the centrifugation of the Ficoll containing vacutainers in step 3.4.1.
Note: Use the vacutainer with the largest collection volume, keeping in mind the necessity of balancing the centrifuge (i.e., it may be necessary to remove 200 µl from each of the two vacutainers) when spinning the vacutainers in step 3.4.1. Additionally, to ensure proper separation during the processing of the blue vacutainers, the level of blood remaining in the vacutainer should not be less than 2.5 inches above the Ficoll layer.
- Document the start time. In a BSL2 cell culture hood, invert the vacutainers containing the Ficoll gel 5 times then add 200 µl whole blood from the top of one of the vacutainers into each of two 20 µl aliquots of protease (400 µl total per participant). Leaving the protease + blood microcentrifuge tubes in the hood, continue to the centrifugation of the Ficoll containing vacutainers in step 3.4.1.
- PBMC Isolation Stage 1 (1 min)
- Document the start time (must be within 2 hr of blood draw to avoid an increase in red blood cell contamination and a decrease in mononuclear cell recovery).Invert the Ficoll containing vacutainers 8-10 times. Centrifuge (with brake and acceleration OFF) the vacutainers (2 per participant) using a swinging bucket rotor with aerosol caps (BSL2 certified) for 30 min, 1,600 x g, 22 °C.
- DNA Isolation Stage 2 (20 min)
- Return to the hood and add 200 µl Buffer AL to each of the protease + blood microcentrifuge tubes (step 3.3.1). Cap, remove from hood, vortex 15 sec and flash spin.
- Incubate 56 ºC in a heat block, 10 min.
- Remove the tubes from the heat block. Flash spin. Return to the BSL2 hood. Add 200 µl 100% ethanol. Cap, remove from hood, vortex 15 sec and flash spin. The remaining steps can be completed outside of the hood.
- Apply lysate (within 30 min of step 3.5.3) to a labeled spin column (in a 2 ml collection tube). Close the cap to avoid cross contamination via aerosols. Centrifuge 6,000 x g, 1 min.
- Discard the collection tube containing the filtrate and place the spin column in a new 2 ml collection tube.
- Add 500 µl Buffer AW1 to the column without moistening the rim, close the cap, and centrifuge 6,000 x g, 1 min.
- Discard the collection tube containing the filtrate and place the spin column in a new 2 ml collection tube.
- Add 500 µl Buffer AW2 to the column without moistening the rim, close the cap, and centrifuge 20,000 x g, 3 min.
- Discard the collection tube containing the filtrate and place the spin column in a new 1.5 ml collection tube (not included in the kit), and centrifuge 20,000 x g, 1 min.
- Discard the collection tube containing the filtrate and place the spin column in a new 1.5 ml collection tube (not included in the kit).
- Add 200 µl Buffer AE or water to each column and incubate at RT for 5 min. Centrifuge 6,000 x g, 1 min.
- Repeat step 3.5.11 eluting into the same collection tube.
- Pool the eluted DNA from the 2 columns per participant. Total yield ~800 µl per participant.
- Quantify the samples using a spectrophotometer when time allows.
- Aliquot DNA as desired into 2 ml cryovials, documenting the concentration of each on the specimen log. Transfer cryovials to a cryobox and place at -80 °C for long term storage. Document the freezer start time.
- Leukocyte RNA Isolation Stage 1 (30 min)
Note: Perform in a Biosafety Level 2 certified cell culture hood. For further details on this isolation see manufacturer’s instructions15.- Pierce the rubber septum of the K2 EDTA vacutainer with a transfer spike. Retain the sheath and screw cap for use in step 3.6.11. Following BSL2 standard practices, take care to avoid exposure to bloodborne pathogens.
- Attach the white slip connector to the top of the transfer spike.
- Label the filter with the corresponding participant ID then connect the inlet (flared end) of the filter to the white slip connector.
- Attach a sheathed 25⅝ G needle to the outlet (tapered end) of the filter. Preparing the filter assembly prior to delivery expedites the process considerably and therefore, attaching the white slip connector to the transfer spike, adding the filter, then the sheathed needle and setting the assembly in a culture tube rack until use, is recommended.
- Following assembly of the K2 EDTA tube system, safely unsheathe the needle (use the end of a metal spatula). Stab the needle into an empty 10 ml evacuated blood collection tube (serum receiver tube) and invert the K2 EDTA vacutainer/filter/receiver tube assembly. Following BSL2 standard practices, take care to avoid exposure to bloodborne pathogens.
- Allow the blood to filter through until the wedge-shaped sections of the filter have cleared of blood. Filtration takes about 2 min and can be placed in a test tube rack during filtration.
- Remove the filter from the assembly. Leave the needle in the tube containing the filtrate and discard the entire assembly in a Sharps container.
- Attach a 5 ml syringe to the transfer spike on the bottle of 1x PBS, invert the bottle, and withdraw 3 ml.
- Attach the syringe with PBS to the inlet of the filter and flush the filter (3-5 drops per second). Collect the flow-through in a biological waste container. Detach the syringe from the filter without retracting the plunger.
- Following filtration and a PBS wash, withdraw 3 ml of the RNA stabilization agent using a new 5 ml syringe and the method described in step 3.6.8. Flush the filter as in step 3.6.9. The RNA stabilization agent should remain on the filter. Detach the syringe from the filter without retracting the plunger.
- Seal the filter inlet and outlet with the sheath and screw cap retained from the transfer spike leaving the filter saturated with RNA stabilization agent. The filter can be stored at this point. Store the filter at -80 ºC until time permits (~2 hr) to complete steps 5.3 to 5.4.7.
Note: Filters stored at -80 ºC for up to a year after collection have been processed without a decrease in RNA quality.
- PBMC Isolation Stage 2 (30 min)
- Remove the Ficoll containing vacutainers from the centrifuge (step 3.4.1) and continue in a BSL2 hood. Vacutainers should display separation as in Figure 2. If not, see Table 2.
- Once the vacutainer is returned to the BSL2 hood, remove the stopper and withdraw 1.5 ml of the top, yellowish, plasma layer (Figure 2) using a serological pipette without getting close to the mononuclear (clear/white) layer. Transfer the plasma to a 5 ml cryovial — (Pool from 2 vacutainers — 1 participant). Log the volume collected. See step 3.7.6 for storage instructions.
Note: The best separation and greatest PBMC yields come from participants who have fasted at least 12 hr prior to blood collection. - Transfer the remaining plasma and the whitish, mononuclear layer (everything above the gel layer — Figure 2) using a serological pipette, to a 15 ml conical tube, pooling the mononuclear layer from each of the two Ficoll containing vacutainers per participant into one conical tube.
- Add 1x PBS to bring the total volume in the conical tube to 15 ml. Cap tube and invert 5 times. Centrifuge (with brake and acceleration OFF) 15 min, 300 x g, 22 °C.
- Return to the Ficoll containing vacutainers in the hood and collect the red blood cells (RBCs) by using a 5¾” Pasteur pipet to swirl around and loosen the outside of the Ficoll gel layer and remove it if possible. Use a serological pipet to collect and transfer the RBCs (~4.5 ml) to a 5 ml cryovial. Log the volume collected.
- Transfer both 5 ml cryovials (plasma in step 3.7.2 and RBCs in step 3.7.5) to a controlled rate freezing container and put at -80 ºC for at least 24 hr after which time they can be transferred to a cryobox and returned to -80 ºC for long term storage.
- Return the conical tube to the hood, when the centrifugation in step 3.7.4 is complete, and aspirate all but ~500 µl of the PBS without disturbing the pellet. PBMC yield is greater if ~200 µl of PBS is left above the pellet at this stage.
- Add fresh 1x PBS to bring the volume to 10 ml. Resuspend the pellet gently. Cap tube and invert 5 times. Centrifuge (with brake and acceleration OFF) 10 min, 300 x g, 22 °C.
- Serum Isolation Stage 2 (10 min)
Note: Perform in a BSL2 hood.- Aliquot the top serum layer from the serum vacutainer, following centrifugation (step 3.2.1), into 2 ml cryovials as desired. Typical yield is 2.5 ml (Table 1). Log the volume. For example, use 4 cryovials aliquoting 200 µl into cryovial 1, 1,000 µl into cryovial 2 and then divide the remaining into cryovials 3 and 4.
- Transfer the cryovials to a cryobox and place at -80 ºC for long-term storage. Document the freezer start time.
- PBMC Isolation Stage 3 (15 min)
- Return to the hood, after centrifugation (step 3.7.8), and aspirate as much supernatant/PBS as possible without disturbing the pellet. Resuspend pellet by pipetting in 2.5 ml PBMC Freezing Medium 1 (see SI 2).
- Add 2.5 ml PBMC Freezing Medium 2 (see SI 2) to the cell/medium solution in step 3.9.1. Vortex gently.
- Aliquot 10 µl of the cell solution into a 0.65 ml microcentrifuge tube (further dilution may be necessary). Add 10 µl of 0.4% trypan blue stain into the 0.65 ml microcentrifuge tube and mix by pipetting several times. For further details see the manufacturer's manual16.
- Pipet 10 µl of the mixture into a cell counting chamber slide and place slide into the cell counter within 3 min of mixing. Zoom in and focus the cells. Press the “Count Cells” to obtain PBMC count.
- Aliquot, if the viable PBMC number is above 3 million cells per milliliter (mc/ml), as desired into cryovials and continue to step 3.9.9. Store PBMCs in up to 5 cryovials at a concentration of at least 3 mc/ml each.
- If the viable PBMC number is below 3 mc/ml, calculate the total number of cells by multiplying the viable mc/ml by 5 ml. Divide that number by 4, 3, 2 or 1 ml so that there will be at least one tube with 3 mc/ml.
- Centrifuge the conical tube containing the cells/freezing medium solution for 5 min at 300 x g (brake and acceleration OFF). After centrifugation, aspirate the appropriate volume of freezing medium (supernatant) leaving the volume calculated above (4, 3, 2 or 1 ml).
- Resuspend the pellet in the remaining supernatant and aliquot at least 3 mc/ml into the appropriate number of cryovials (1-4) at 1 ml/cryovial. Final freezing medium is 10% Dimethyl Sulfoxide (DMSO)/20% Fetal Bovine Serum (FBS)/70% Roswell Park Memorial Institute (RPMI) 1640.
- Document the cell count per cryovial. Transfer the cryovials to a controlled rate freezing container and put at -80 ºC for at least 24 hr after which time the cryovials may be transferred to a cryobox and put in a liquid nitrogen tank (vapor phase) for long term storage. Document freezer start time.
4. Day 2 Setup
- Heat an aliquot (220 µl per filter) of nuclease free 0.1 mM EDTA in a nuclease-free tube to 80 °C in a heat block.
- Prepare wash solutions 1 and 2 (see SI 2).
5. Day 2: Long Term Sample Storage and Leukocyte Filter Processing (3 hr)
- Overview.
- Perform this procedure within 6 months of the application of the leukocytes to the filter.
Note: Overall, Day 2 processing takes about 3 hr and while it is labeled “Day 2,” the key requirement is that the filter processing portion should be performed on a day when there is no Day 1 processing occurring in the lab.
- Perform this procedure within 6 months of the application of the leukocytes to the filter.
- Long term sample storage (15 min)
- Perform this procedure every day, prior to the delivery of new vacutainers to the lab for Day 1 processing. Transfer the cryovials that were stored O/N in controlled rate freezing containers on Day 1 into appropriately labeled cryoboxes and return them to -80 ºC or liquid nitrogen (vapor phase) for long term storage. Organize the cryovials based on sample type (e.g., DNA, PBMC, RBCs, etc.) to expedite sample location tracking for endpoint assays.
- Leukocyte RNA Filters Processing (45 min).
Note: For more information on this procedure see the manufacturer's instructions17.- Bring the filter to RT (thawing about 5 min).
- Remove the sheath and screw cap from the filter. Retract the plunger of a 5 ml syringe and connect it to the inlet (flared end) of the filter, depress the plunger to expel the RNA stabilization agent from the filter ports into a biological waste container.
- Load a new 5 ml syringe with 4 ml of a phenol and guanidine isothiocyanate solution for RNA isolation and attach it to the inlet of the filter, depress the plunger to flush the solution through the filter, collecting the lysate in a labeled 15 ml conical tube (2 per participant).
- Disconnect the syringe from the filter, retract the plunger, re-attach it to the filter, and depress the plunger to expel residual sample trapped in the filter disk into the same 15 ml conical tube. Discard filter and syringe.
- Add 800 µl BCP to the conical tube, close the tube tightly and vigorously shake the prep for 30 sec.
- Incubate at RT for 5 min. Centrifuge for 10 min at 2,000 x g.
- Transfer the aqueous (top) phase to a freshly labeled 15 ml conical tube (~2.5 ml).
- Add 0.5 times the volume of the aqueous phase of nuclease-free water and mix well. Then add 1.25x the aqueous volume of 100% ethanol and mix again.
Note: For a 2.5 ml aqueous volume, add 1.25 ml of nuclease free water, mix, then add 4.7 ml of 100% ethanol (2.5 ml x 0.5 = 1.25 ml nuclease free water THEN 2.5 ml + 1.25 ml = 3.75 ml new aqueous volume THEN 3.75 ml x 1.25 = 4.7 ml 100% ethanol). This step allows for isolation of total RNA that includes the small RNA fraction. A method to omit the small RNAs from the isolation can be found in the manual17. - Remove the plunger from a 5 ml syringe and insert a spin cartridge in its place. Attach the cartridge/syringe assembly to a vacuum manifold. For a more secure connection to the vacuum manifold, place the cartridge/syringe assembly inside a 1.5 ml microcentrifuge tube with the bottom cut off.
- Apply the sample from step 5.3.8 to the spin cartridge slowly with the vacuum on, carefully adding more sample as it is pulled through the cartridge.
Note: If no vacuum is present, see centrifugation method at http://www.ambion.com/techlib/misc/leuko_iso.pdf. - Transfer the spin cartridge to a 1.5 ml microcentrifuge tube and add 750 µl of Wash 1. Centrifuge the spin cartridge/tube assembly 5 – 10 sec at 12,000 x g.
- Discard filtrate from the tube and return the spin cartridge to the same microcentrifuge tube.
- Add 750 µl of Wash 2 and centrifuge the spin cartridge/tube for 5 – 10 sec at 12,000 x g. Discard filtrate as in step 5.3.12. Return the spin cartridge to the same microcentrifuge tube.
- Repeat with another 750 µl of Wash 2 and centrifugation as in step 5.3.13. Discard filtrate. Return the spin cartridge to the same microcentrifuge tube. Centrifuge the spin cartridge/tube at maximum speed for 1 min to dry the filter.
- Transfer the spin cartridge to a fresh, labeled 1.5 µl microcentrifuge tube.
- Add 200 µl of nuclease-free 0.1 mM EDTA (preheated to 80 °C) to the center of the spin cartridge filter (2 per participant). Incubate at RT for 1 min.
- Centrifuge for 1 min at 12,000 x g to elute the RNA. Retain the filtrate. Discard spin cartridge.
- Split each 200 µl filtrate into two, 100 µl aliquots into fresh 1.5 ml microcentrifuge tubes, label and keep on ice. At this point, starting with 2 filters per participant will yield four 100 µl aliquots of RNA per participant.
- DNase treatment (1 hr)
Note: For further details on this treatment see the manufacturer's protocol18.- Create a master mix by combining 10 µl of DNase I Buffer and 2 µl rDNase I per aliquot + 1 (to account for pipetting error).
Note: For four samples, 100 µl aliquots use 50 µl DNase I Buffer + 10 µl rDNase I. - Aliquot 12 µl of the master mix in step 5.4.1 into each of the RNA aliquots from step 5.3.18 and mix gently. Incubate at 37 °C for 30 min in a heat block.
- Vortex the DNase Inactivation Reagent and add 11.2 µl to each aliquot, mix well. Incubate at RT for 2 min vortexing 2-3 times during incubation.
- Centrifuge at 10,000 x g for 1.5 min.
- Transfer the supernatant (RNA) to a fresh 1.5 ml tube. Aliquots from the same participant can be pooled here.
- Run each sample on a spectrophotometer to get the concentration. A quality analysis of the RNA is recommended using a Bioanalyzer (see step 5.5).
- Aliquot the RNA into cryovials as desired. If a Bioanalyzer analysis will not be performed immediately, aliquot 1.5 µl of sample into a microcentrifuge tube for later analysis. Document the concentrations and the freezer start time. Store samples at -80 °C.
- Create a master mix by combining 10 µl of DNase I Buffer and 2 µl rDNase I per aliquot + 1 (to account for pipetting error).
- Bioanalyzer analysis (1 hr)
- Follow the manufacturer's protocol19. When the run is complete, the data is automatically stored, but save it again with a smaller, more recognizable file name. Expected results (Figure 3): the ladder should have 6 peaks, samples should have 3 peaks (2 ribosomal peaks at 44 sec and 50 sec, respectively and 1 early marker peak at 25 sec).
Access restricted. Please log in or start a trial to view this content.
Results
It is essential that the overall procedure produce high quality material for analysis in a multitude of downstream applications including gene expression via microarray and RT-PCR analysis, detection of epigenetic modifications, and cell subset variations. Table 1 indicates the average yield and quality of materials from each of the processes. Figure 3 provides an example of the quality output of the leukocyte RNA isolation and filter processing methods. The image on the upper left of
Access restricted. Please log in or start a trial to view this content.
Discussion
We have described a streamlined protocol that has been successfully applied to process more than 1,600 whole blood samples in the Detroit Neighborhood Health Study. Although many of these techniques are available in the existing literature, our step-by-step compilation, including precisely timed alterations between each step, reflects an optimized, efficient protocol that successfully produces a variety of biologic specimens with a wide range of downstream applications, including DNA methylation, mRNA expression and immu...
Access restricted. Please log in or start a trial to view this content.
Disclosures
The authors declare that they have no competing interests.
Acknowledgements
We would like to thank Henriette Mair-Meijers for invaluable attention to detail and hours devoted to processing the blood collections. We are grateful for the graphic design expertise of Natalie Jameson Kiesling. We also appreciate the approval of the manufacturers (Qiagen (Valencia, CA), BD Biosciences (San Jose, CA), Life Technologies (Grand Island, NY)) mentioned herein to publish the use of their products as described. Funding for this work was generously provided by the National Institutes of Health award numbers DA022720, RC1MH088283, and DA022720-05-S1.
Access restricted. Please log in or start a trial to view this content.
Materials
| Name | Company | Catalog Number | Comments |
|---|---|---|---|
| QIAamp DNA Blood Mini Kit | Qiagen | 51104 | Day 1: DNA isolation |
| Phosphate-buffered saline (PBS) | Sigma | P5493-1L | Day 1: PBMC isolation |
| 5 ¾” Pasteur pipets | Fisher | 13-678-6A | Day 1: PBMC isolation |
| Fetal Bovine Serum (FBS), heat inactivated | Life Technologies | 10082147 | Day 1: PBMC isolation |
| Dimethyl Sulfoxide (DMSO) | Sigma | D8418-500ml | Day 1: PBMC isolation |
| RPMI Medium 1640, liquid | Invitrogen | 11875119 | Day 1: PBMC isolation |
| 0.4% trypan blue stain | Invitrogen | T10282 | Day 1: PBMC isolation |
| Countess Cell Counting Chamber | Invitrogen | C10283 | Day 1: PBMC isolation |
| Countess Automated Cell Counter or cell counting device such as a microscope and hemocytometer | Invitrogen | C10281 | Day 1: PBMC isolation |
| LeukoLOCK Fractionation & Stabilization Kit | Ambion | 1933 | Day 1: Leukocyte RNA isolation |
| 25 G x 5/8 in. needles | Becton Dickinson | 305122 | Day 1: Leukocyte RNA isolation |
| Syringes (5 ml) | Becton Dickinson | 309646 | Days 1 and 2: Leukocyte RNA isolation |
| Denaturing Lysis Solution | Ambion | 8540G | Day 2: Leukocyte RNA isolation |
| 5 M NaCl | Life Technologies | 24740011 | Day 2: Leukocyte RNA isolation |
| TRI Reagent | Ambion | 9738 | Day 2: Leukocyte RNA isolation |
| Bromo-3-chloro-propane (BCP) | Sigma | B-9673 | Day 2: Leukocyte RNA isolation |
| spin cartridges | Ambion | 10051G | Day 2: Leukocyte RNA isolation |
| 0.1 mM EDTA | Ambion | 9912 | Day 2: Leukocyte RNA isolation |
| DNA-free Kit | Ambion | AM1960 | Day 2: DNase treament |
| RNA 6000 Ladder | Agilent | 5067-1529 | Day 2: Bioanalyzer analysis |
| RNA 6000 Nano Series II Kit | Agilent | 5067-1511 | Day 2: Bioanalyzer analysis |
| RNaseZAP | Ambion | AM8782 | Day 2: Bioanalyzer analysis |
| Ethanol >99% | Sigma | E7023-500ml | |
| Isopropanol >99% | Sigma | I9516-500ml | |
| Nuclease-free ultra pure water | Invitrogen | 9938 | |
| Pipette tips (nuclease-free) | Eppendorf | 22491253 | |
| Pipetter (serological) | Eppendorf | 2223020-4 | |
| Pipetters (for volumes under 1 ml) | Eppendorf | 3120000-054 | |
| Pipettes (serological) | Fisher | 13-678-27E | |
| Controlled rate freezing containers | Nalgene | 5100-0001 | |
| Cryoboxes (to hold 2 ml and 5 ml cryovials and 1.5 ml microcentrifuge tubes) | Fisher | 03-395-464 | |
| Test tube rack | Thermo Scientific | 14-804-134 | |
| 15 ml polypropylene tubes | Fisher | 14-959-49D | |
| 1.5 ml and 0.65 microcentrifuge tubes | Fisher | 07-200-534 and 07-200-185 | |
| 2 ml and 5 ml cryovials | Fisher | 10-500-26 and 10-269-88F | |
| 8 ml CPT vacutainer | BD Biosciences | 362761 | 2 tubes |
| 6 ml K2 EDTA vacutainer | BD Biosciences | 367863 | 2 tubes |
| 8.5 ml SST vacutainer | BD Biosciences | 367988 | 1 tube |
| Vortexer | Fisher | 2215365 | |
| Dry bath incubator with heating block for microcentrifuge tubes | Fisher | 11-715-1250 | |
| Filtration/vacuum system for use within the cell culture hood | Fisher | 01-257-87 | |
| Fixed-angle rotor for microcentrifuge tubes with aerosol-tight lid | Eppendorf | 22637002 | |
| Refrigerated centrifuge with a swing-bucket rotor and aerosol-tight caps for 16 x 125 mm vacutainers and 15 ml polypropylene tubes | Eppendorf | 22628157 | 2, one does not need to be refrigerated |
| Nanodrop 2000 (recommended for accuracy of small volumes) or other spectrophotometric device | Fisher | 13-400-411 | |
| Agilent Bioanalyzer | Agilent Technologies | G2940CA | |
| Liquid nitrogen tank | Thermo Scientific | 11-676-56 | |
| Sharps container | Fisher | 22-037-970 | |
| Biological waste container | Thermo Scientific | 1223P52 | |
| Biosafety Level 2 certified cell culture hood | Thermo Scientific | 13-261-315 |
References
- Hernandez, M. E., Martinez-Fong, D., Perez-Tapia, M., Estrada-Garcia, I., Estrada-Parra, S., Pavon, L. Evaluation of the effect of selective serotonin-reuptake inhibitors on lymphocyte subsets in patients with a major depressive disorder. Eur Neuropsychopharmacol. 20, 88-95 (2010).
- Weigelt, K., et al. TREM-1 and DAP12 expression in monocytes of patients with severe psychiatric disorders EGR3, ATF3 and PU.1 as important transcription factors. Brain Behav Immun. 25, 1162-1169 (2011).
- Robertson, M. J., et al. Lymphocyte subset differences in patients with chronic fatigue syndrome, multiple sclerosis and major depression. Clin Exp Immunol. 141, 326-332 (2005).
- Rotter, A., Asemann, R., Decker, A., Kornhuber, J., Biermann, T. Orexin expression and promoter-methylation in peripheral blood of patients suffering from major depressive disorder. J Affect Disord. 131, 186-192 (2011).
- Klengel, T., et al. Allele-specific FKBP5 DNA demethylation mediates gene-childhood trauma interactions. Nat Neurosci. 16, 33-41 (2013).
- Segman, R. H., Shefi, N., Goltser-Dubner, T., Friedman, N., Kaminski, N., Shalev, A. Y. Peripheral blood mononuclear cell gene expression profiles identify emergent post-traumatic stress disorder among trauma survivors. Mol Psychiatry. 10, 500-513 (2005).
- Smith, B. H., et al. Cohort Profile: Generation Scotland: Scottish Family Health Study (GS:SFHS). The study, its participants and their potential for genetic research on health and illness. Int J Epidemiol. 42, 689-700 (2013).
- Mallone, R., et al. Isolation and preservation of peripheral blood mononuclear cells for analysis of islet antigen-reactive T cell responses: position statement of the T-Cell Workshop Committee of the Immunology of Diabetes Society. Clin Exp Immunol. 163, 33-49 (2011).
- Duvigneau, J. C., Hartl, R. T., Teinfalt, M., Gemeiner, M. Delay in processing porcine whole blood affects cytokine expression. J Immunol Methods. 272, 11-21 (2003).
- Debey, S., et al. Comparison of different isolation techniques prior gene expression profiling of blood derived cells: impact on physiological responses, on overall expression and the role of different cell types. Pharmacogenomics J. 4, 193-207 (2004).
- Uddin, M., et al. Epigenetic and immune function profiles associated with posttraumatic stress disorder. Proc Natl Acad Sci U S A. 107, 9470-9475 (2010).
- Kessler, R. C., Wang, P. S. The descriptive epidemiology of commonly occurring mental disorders in the United States. Annu Rev Public Health. 29, 115-129 (2008).
- Qiagen. QIAamp® DNA Mini and Blood Mini Handbook. , Valencia, California, USA. Available from: https://www.qiagen.com/us/resources/resourcedetail?id=67893a91-946f-49b5-8033-394fa5d752ea (2010).
- Thermo Scientific. NanoDrop 1000 Spectrophotometer. , Waltham, Massachusetts, USA. Available from: http://www.nanodrop.com/Library/nd-1000-v3.8-users-manual-8 (2010).
- Life Technologies. LeukoLOCK™ Total RNA Isolation System. , Grand Island, New York, USA. Available from: http://www.ambion.com/techlib/misc/leuko_iso.pdf (2011).
- Life Technologies. Countess™ Automated Cell Counter. , Grand Island, New York, USA. Available from: http://www.lifetechnologies.com/content/dam/LifeTech/migration/files/cell-analysis/pdfs.par.5257.file.dat/mp10227-countess (2009).
- Life Technologies. Alternative Protocol for Extraction of RNA from Cells Captured on LeukoLOCK™ Filters Using TRI Reagent®. , Grand Island, New York, USA. Available from: http://www.lifetechnologies.com/us/en/home/references/protocols/nucleic-acid-purification-and-analysis/rna-protocol/alternative-protocol-extraction-of-rna-from-cells-captured-on-leukolock-filters-using-tri-reagent.html (2011).
- Life Technologies. DNA-free™ Kit. , Grand Island, New York, USA. Available from: http://tools.lifetechnologies.com/content/sfs/manuals/cms_055739.pdf (2012).
- Agilent Technologies. Agilent RNA 6000 Nano Kit Guide. , Santa Clara, California, USA. Available from: http://www.genomics.agilent.com/files/Manual/G2938-90034_KitRNA6000Nano_ebook.pdf (2006).
- Koenen, K. C., et al. SLC6A4 methylation modifies the effect of the number of traumatic events on risk for posttraumatic stress disorder. Depress Anxiety. 28, 639-647 (2011).
- Walsh, K., Uddin, M., Soliven, R., Wildman, D. E., Bradley, B. Associations between the SS variant of 5-HTTLPR and PTSD among adults with histories of childhood emotional abuse: Results from two African American independent samples. J Affect Disord. 161, 91-96 (2014).
- Bustamante, A. C., et al. Childhood maltreatment is associated with epigenetic differences in hypothalamic-pituitary-adrenal (HPA) axis genes in the Detroit Neighborhood Health Study. American Association of Physical Anthropologists 82nd Annual Meeting, Knoxville, TN, , Comprehensive Psychiatry. (2013).
- Sipahi, L., et al. Longitudinal epigenetic variation of DNA methyltransferase genes is associated with vulnerability to post-traumatic stress disorder. Psychol Med. 44, 3165-3179 (2014).
- Uddin, M., Koenen, K. C., Aiello, A. E., Wildman, D., de los Santos, R., Galea, S. Epigenetic and inflammatory marker profiles associated with depression in a community-based epidemiologic sample. Psychol Med. 41, 997-1007 (2011).
- Uddin, M., et al. Post-traumatic stress disorder is associated with immunosenescent T cell phenotypes in the Detroit Neighborhood Health Study. 3rd North American Congress of Epidemiology, Montreal, QC, , (2011).
- Uddin, M., et al. Post-traumatic stress disorder is associated with immunosenescent T cell phenotypes in the Detroit Neighborhood Health Study. 101st Annual Conference of the American Psychopathological Association, New York, NY, , (2011).
- Uddin, M. Biological signatures of post-traumatic stress disorder in the Detroit Neighborhood Health Study. 9th International Conference on Urban Health, New York Academy of Medicine, , (2010).
- Aiello, A. E. Cytomegalovirus antibodies as a marker of immunosenescence in the Detroit Neighborhood Health Study. 9th International Conference on Urban Health, New York Academy of Medicine, , (2010).
- Bustamante, A. C., et al. Distinct gene expression profiles characterize lifetime PTSD and childhood maltreatment in the Detroit Neighborhood Health Study. , International Society for Traumatic Stress Studies. Philadelphia, PA. (2013).
Access restricted. Please log in or start a trial to view this content.
Reprints and Permissions
