A protocol is provided to select structure-switching aptamers for small molecule targets based on a tunable stringency magnetic bead selection method. Aptamers selected with structure-switching properties are beneficial for assays that require a conformational change to signal the presence of a target, such as the described gold nanoparticle assay.
Method Article
A Method for Selecting Structure-switching Aptamers Applied to a Colorimetric Gold Nanoparticle Assay
In This Article
Summary
Abstract
Small molecules provide rich targets for biosensing applications due to their physiological implications as biomarkers of various aspects of human health and performance. Nucleic acid aptamers have been increasingly applied as recognition elements on biosensor platforms, but selecting aptamers toward small molecule targets requires special design considerations. This work describes modification and critical steps of a method designed to select structure-switching aptamers to small molecule targets. Binding sequences from a DNA library hybridized to complementary DNA capture probes on magnetic beads are separated from nonbinders via a target-induced change in conformation. This method is advantageous because sequences binding the support matrix (beads) will not be further amplified, and it does not require immobilization of the target molecule. However, the melting temperature of the capture probe and library is kept at or slightly above RT, such that sequences that dehybridize based on thermodynamics will also be present in the supernatant solution. This effectively limits the partitioning efficiency (ability to separate target binding sequences from nonbinders), and therefore many selection rounds will be required to remove background sequences. The reported method differs from previous structure-switching aptamer selections due to implementation of negative selection steps, simplified enrichment monitoring, and extension of the length of the capture probe following selection enrichment to provide enhanced stringency. The selected structure-switching aptamers are advantageous in a gold nanoparticle assay platform that reports the presence of a target molecule by the conformational change of the aptamer. The gold nanoparticle assay was applied because it provides a simple, rapid colorimetric readout that is beneficial in a clinical or deployed environment. Design and optimization considerations are presented for the assay as proof-of-principle work in buffer to provide a foundation for further extension of the work toward small molecule biosensing in physiological fluids.
Introduction
Small molecules have long been recognized as playing vital roles in diverse biological processes such as physiological toxicity or nutrition, cell signaling, and as pharmaceutical treatments to disease1. Various small molecules have also been suggested as biomarkers indicative of physiological conditions including stress2,3, fatigue4, and disease5. For example, elevated cortisol levels correlate with stress which may result in decreased physiological performance and other health conditions6-8. Likewise, variations in the ratios of certain peptides in saliva are predictive of fatigue, where physiological manifestations include lack of concentration, impaired reaction time, and reduced cognitive function4. Therefore, the development of target-specific biosensors to monitor the levels of small molecules may provide an invaluable metric for assessing the health and performance capabilities of an individual.
Historically, small molecule detection has been performed by labor-intensive separation techniques or by antibody based recognition6,7. More recently, nucleic acid aptamers9,10 have emerged as recognition elements that possess distinct advantages over antibodies in specific applications. With their ability to bind a target varying in size from metal ions11 to tissues12, aptamers have been widely applied as recognition elements in biosensing platforms13,14. Compared to antibodies, aptamers are chemically synthesized, and it is therefore simple to introduce reproducible chemical modifications for surface immobilization or reporting. Aptamers can be selected with high target specificity under the desired conditions by modifying the selection conditions used, whereas antibodies are limited to physiological conditions15,16. In addition, aptamers are capable of higher ligand density due to their smaller size, resulting in higher target signaling efficiency on a biosensor platform, and the enhanced stability of aptamers allows for repeated use and long-term sensor storage16.
Aptamers are generated using a procedure known as SELEX, wherein an initial library of sequences is evolved from 1013-1015 unique molecules to an enriched final pool containing several (101-102) sequences with potential to bind the target molecule. The final enriched pool is then sequenced, and the dissociation constants (Kd) are obtained from binding assays of the highest copy number sequences with the target molecule. Evolution of the pool to a final enriched population is tracked by monitoring the percentage of the pool binding the target in each round, until maximal enrichment is obtained. This takes place over a number of evolutionary rounds, where binding sequences are partitioned from nonbinders and amplified using the polymerase chain reaction (PCR). The ability to effectively partition and retain binders is one of the main determinants of the efficiency of selection and directly impacts the characteristics of the selected aptamers15. The SELEX partitioning stage is more challenging for small molecules since they do not possess the size or variety of functional groups that aid the partitioning process of protein targets1,15. For example, many protein partitioning platforms rely on size or charge-based separation, however the properties of bound DNA-small molecule target complexes are generally not significantly different than that of nonbinding sequences, resulting in ineffective partitioning1. Alternative SELEX partitioning methods may involve immobilization or labeling of the target, which potentially alter the binding characteristics of a small molecule. Consequently, design of a selection procedure to generate aptamers for small molecule targets requires special consideration.
A variety of modifications have been applied to the original SELEX methodology to enhance the partitioning efficiency of the procedure, improve the affinity or specificity of the sequences in the final pool, or make it more amenable to different applications15,16. One SELEX modification capable of selecting for small molecules was designed to generate structure-switching aptamers, or aptamers that undergo a conformational change upon interacting with the target molecule17,18. In one example of this method, the library is hybridized to a short piece of nonbinding complementary DNA (cDNA) immobilized on magnetic beads17. Upon target binding, the conformational change of binding sequences enables them to dehybridize from the cDNA, releasing them into the supernatant solution, while the nonbinders remaining hybridized to the cDNA/beads are magnetically partitioned and discarded. This method is advantageous for small molecules because it does not require immobilization or labeling of the target molecule to achieve separation.
Aptamers that are capable of structure-switching possess a valuable feature for any potential biosensor platform that requires a change in aptamer structure to detect the presence of a target molecule. Specifically, aptamers can be combined with gold nanoparticles (AuNPs) to create assays that function based on the structure-switching principle to produce a colorimetric response in the presence of target molecule after salt challenge19,20. In an AuNP assay, the single-stranded DNA (ssDNA) aptamer initially adsorbs to the AuNP surface and protects it from salt challenge. The presence of the target induces a conformational change in the aptamer that exposes the AuNP surface, resulting in a red-to-blue color change following salt addition. AuNP assays have also been shown to amplify signal, where micromolar affinity aptamers can detect target at levels orders of magnitude lower than the dissociation constant (Kd)21. This feature is especially attractive for small molecule targets, where affinities typically range from low micromolar to millimolar concentrations1,15. Generally, the assay is also rapid and relatively simple to perform, encouraging further study of aptamer-AuNP assays as biosensor detection platforms.
The goal of this work is to provide a universal protocol for selecting structure-switching aptamers to small molecules for biosensing applications using the stress marker cortisol as a representative molecule. An AuNP biosensor detection scheme is of interest due to its simplicity of operation and colorimetric readout, but structure-switching aptamers are applicable to alternative sensing platform outputs, such as electrochemical22 or fluorescence23 that also provide detection via a change in aptamer conformation upon target binding. Compared to previous methods, multiple negative selection steps were incorporated into the design17,18, and a simple UV-based enrichment detection scheme was implemented (Figure 1). This protocol is in contrast with the radioligand enrichment detection scheme used in legacy methods17. The proposed method also incorporated an increase in the length of the cDNA capture probes used in the selection to increase the partitioning efficiency and effectively tune the stringency of the selection after maximal enrichment was observed24. The tuned stringency lead to a lower total percentage of DNA eluted by the target in the final pool, but resulted in higher copy numbers of a sequence that bound with enhanced affinity compared to the highest copy number sequence from an earlier round. The highest copy number sequence from the final pool was applied to an AuNP assay to illustrate that the sequence was amenable to a platform that requires a structural change to indicate target binding. This buffer based assay shows that the response of the AuNP assay can be modified by changing the density of DNA applied to the surface, and serves as proof-of-principle work to devote future research efforts toward developing small molecule aptamer-based AuNP biosensors in physiological fluids.
Protocol
1. Library and Primer Design and Synthesis
- Design the initial library and primers (this topic has been reviewed extensively in previous publications)25,26.
- Synthesize the following sequences for this study using standard phosphoramidite chemistry:
Library: GAATGGATCCACATCCATGG-N40-TTCACTGCAGACTTGACGAAGCTTGACGAA
Forward Primer: GGAATGGATCCACATCCATGG
Reverse Primer: Biotin-AAGCTTCGTCAAGTCTGCAGTGAA - Design the cDNA capture probes to be complementary to the 5´ region of the library. Choose the initial length by analysis of online melting temperature software to provide a melting temperature slightly above RT, with each subsequent base supplying an increased melting temperature.
mer Capture Probe: CCATTCC-Biotin
mer Capture Probe: TCCATTCC-Biotin
mer Capture Probe: ATCCATTCC-Biotin
- Synthesize the following sequences for this study using standard phosphoramidite chemistry:
- Purify the library by standard HPLC. Desalting is sufficient for the primers and capture probes. Reconstitute oligonucleotides in nuclease free water at the desired concentration and store at -20 °C for up to several months.
2. Buffer, Library, and Sample Preparation
- Prepare 500 ml of buffer in Millipore or nuclease-free grade water with concentrations of 50 mM Tris, 137 mM NaCl, 5 mM MgCl2, pH 7.4. Filter the buffer through a sterile 0.2 µm membrane; storage is possible at ambient conditions for months.
- Alternatively, use other buffers such as PBS (phosphate buffered saline), HEPES (4-(2-hydroxyethyl)-1-piperazineethanesulfonic acid), etc.
- Set up two thermomixers; set one to 95 °C and keep the other at ambient conditions (~20 °C in this work). Prepare an ice bucket.
- Heat/snap cool the DNA library by placing 100 µl library (~2.5 nmol for 1015-1016 sequences) in the thermomixer set at 95 °C for 5 min. Place the tube on ice while the magnetic beads are prepared (sections 3.1-3.6). Determine the actual concentration of the DNA library by UV absorption at λ = 260 nm and applying the appropriate conversion factor for the library.
- Prepare the target stock solutions in a medium appropriate for the target solubility.
- Prepare 100 mM analyte stocks in DMSO. These stocks are viable for approximately 1 month when stored at ambient conditions, but different targets will demonstrate different degradation profiles.
3. Preparation of Magnetic Beads and Initial Round of Selection
- Vortex 6.7 x 10⁸ beads/ml streptavidin-coated magnetic beads and remove 400 µl to a new microcentrifuge tube. Place the tube on the magnet for 2 min and remove the supernatant.
- Wash the beads by adding 400 µl of binding buffer, vortexing, and aspirating the supernatant after placing the tube on the magnet to separate the beads. Repeat this process three times.
- Immobilize the capture probe on the magnetic beads by resuspending the beads in 400 µl binding buffer with 50 µM (final) capture probe and incubating for 10 min with gentle agitation on the thermomixer at ambient conditions.
- Wash the beads three times with 400 µl of binding buffer by repeating the wash steps described in section 3.2 to remove free capture probe.
- Resuspend the beads in 400 µl of binding buffer. Remove 100 µl of the bead solution for the next steps, and retain the remaining 300 µl at 4 °C to use for further selection rounds for a maximum of three weeks.
- Wash the beads twice with 200 µl of binding buffer as described in section 3.2.
- Add the 100 µl of snap cooled DNA from section 2.3 to the washed beads and incubate for 30 min with gentle agitation using the thermomixer at ambient conditions.
NOTE: The DNA concentrations in the first rounds are higher than that of subsequent rounds to minimize sequence loss in earlier rounds where unique sequences are theoretically present. - Quantitate the DNA in the supernatant using UV absorption as in section 2.3 and subtract this from the initial amount added in section 3.7 to assess the amount of DNA bound to the beads.
- Wash the beads with 200 µl binding buffer followed by two additional washes with 200 µl binding buffer with gentle agitation on a thermomixer for 5 min at ambient conditions.
- Resuspend the beads in 200 µl of 100 µM target diluted in binding buffer, and rotate on the thermomixer for 30 min at ambient conditions. Prepare the working solutions fresh at the beginning of each day prior to selection because the target and control were observed to aggregate out of aqueous solution over time. Retain the supernatant solution which contains the target-eluted sequences for further study.
- Perform the negative selection after the completion of 1-2 rounds by adding 200 µl of 1 µM progesterone to the beads prepared in section 3.8.1. Shake gently for 30 min on the thermomixer at ambient conditions.
- Use the magnetic stand to capture the beads and discard the supernatant, washing the beads twice in 200 µl of binding buffer prior to cortisol addition as in section 3.9.
4. Enrichment Monitoring, PCR, and Single-stranded DNA Generation
- Add the supernatant solution to a dialysis cassette to monitor selection enrichment. Dialysis is necessary to remove cortisol from the eluted DNA because cortisol is present in much higher concentrations than the DNA, and also has a UV absorption peak that overlaps the standard DNA UV λmax = 260 nm.
- Perform this step every other round (rounds 2, 4, 6, & 8) in the early rounds of selection. This mitigates sample loss when potentially few copy numbers of each sequence are present (highest diversity). For faster results, alternative methods such as size exclusion columns may be utilized as well.
- Dialyze cassette with sample in fresh 250 ml of binding buffer for 2 hr at ambient conditions twice. Replace buffer and incubate at 4 °C O/N.
- Analyze the dialyzed pool by UV spectroscopy to determine the percentage of DNA eluted by the target (compare to results of section 3.8).
- Prepare a 3% agarose gel with 1% w/v ethidium bromide. In this work, prepare a gel from 1.5 g of agarose, 50 ml of TAE buffer (40 mM Tris Acetate, 1 mM EDTA, pH = 8.0), and 10 µl of ethidium bromide.
- Cycle-optimize the dialyzed pool by performing a small scale PCR (5 x 50 µl aliquots) using ~5-15 cycles. For the PCR components, use 1x PCR reaction buffer (all final concentrations), 200 µM dNTPs, 10% reaction volume of DNA template, 500 nM each primer, and 2.5 U polymerase (2.5 U/µl stock).
- Run PCR using optimized conditions at 95 °C for 2 min, followed by repeated cycles of 95 °C (30 sec), 55 °C (30 sec), and 72 °C (1 min), then a 72 °C (10 min) final extension and hold at 4 °C.
- Employ a 25 bp standard ladder for comparison and visualize on a gel imager. Select the number of cycles that produces the highest intensity band at the correct size marker without unwanted by-products.
- Analyze the results of the cycle optimization by combining 10 µl of each PCR cycle with 2 µl of 6x Blue/Orange loading dye, and loading into 5 separate wells of the 3% agarose gel prepared in step 4.4 (125 V for 45 min).
- Perform a large scale PCR utilizing the conditions and appropriate cycle number determined in section 4.5. Typically 6-8 ml of PCR reactions were required to obtain the 1-2.5 nmol used for each round in this selection. Use 8-strip tubes to simplify handling of the many tubes required to aliquot this volume for PCR amplification.
- Prepare a 3% agarose gel as described in section 4.4, and validate that the PCR product band appears at the correct location following the steps of sections 4.5.2-4.5.3.
- Convert the entire double-stranded DNA product from section 4.7 to single-stranded DNA by the steps outlined below:
- Add 300 µl of streptavidin-coated beads (not magnetic) to a small column blocked by frits. Wash the beads with 5 ml binding buffer by attaching a luer-lock syringe and applying gentle pressure to the plunger. Remove the syringe from the column and remove the plunger from the syringe off-line after the addition of each material so the beads are not disturbed by plunger aspiration.
- Add the PCR product and pass it through the column using gentle pressure on the plunger. Use several columns such that no more than 1-1.2 ml of PCR product is added to each column. Discard the final flow through since the DNA will be retained on the column by the biotin moiety on the anti-sense strand.
- Wash the column with 5 ml binding buffer.
- Dehybridize the DNA by adding 0.5 ml of 0.2 M NaOH. Retain the eluate as it contains the single stranded sense DNA.
- Desalt the ssDNA in 0.2 M NaOH by adding the 0.5 ml to a desalting column prepared by a wash with nuclease free water. Discard the initial 0.5 ml fluid, then add 1 ml nuclease free water and collect this desalted ssDNA sample. The use of multiple desalting columns will be required for each 0.5 ml portion.
- Determine the concentration of DNA eluted by UV absorption at λ = 260 nm.
- Vacuum dry the sample and reconstitute in an appropriate volume of binding buffer. If there was not enough DNA obtained for the next round of selection, repeat sections 4.6-4.9.2.
5. Subsequent Rounds of Selection and Sequencing
- Adjust the stringency of the selection conditions depending on the results of the enrichment monitoring (section 4.1). Generally, make conditions more stringent in successive selection rounds in order to select the highest affinity binder from the pool.
NOTE: This could involve a combination of increasing the DNA concentration, increasing the number, time, or volume of the wash steps, decreasing the target concentration, increasing the concentration of the negative-selection compound, or a variety of other methods27.- Apply proper controls as appropriate to ensure the specificity of the sequences for the target molecule. In this work, apply a negative selection molecule (progesterone) to the system (Table 1) beginning in round 3 and increasing in concentration throughout the selection. Starting in round 11, pre-incubate the DNA pool for 30 min with 10-20 µM progesterone prior to immobilization on the beads (before section 3.7).
- Increase the length of the capture probe after maximal enrichment is observed.
- Prepare the final pool (round 15) and other pools representing maximally enriched (round 13) and minimally enriched (round 6) conditions for sequencing by PCR amplification with compatible primers and a high fidelity polymerase.
- Set up a 50 µl reaction volume using final concentrations of 1x (reaction buffer), 200 µM (each dNTP), 400 nM (each primer), 0.5 µl of DNA pool, and 0.5 µl of polymerase. Cycle optimize for each round using the steps outlined in section 4.5 using the same PCR conditions with the exception of a 7 min hold at 72 °C for the final extension.
- Send 50 µl of the prepared pools to a sequencing facility in microcentrifuge tubes with caps thoroughly sealed with non-adhesive wrap. Place the tubes in a 15 ml conical tube packed with bubble wrap and ship O/N with ice packs to the sequencing facility.
- Determine the copy number of each sequence to assess the enrichment of the sequenced pool(s).
- Use code-writing/sorting steps (See Supplementary Code File) for next-generation sequencing data in FASTA format to determine the frequency/copy numbers of each sequence repeated in the data for all pools supplied by the sequencing facility:
- Analyze the specificity and affinity of the highest copy number sequences. The type of interaction (protein or small molecule), structural properties of the aptamer upon binding, and expected affinity will dictate which method is appropriate. This topic is reviewed in further detail in a number of references1,28-30.
6. AuNP Synthesis and Detection
- Synthesize the AuNPs using the citrate reduction method21. Mix 98 ml of Millipore water with 2 ml of 50 mM HAuCl4 and heat to boiling.
- Add 10 ml of 38.8 mM sodium citrate as soon as reflux begins. Color will change to a red color after several minutes. Continue stirring the solution for 20 min with the heat off.
- Allow the AuNP solution to cool to RT then filter through a 0.2 µm polyester membrane. Store all AuNP suspensions in a dark amber bottle.
- Calculate the AuNP concentration by UV absorption, using the extinction coefficient of 2.4 x 10⁸ L mol-1 cm-1 31. The concentration was 10 nM in this work, with a size of 17 ± 0.6 nm determined by dynamic light scattering21.
- Incubate the DNA with 10 nM AuNP for 1 hr at ambient conditions protected by aluminum foil. Vary the volume of AuNP to provide enough solution to allow all desired tests to be performed (~1-2 ml). Loading densities of 73, 120, and 200 D/NP (DNA molecules per AuNP) were examined in this work, and the volume and concentrations will vary accordingly.
- Dilute the DNA/AuNP solution 1:1 using HEPES buffer (20 mM HEPES, 2 mM MgCl2, pH = 7.4). Allow the mixture to equilibrate at RT covered by aluminum foil.
NOTE: The time required for this step will need to be optimized by the researcher. In this work, times ranging from several minutes to O/N were investigated. - Prepare analyte (cortisol, cholic acid, 2-methoxynaphthalene) stock solutions at 100 mM in DMSO and cover with aluminum foil. Make fresh initial solutions prior to each experiment by dilution of the stock to 100 µM in a 1/3 dilution of the cortisol binding buffer (section 2.1). Further dilute the initial solution with the 1/3 binding buffer such that a constant volume (10 µl) of target is added to generate a range of concentrations.
- Optimize the salt concentration required by adding 80 µl of the DNA/AuNP solution with 10 µl of 1/3 binding buffer (referred to as the “blank”).
- Incubate for 20 min at RT then add different volumes of NaCl solution. Look for the volume of salt that induces a barely visually noticeable change toward a blue hue after salt addition (13-40 µl of 1 M NaCl used in this work). This provides a good starting point, but may need further adjustment following the results including target addition.
- Combine 80 µl of the DNA/AuNP solution with 10 µl of the target solution and incubate for 20 min at RT. Utilize a 96-well plate and multichannel pipette to analyze multiple target concentrations simultaneously, always including a blank (section 6.8).
- Add the appropriate volume of NaCl solution (13 µl of 1 M NaCl was applied in this work) and immediately analyze the absorbance at 650 and 530 nm using a plate reader.
- Plot the results as the ratio of absorbance values (E650/E530) versus target concentration normalized relative to the blank measurement.
Results
The stringency of the conditions was initially kept low to retain binders present in low copy numbers in the first several rounds. The first round, in particular, implemented the lowest stringency to preserve binders typically presented as unique sequences, demonstrated by the high cortisol and DNA concentrations, and the lack of negative selection steps. The success of this aptamer selection is demonstrated by the evolution of the pools from a low percentage eluted by the target (round 2) to a higher fraction eluted by the target that remains relatively constant in rounds 12-13 (Table 1). This plateau of DNA eluted by the target is traditionally an endpoint in the selection (“enrichment”). However, this method further raised the stringency of the selection after enrichment by increasing the length of the cDNA capture probe (Figure 1). Lengthening this probe increases the strength of the hybridization between the cDNA and the pool, increasing the melting temperature (Tm) of the complex, and requiring a stronger interaction between target and sequence to release the binding sequences into solution. The initial round of selection implemented a weaker cDNA interaction due to one less G base on the 5´ end of the library. This is in keeping with the generally lower stringency conditions in the first round, and is not expected to significantly impact the selection other than by allowing more potential binders as well as background sequences (dehybridize based on thermodynamics) to pass to the next selection round. These background sequences were minimized as the selection continued toward enrichment by implementing higher stringency conditions in subsequent selection rounds. When the cDNA was lengthened from a 7-mer to an 8-mer in round 14, the percentage of DNA eluted by the target is reduced from 15.3% to 11.1% for a Tm increased from 19.2 °C to 26.7 °C. The cDNA was further extended to 9-mer in round 15 with a Tm of 31.3 °C, dropping the total eluted to 3.3%.
Further information on enrichment can be obtained by sequencing several pools, both enriched and non-enriched examples, in order to track the progression of the pools in each round. Next generation sequencing (NGS) has emerged as a powerful method for sequencing in selection, mainly because higher sequence reads (total number of sequences reported) are obtained compared to Sanger sequencing. These higher sequence reads present a greater coverage of the total number of sequences in the pool, providing a more complete picture of the diversity of sequences. NGS also removes the cloning bias32, and allows for sequencing of multiple pools in a single batch with the addition of bar codes24,33. NGS was used to analyze the progression of enrichment from three separate pools in this sample selection (Figure 2). Pools from round 6 (slight enrichment compared to round 2 by % eluted), round 13 (highest enrichment), and round 15 (highest stringency) were chosen as representative points of the selection. The copy numbers of each unique sequence were plotted as a percentage of the total number of sequence reads for each pool. The top ranked (highest copy number) sequence only constituted 0.1% of all sequences in round 6 (33,435 total sequences, 22,463 unique sequences). As the pool becomes maximally enriched in round 13, the top ranked sequence increases to comprise 15.4% of the entire pool (17,681 total sequences, 2,987 unique sequences), 150x higher than in round 6 despite only a ~5x increase in enrichment observed by UV. Round 15 (28,919 total sequence reads, 2,980 unique sequences) jumped to 44.9% of all sequences represented by the single top ranked sequence even though the UV enrichment monitoring showed that the amount eluted by the target was ~5x lower than that of round 13 (Table 1). Enrichment is also demonstrated by the lower percentage of unique sequences (67% in round 6 to 10% in round 15) as the pool evolves from many to several sequences with potential target binding. Additionally, the top ranked sequence in round 13 (15-3) was the third highest copy number sequence in round 15 after the cDNA length was extended, and the second ranked sequence in round 13 became the highest copy number sequence in round 15 (15-1):
15-1 GGAATGGATCCACATCCATGGATGGGCAATGCGGGGTGGAGAATGGTTGCCGCACTTCGGCTT
CACTGCAGACTTGACGAAGCTT
15-3 GGAATGGATCCACATCCATGGGAGGGTTGGAAGGGAGGGGCCCGGGGTGGGCCATCGTTCGTT
CACTGCAGACTTGACGAAGCTT
Previous studies examined the binding of these two sequences by microscale thermophoresis and equilibrium dialysis24. The results showed significant cortisol binding for sequence 15-1 (Kd = 6.9 ± 2.8 µM by equilibrium dialysis; 16.1 ± 0.6 µM by microscale thermophoresis) while minimal binding was observed between cortisol and sequence 15-3. This shows that the increased length of the capture probe in round 15 aided in providing higher stringency conditions to parse out the higher affinity binder. Additionally, neither sequence demonstrated observable binding to the negative selection molecule, progesterone, showing that addition of the negative selection steps was beneficial to the procedure.
The fact that a higher affinity binder emerged following maximal enrichment (determined by the traditional method of analyzing the percentage of DNA eluted by the target) after elevated stringency conditions were applied in further rounds of selection validates the method of extending the length of the cDNA capture probe post-enrichment. This result shows that copy number from a sequenced pool and affinity for the target may only be associated under certain conditions24,34, in contrast with a prior report implying a direct correlation35. It also highlights the benefit of monitoring enrichment by NGS, rather than solely by the % eluted strategy common in most selections, which may vary naturally from one round to the next as higher stringency conditions are applied. However, % eluted is useful for monitoring enrichment when similar conditions are applied across several rounds. For example, rounds 6-10 all involved similar conditions, with no significant change in enrichment (Table 1). When this is observed over several rounds, the conditions are likely too stringent to promote enrichment, and the researcher should decrease stringency in the next round. For instance, the cortisol concentration was increased from 35 µM to 100 µM in rounds 11-13, and the % eluted increased from 2.5% in round 10 to 14.5% in round 12. Therefore, % eluted can serve as a guide for adjusting the stringency during the course of a selection when similar conditions are compared from round to round, and may provide complementary information to NGS for determining a selection endpoint.
Sequence 15-1 was applied to an AuNP assay to determine if a sequence selected in a manner to produce a structure-switching aptamer would function in an assay that relies on a structural change following target binding to produce a response. Previous initial studies showed that the AuNP assay with 15-1 responded to the stress biomarker cortisol, but not to two other markers of stress, epinephrine and norepinephrine, or cholic acid, a marker of liver disease structurally similar to cortisol24. The response was observed in the normal range of free cortisol reported in human serum (~150-600 nM)6, validating that the aptamer selected for a structural change upon cortisol binding produces a response in the AuNP assay. In this current work, characterization of the system was taken one step further by adjusting the coverage (density) of 15-1 on the AuNP surface. Using the same set of conditions, the DNA coverage was increased from 73 D/NP (DNA molecules/AuNP), to 120 D/NP and 200 D/NP (Figure 3). Cholic acid produced a minimal response, with the exception of 10 µM at 200 D/NP. The response of the assay diminished as the coverage was increased as did the limits of detection (LOD). The LOD was 29.5 nM for 73 D/NP, 145.2 nM for 120 D/NP, and 27.3 µM for 200 D/NP. This result agrees with the work of Smith et al. who illustrated that the response of an AuNP assay utilizing the cocaine aptamer decreased when the aptamer coverage was increased from 60 D/NP to 300 D/NP36. This implies that the detection range for the target of interest can be adjusted based on optimizing the DNA surface coverage in the AuNP assay. This could be beneficial when comparing, for example, the range of free cortisol in human serum (~150-600 nM) versus human saliva (~5-25 nM)6,37. While physiological fluids are far more complex than this buffer assay, the results provide an extension on the proof-of-principle work demonstrating that AuNP conditions can be adjusted depending on the application, and that further work towards broadening the medium to biological fluids would be of interest to the biosensor community.
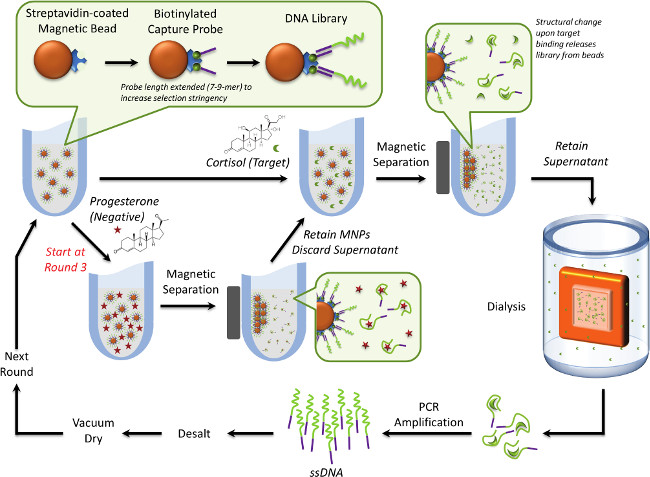
Figure 1. Overview of structure-switching selection method. A small biotinylated cDNA capture probe is immobilized on streptavidin-coated magnetic beads. The cDNA is complementary to the 5´ region of the library, hybridizing the library to the beads. When target is added, a conformational change is induced to release binding sequences from the bead, allowing partitioning facilitated by applying a magnet. The supernatant is retained to monitor enrichment (% DNA eluted by the target) by UV after dialyzing the target from the DNA. This step is only necessary if the target molecule absorbs in the same UV range as DNA. Sequences are then PCR amplified and prepared for the following round of selection. As the selection progresses, negative selection is applied, where sequences eluted by the negative selection molecule are discarded, and the beads with potential target binders are then incubated with target. The length of the cDNA probe is increased following maximal enrichment (% eluted) to increase the stringency of the selection. This figure has been reprinted with permission from24. Please click here to view a larger version of this figure.
| Round | [Cortisol] (µM) | [Progesterone] (µM) | Bound DNA (pmol) | % Eluted by Target | cDNA Length |
| 1 | 100 | 0 | 357.57 | N/A | 7-mer |
| 2 | 50 | 0 | 145.49 | 1.4 | 7-mer |
| 3 | 50 | 1 | 188.74 | N/A | 7-mer |
| 4 | 50 | 5 | 336.4 | 2.3 | 7-mer |
| 5 | 35 | 5 | 88.05 | N/A | 7-mer |
| 6 | 35 | 10 | 303.89 | 3.1 | 7-mer |
| 7 | 35 | 10 | 255.01 | N/A | 7-mer |
| 8 | 35 | 10 | 236.81 | 2.1 | 7-mer |
| 9 | 35 | 10 | 318.95 | 2.6 | 7-mer |
| 10 | 35 | 10 | 297.18 | 2.5 | 7-mer |
| 11 | 100 | 10 | 147.61 | N/A | 7-mer |
| 12 | 100 | 10 | 154.36 | 14.5 | 7-mer |
| 13 | 100 | 10 | 150.39 | 15.3 | 7-mer |
| 14 | 75 | 20 | 247.71 | 11.1 | 8-mer |
| 15 | 50 | 40 | 409.63 | 3.3 | 9-mer |
Table 1. Selection progression and enrichment by % elution24. N/A (Not Applicable) is reported for rounds where dialysis/UV enrichment monitoring was not performed in early selection rounds to mitigate loss of low copy number sequences. This table has been reprinted with permission from24.
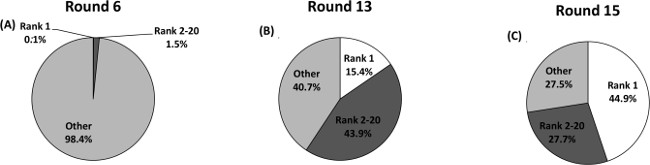
Figure 2. Selection enrichment determined by next-generation sequencing. (A) Round 6; (B) Round 13; (C) Round 15. Sequences were ranked according to copy number. The highest copy number sequence increased from constituting a low percentage of the entire sequenced pool in round 6 (0.1%) to a high percentage in round 15 (44.9%) as the pool was enriched for cortisol binding sequences. This figure has been reprinted with permission from24. Please click here to view a larger version of this figure.
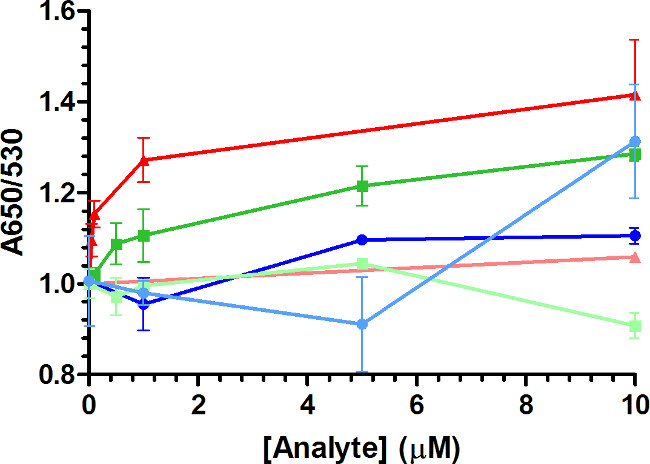
Figure 3. AuNP assay response from varying aptamer 15-1 coverage. The density of the aptamer incubated with the AuNPs was increased from 73 D/NP (red triangle), to 120 D/NP (green square) and 200 D/NP (blue circle). Cortisol responses are bold colors, cholic acid response is in light colors. The assay response is improved for cortisol at lower densities, thus lowering the LOD and the range the target can be detected within. The conditions with the highest cortisol response (73 D/NP) were characterized further in the linear range to provide more points within the expected normal range of free cortisol reported in human serum (~150-500 nM) and saliva (5-25 nM)6,37. The minimal response of cholic acid applying the same 73 D/NP conditions has been detailed in previous work24. All plots represent the mean ± SEM for duplicate or triplicate measurements.
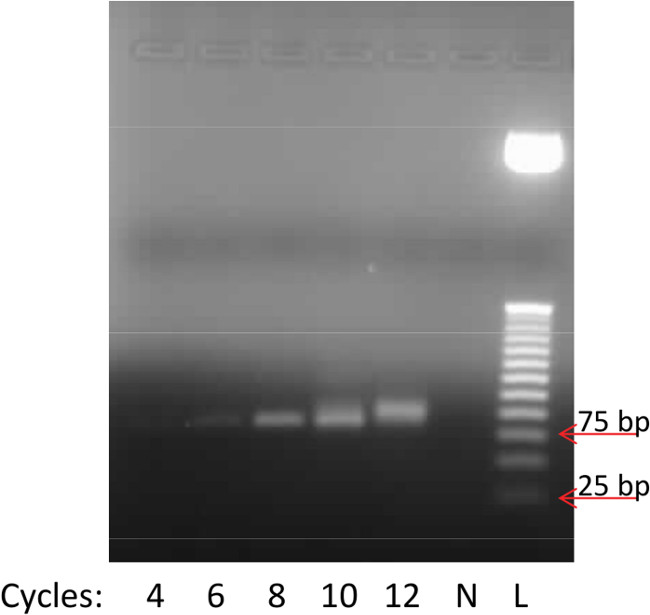
Figure 4. Representative results from PCR cycle optimization. From left to right the wells represent: 4 cycles, 6 cycles, 8 cycles, 10 cycles, 12 cycles, negative (no DNA template), 25 bp DNA ladder standard. Optimal conditions are observed at 8 cycles, where the single product band is at high intensity without over-amplification products present at higher cycles.
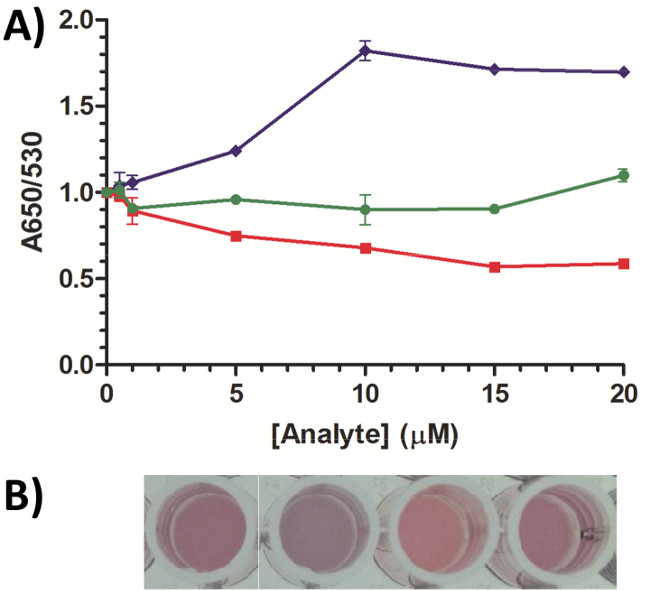
Figure 5. AuNP assay incubation time optimization. The incubation time of the AuNP/DNA step at 73 D/NP was reduced from O/N (Figure 3) to 30 min, and the target incubation was immediately followed by salt addition rather than after 20 min (Figure 3). (A) A response is observed for cortisol (blue diamonds) but not for cholic acid (green circles) or 2MNP (2-methoxynaphthalene; red squares). All plots represent the mean ± SEM for duplicate or triplicate measurements. (B) From left to right: blank, 10 µM cortisol, 10 µM cholic acid, 10 µM 2MNP. Visual change can be observed by the naked eye for cortisol. Please click here to view a larger version of this figure.
Discussion
The fact that small molecules are of biological interest, but only constitute 19% of all aptamers reported renders methods designed for selecting aptamers that are applicable to small molecules of great significance. SELEX of small molecules is particularly challenging as fewer functional groups, structural motifs, and surface area are available for interaction with sequences compared to proteins1, and it has been estimated that less than 30% of selections for all targets attempted have resulted in an aptamer38. Therefore, one must be exceptionally aware of experimental design and execution in order to successfully select an aptamer to a small molecule target.
The aptamer selection method described in this work is advantageous because it is applicable to small molecules without requiring any chemical modification which may alter their binding properties. It is also elution based, which means that since the DNA, rather than the target, is initially bound then eluted from the magnetic beads by the target, DNA interacting with the bead matrix will not be amplified for the next round of selection because binders to the molecule of interest are released into the supernatant buffer and nonspecific matrix binders remain bound. Conversely, a negative-selection method against the matrix is required for methods that immobilize the target to the solid support each round because DNA that interacts with the matrix will be amplified in addition to the target binders1. The current method was designed as a Tm limited selection strategy. This means that the Tm of the cDNA/pool hybridization was kept close to RT. Morse used a similar strategy, but applied a 6-mer cDNA probe with a Tm < 10 °C with selection conditions at 4 °C17. Our application was for a biosensing assay performed at RT, so the length of the cDNA was adjusted accordingly. This keeps the stringency of the selection low enough so that potential binders are not lost because the target binding interaction occurs in a remote location that does not induce a conformational change capable of disrupting cDNA binding. However, the partitioning efficiency of the proposed method is low because some sequences will dehybridize solely based on thermodynamics. In contrast, Nutiu et al. applied a 15-mer cDNA, and were only able to identify aptamers for two of the four targets, possibly because the Tm of the 15-mer was too high to allow a release by a small molecule target18. Therefore, while the current selection strategy will require many rounds to remove background sequences, by controlling the stringency of the selection and minimizing the loss of potential binders the likelihood of success will be increased.
Many researchers new to aptamer selection are unaware of important aspects related to the PCR of potential binders. Cycle optimization (section 4.5) is necessary because over-amplification of DNA libraries produces unwanted by-products (typically larger in size) at high cycle numbers, and the desired product may completely disappear with an excess of only 5 cycles39. In the case of over-amplification, the PCR products no longer represent those sequences eluted by the target, and the chances of selection success are significantly diminished. Figure 4 illustrates an example of cycle optimization from round 5 in this work. The lowest cycle produces a minimal product band, the band increases in amount through 8 cycles; at 10 cycles the band begins a transition to a higher size over-amplification product, and is nearly entirely comprised of the over-amplified product within 12 cycles. Another detail that many researchers inexperienced in SELEX may overlook is that the entire pool must be amplified in the large scale PCR amplification (section 4.6) in the first round to mitigate loss of binders. The number of unique sequences possible from oligonucleotides is 4N, where 4 represents the four nucleic acid bases, and N is the number of bases in the random region of the library. For this work, N = 40, resulting in a sequences space of 1.2 x 1024 possible unique sequences. The 2.5 nmol of library used in the first round of selection corresponds to ~1015 molecules, meaning that each copy of DNA is likely represented in the initial pool as a unique sequence. Therefore, the entire volume of DNA eluted from the beads by the target must be amplified to retain a copy of each potential binder for the next round of selection. Once this initial amplification has occurred, multiple copies are available for selection in the following rounds where a homogenous solution is assumed for sampling.
The concentration of target should also be carefully considered in each round. Nutiu et al. used a concentration of 1 mM target throughout the selection process, and selected an ATP aptamer with Kd = 600 µM18. Both the current work and the research of Morse17 began with 100 µM target, decreasing throughout the course of the selection, and resulted in aptamers with low micromolar affinities. Exactly which round the stringency should be increased (lower target concentration) depends on when enrichment is observed. Another critical step is to apply proper negative selection steps so aptamers demonstrate specificity to the target molecule. Which controls are used is contingent upon the intended application of the selected aptamer. For example, aptamer 15-1 was designed to function as a recognition element in a biosensing assay for cortisol, so progesterone was used as a negative selection molecule because it is a metabolic precursor to cortisol that is found in physiological fluids40. The ATP aptamer selected by Nutiu et al. did not include a negative selection step, and interacts with structurally similar molecules including ADP, AMP, adenosine, and dATP18.
A final note for consideration is that the AuNP assay often requires considerable optimization for each aptamer/target pair. Looking for the volume of salt that induces a barely visually noticeable change toward a blue hue after salt addition is a good starting point, but adjustment of the starting point might be required to observe a response. We have also found that the assay produces drastically different responses depending on buffer concentration (the selection buffer may require dilution because the high salt concentration of buffers often causes aggregation) and composition, degree of DNA coverage (Figure 3), sample preparation (some organic solvents used to dissolve the target may cause a high background that masks target response), temperature, salt type and concentration, and incubation time (of both DNA with AuNP and DNA/AuNP with target). Under fully optimized conditions, results are typically observed with a target incubation time <5 min, demonstrating the benefit of a rapid target response of the AuNP biosensing platform. For example, in Figure 5 the incubation time of the aptamer/AuNP step was reduced from O/N (Figure 3) to 30 min, and salt was added immediately (<10 sec) after target addition rather than 20 min later (Figure 3) at a loading density of 73 D/NP. This increased the cortisol response to ~82% higher than the blank (Figure 5A) at 10 µM target concentration versus ~40% using the previous conditions (Figure 3). This response can be distinguished with the naked eye (Figure 5B). Note that the linear range of cortisol detection is different than using the previous conditions, suggesting that these conditions can be optimized for a desired detection range. Cholic acid and 2-methoxynaphthalene (2MNP) controls did not produce a significant response (Figures 5A-B). Researchers must be aware that reducing these incubation times may facilitate increased response of analytes with the AuNP surface, which can contribute to overall enhanced signal (target) or background (non-target molecules). Therefore, careful AuNP assay design and performance characterization is necessary for each aptamer/target pair.
This procedure describes a protocol for selecting small molecule structure-switching aptamers that function in a biosensing platform such as the described AuNP assay, which require a conformational change of the DNA to detect the presence of target. However, this method could be applied to other biosensor systems such as electrochemical or fluorescence that function on the same premise for virtually any size target. The power of the protocol can be further developed experimentally by several approaches. First, the selection itself may be potentially improved by investigating methods of optimization such as determining the ideal Tm of the cDNA/library hybridization that provides an interaction that is weak enough to interact with a small molecule target, yet strong enough to reduce the amount of background sequences dehybridized solely from thermodynamics. This will condense the number of cycles required for selection, saving time in labor and reducing reagent consumption. Further investigations into modifications to the selection would be to determine the most favorable concentrations of beads and DNA so that a diverse population of sequences is exposed to the target, especially in the initial round. The success of these proof-of-principle experiments provide a foundation to invest further resources towards optimizing and adapting the AuNP buffer assay to physiological fluids. There is a legitimate need for a rapid, robust biosensing platform that can function as a diagnostic tool of the physiological state of an individual, and further development of the AuNP assay in human serum, sweat, or saliva would meet a this current gap.
Disclosures
Distribution Statement A: Approved for public release; distribution is unlimited (88 ABW-2014-4103). The authors declare that they have no competing financial interests.
Acknowledgements
This research was performed while the author (JAM) held a National Research Council Research Associateship Award at Air Force Research Laboratories. Co-author MW held a Wright Scholar Fellowship supported by the Air Force Office of Scientific Research. This work was supported by Air Force Office of Scientific Research, Air Force Research Laboratory, and Bio-X Strategic Technology Thrust.
Materials
| Name | Company | Catalog Number | Comments |
|---|---|---|---|
| Dynabeads M280 Streptavidin | Invitrogen | 112.06D | Compatible with DynaMag-2 Magnet |
| DynaMag-2 Magnet | Invitrogen | 12321D | Compatible with Dynabeads M280 Streptavidin |
| Streptavidin Sepharose High Performance | GE Healthcare | 17-5113-01 | This is a high density streptavidin product for ssDNA preparation |
| Hydrocortisone | Sigma | H4001 | ≥98% |
| Progesterone | Sigma | P0130 | ≥99% |
| Cholic Acid | Sigma | C1129 | ≥98% |
| NanoDrop ND-1000 | NanoDrop | ND-1000 | Replaced by ND-2000 model |
| Tris Base | Promega | H5135 | ≥99.9% |
| Sodium Chloride | Sigma | S9888 | ≥99.5% |
| Magnesium Chloride Hexahydrate | Fluka | 63068 | ≥98% |
| 500 ml Filter System | Corning | 430769 | 0.22 µm cellulose acetate membrane |
| DNA Library | Operon | Custom | HPLC purified |
| All other DNA | IDT | Custom | Capture probes and primers — desalted; Aptamers — HPLC |
| Thermomixer | Eppendorf | R | Any model with temperature and mixing speed control will work |
| PfuUltra II Fusion HotStart DNA Polymerase, 400 rxn | Agilent | 600674 | Taq polymerase can be used as well |
| Deoxynucleotide Mix, PCR-Grade | Agilent | 200415 | Other brands will work here |
| 10x Cloned Pfu DNA Polymerase Buffer | Agilent | 200532 | This buffer was optimized for PfuUltra II polymerase |
| GeneAmp PCR System | Applied Biosystems | 9700 | Any model that allows researcher to open lid for cycle optimization will work |
| Agarose-LE | Ambion | AM9040 | ≥99.9% |
| Ethidium Bromide | Sigma | E-1510 | Acute toxicity, inhalation; suspected carcinogen |
| Empty Synthesis Columns, 1 µm Expedite Style | Glen Research | 20-0021-01 | This model is ideal because of the Luer-Lok fitting to couple with syringe |
| Replacement Filters Expedite | Glen Research | 20-0021-0F | 1 µm size |
| Illustra NAP-25 Columns | GE Healthcare | 17-0852-01 | Any brand with DNA grade resin gel filtration column will work |
| Slide-A-Lyzer Dialysis Cassette | ThermoFisher Scientific | 66205 | 2k MWCO used |
| Gold(III) chloride hydrate | Sigma | 254169 | 99.999% purity is important |
| Sodium Citrate Dihydrate | SAFC | W302600 | We have found that the compound produced from different manufacturers greatly affects AuNP assays |
| SpectraMax | Molecular Devices | M5 | Results were similar to Bio-TEK system |
| Synergy | Bio-TEK | HT | Results were similar to Molecular Devices system |
| HEPES Buffer | Amresco | J848 | Any brand that makes a sterilized product will work |
| 250 ml Filter System | Corning | 430767 | 0.22 µm cellulose acetate membrane |
| UV Spectrophophotometer | Varian | Cary 300 | Other brands will work here |
| 5 ml Syringe | Becton-Dickinson | 309646 | This model is ideal because of the Luer-Lok fitting to couple with Expedite column |
| ThermoEC Minicell Primo | ThermoFisher Scientific | EC320 | Compatible with Power Supply |
| Power Supply | Fisher Scientific | FB300 | Compatible with ThermoEC Minicell Primo |
| Dimethyl Sulfoxide | Sigma | D8418 | Flammable liquid |
| 2-Methoxynaphthalene | Sigma | 148245 | 99% |
| Assay Plate | Corning | 3370 | 96-well Flat Bottom, Sterile |
References
- McKeague, M., DeRosa, M. C. Challenges and opportunities for small molecule aptamer development. J. Nucleic Acids. 2012, 1-20 (2012).
- Gatti, R., Antonelli, G., Prearo, M., Spinella, P., Cappellin, E., De Palo, E. F. Cortisol assays and diagnostic laboratory procedures in human biological fluids. Clin. Biochem. 42, 1205-1217 (2009).
- Morgan, C. A., Wang, S., Rasmusson, A., Hazlett, G., Anderson, G., Charney, D. S. Relationship among plasma cortisol, catecholamines, neuropeptide Y, and human performance during exposure to uncontrollable stress. Psychosom. Med. 63 (3), 412-422 (2001).
- Michael, D. J., Valle, B., Cox, J., Lalns, J. E., Fogt, D. L. Salivary Biomarkers of Physical Fatigue as Markers of Sleep Deprivation. J. Clin. Sleep Med. 9 (12), 1325-1331 (2013).
- Kwak, J., et al. Volatile biomarkers from human melanoma cells. J. Chrom. B. 931, 90-96 (2013).
- Stevens, R. C., Soelberg, S. D., Near, S., Furlong, C. E. Detection of Cortisol in Saliva with a Flow-Filtered, Portable Surface Plasmon Resonance Biosensor System. Anal. Chem. 80 (17), 6747-6751 (2008).
- Arya, S. K., Ghornokur, G., Venugopal, M., Bhansali, S. Antibody functionalized interdigitated μ-electrode (IDμE) based impedimetric cortisol biosensor. Analyst. 135 (8), 1941-1946 (2010).
- Kapczinski, F., et al. Allostatic load in bipolar disorder: Implications for pathophysiology and treatment. Neurosci. Biobehav. Rev. 32 (4), 675-692 (2008).
- Tuerk, C., Gold, L. Systematic evolution of ligands by exponential enrichment: RNA ligands to bacteriophage T4 DNA polymerase. Science. 249 (4968), 505-510 (1990).
- Ellington, A. D., Szostak, J. W. In vitro selection of RNA molecules that bind specific ligands. Nature. 346 (6287), 818-822 (1990).
- Ciesiolka, J., Gorski, J., Yarus, M. Selection of an RNA domain that binds Zn2. RNA. 1 (5), 538-550 (1995).
- Liu, J., et al. Selection of Aptamers Specific for Adipose Tissue. PlosOne. 7, e37789(2012).
- McCauley, T. G., Hamaguchi, N., Stanton, M. Aptamer-based biosensor arrays for detection and quantification of biological macromolecules. Anal. Biochem. 319 (2), 244-250 (2003).
- Huang, L., et al. A label-free electrochemical biosensor based on a DNA aptamer against codeine. Anal. Chim. Acta. 787, 203-210 (2013).
- Stoltenburg, R., Reinemann, C., Strehlitz, B. SELEX—A (r)evolutionary method to generate high-affinity nucleic acid ligands. Biomol. Eng. 24 (4), 381-403 (2007).
- Jayasena, S. D. Aptamers: An Emerging Class of Molecules That Rival Antibodies in Diagnostics. Clin Chem. 45 (9), 1628-1650 (1999).
- Morse, D. P. Direct selection of RNA beacon aptamers. Biochem. Biophys. Res. Commun. 359, 94-101 (2007).
- Nutiu, R., Li, Y. Structure-Switching Signaling Aptamers. J. Am. Chem. Soc. 125 (16), 4771-4778 (2003).
- Luo, F., Zheng, L., Chen, S., Cai, Q., Lin, Z., Qiu, B., Chen, G. An aptamer-based fluorescence biosensor for multiplex detection using unmodified gold nanoparticles Chem. Commun. 48 (51), 6387-6389 (2012).
- Li, H., Rothberg, L. J. Label-Free Colorimetric Detection of Specific Sequences in Genomic DNA Amplified by the Polymerase Chain Reaction. J. Am. Chem. Soc. 126 (35), 10958-10961 (2004).
- Chávez, J. L., MacCuspie, R. I., Stone, M. O., Kelley-Loughnane, N. Colorimetric detection with aptamer–gold nanoparticle conjugates: effect of aptamer length on response. J. Nanopart. Res. 14 (9), 1166-1177 (2012).
- Hagen, J. A., et al. Biofunctionalized Zinc Oxide Field Effect Transistors for Selective Sensing of Riboflavin with Current Modulation. Sensors. 11 (7), 6645-6655 (2011).
- Han, K., Liang, Z., Zhou, N. Design Strategies for Aptamer-Based Biosensors. Sensors. 10 (5), 4541-4557 (2010).
- Martin, J. A., Chávez, J. L., Chushak, Y., Chapleau, R. R., Hagen, J., Kelley-Loughnane, N. Tunable stringency aptamer selection and gold nanoparticle assay for detection of cortisol. Anal. Bioanal. Chem. 406 (19), 4637-4647 (2014).
- Hall, B., et al. Synthesis, and Amplification of DNA Pools for In Vitro Selection. Curr. Protoc. Nucleic Acid Chem. 39, 9.2.1-9.2.28 (2009).
- Sefah, K., Shangguan, D., Xiong, X., O’Donoghue, M. B., Tan, W. Development of DNA aptamers using Cell-SELEX. Nat. Protoc. 5 (6), 1169-1185 (2010).
- Djordjevic, M. SELEX experiments: New prospects, applications and data analysis in inferring regulatory pathways. Biomol. Eng. 24 (2), 179-189 (2007).
- Thomas, J. R., Hergenrother, P. J. Targeting RNA with Small Molecules. Chem. Rev. 108 (4), 1171-1224 (2008).
- Jing, M., Boswer, M. T. A Review of Methods for Measuring Aptamer-Protein Equilibria. Anal. Chim. Acta. 686 (1-2), 9-12 (2011).
- Sachs, E. -F., Diederichsen, U. Binding of Triostin Analogues to DNA. , AN NT008. (2011).
- Liu, J., Lu, Y. Preparation of aptamer-linked gold nanoparticle purple aggregates for colorimetric sensing of analytes. Nat. Protoc. 1 (1), 246-252 (2006).
- Cho, M., et al. Quantitative selection of DNA aptamers through microfluidic selection and high-throughput sequencing. Proc. Natl. Acad. Sci. USA. 107 (35), 15373-15378 (2010).
- Martin, J. A., et al. Selection of an Aptamer Antidote to the Anticoagulant Drug Bivalirudin. Plos One. 8 (3), e57341(2013).
- Schütze, T., et al. Probing the SELEX Process with Next-Generation Sequencing. Plos One. 6 (12), e29604(2011).
- Kupakuwana, G. V., Crill, J. E., McPike, M. P., Borer, P. N. Acyclic identification of aptamers for human alpha-thrombin using over-represented libraries and deep sequencing. Plos One. 6 (5), (2011).
- Smith, J. E., Griffin, D. K., Leny, J. K., Hagen, J. A., Chávez, J. L., Kelley-Loughnane, N. Colorimetric detection with aptamer-gold nanoparticle conjugates coupled to an android-based color analysis application for use in the field. Talanta. 121, 247-255 (2014).
- Chatterton Jr, R. T., Vogelsong, K. M., Lu, Y. -C., Hudgens, G. A. Hormonal Responses to Psychological Stress in Men Preparing for Skydiving. J. Clin. Endocrinol. Metab. 82 (8), 2503-2509 (1997).
- Gold, L., et al. Aptamer-Based Multiplexed Proteomic Technology for Biomarker Discovery. Plos One. 5 (12), (2010).
- Musheev, M. U., Krylov, S. N. Selection of aptamers by systematic evolution of ligands by exponential enrichment: Addressing the polymerase chain reaction issue. Anal. Chim. Acta. 564 (1), 91-96 (2006).
- Wiebe, J. P. Progesterone metabolites in breast cancer. Endocr.-Relat. Cancer. 13 (3), 717-738 (2006).
Reprints and Permissions
