Here we present a procedure to quantify enterovirus and norovirus in environmental and drinking waters using reverse transcription-quantitative PCR. Mean virus recovery from groundwater with this standardized procedure from EPA Method 1615 was 20% for poliovirus and 30% for murine norovirus.
Method Article
EPA Method 1615. Measurement of Enterovirus and Norovirus Occurrence in Water by Culture and RT-qPCR. Part III. Virus Detection by RT-qPCR
In This Article
Summary
Abstract
EPA Method 1615 measures enteroviruses and noroviruses present in environmental and drinking waters. This method was developed with the goal of having a standardized method for use in multiple analytical laboratories during monitoring period 3 of the Unregulated Contaminant Monitoring Rule. Herein we present the protocol for extraction of viral ribonucleic acid (RNA) from water sample concentrates and for quantitatively measuring enterovirus and norovirus concentrations using reverse transcription-quantitative PCR (RT-qPCR). Virus concentrations for the molecular assay are calculated in terms of genomic copies of viral RNA per liter based upon a standard curve. The method uses a number of quality controls to increase data quality and to reduce interlaboratory and intralaboratory variation. The method has been evaluated by examining virus recovery from ground and reagent grade waters seeded with poliovirus type 3 and murine norovirus as a surrogate for human noroviruses. Mean poliovirus recoveries were 20% in groundwaters and 44% in reagent grade water. Mean murine norovirus recoveries with the RT-qPCR assay were 30% in groundwaters and 4% in reagent grade water.
Introduction
Quantitative PCR (qPCR; see supplemental materials for definitions of terms used in this manuscript) and reverse transcription-qPCR (RT-qPCR) are valuable tools for detecting and quantifying human enteric viruses in environmental and drinking waters, and especially for many viruses that do not replicate or replicate poorly in cell culture systems. Both tools have demonstrated that many virus types are present in environmental and drinking waters throughout the world1-6. Their use coupled with sequencing of amplified genomic fragments during disease outbreak investigations has provided evidence for waterborne virus transmission, as they have shown that the virus found in the drinking water is identical to that shed by outbreak patients7-10.
Both qPCR and RT-qPCR are useful public health tools. For example, data from studies conducted by the U.S. Environmental Protection Agency (EPA) showed a strong relationship between indicator measurements by qPCR and health effects in recreational waters. As a result, EPA's final 2012 Recreational Water Quality Criteria includes a qPCR method for monitoring recreational beaches11,12. Borchardt and colleagues also found a strong relationship between acute gastroenteritis in communities using untreated groundwater and virus in groundwater as measured by RT-qPCR1.
The purpose of this paper is to describe the molecular assay component of EPA Method 161513,14. This assay uses RT-qPCR to provide a quantitative estimate of enterovirus and norovirus genomic copies (GC) per liter based upon the original volume of the environmental or drinking water passed through an electropositive filter. An overview of the molecular procedure is shown in Figure 1. Protocol section 1 details the procedures for preparing the standard curve. These standards are prepared from a reagent that contains an RNA copy of the target sequence for all the primer/probe sets. Section 2 describes the tertiary concentration procedure. Section 3 gives the procedure for extracting RNA from the concentrated water and control samples. The RNA from each test sample is reverse transcribed using triplicate assays and random primers to prime the transcription (Section 4). The cDNA from each reverse transcription reaction is split into five separate virus-specific assays that are analyzed in triplicate by qPCR (Section 5; Figure 2). The assay uses primers and probes from the scientific literature (Table 1) that are designed to detect many enteroviruses and noroviruses and a reagent containing hepatitis G RNA to identify test samples that are inhibitory to RT-qPCR15.
Protocol
Note: Use data sheets to track all steps of the protocol; example data sheets are given in the supplemental materials Tables S2-S4.
1. Standard Curve Preparation
- Prepare a working stock of the standard curve reagent (e.g., Armored RNA EPA-1615) by diluting it from the concentration supplied by the manufacturer to a concentration of 2.5 x 10⁸ particles/ml (2.5 x 10⁸ GC/ml) using TSM III buffer. Divide the working stock into 250 µl aliquots using 1.5 ml microcentrifuge tubes and store at -20 °C.
NOTE: See supplemental materials protocol Step S1 for instructions on the preparing working stocks of virus and plasmids for use as alternative standard curve reagents. - Thaw one or more of the working stock aliquots. Prepare five 10-fold serial dilutions using 1.5 ml microcentrifuge tubes, giving concentrations of 2.5 x 10⁷, 2.5 x 10⁶, 2.5 x 10⁵, 2.5 x 10⁴, and 2.5 x 10³ GC/ml.
- Prepare the first dilution by adding 25 µl of the 2.5 x 10⁸ GC/ml working stock to 225 µl of TSM III buffer. Mix for 5–15 sec using a vortex mixer.
- Prepare the next dilution by adding 25 µl of the dilution prepared in Step 1.2.1 to 225 µl of TSM III buffer. Mix again and continue a similar process to prepare the next three 10-fold dilutions.
- Extract the RNA from the standard curve working stock and the five dilutions immediately using the procedure in Section 3.
2. Tertiary Concentration
- Prepare a centrifugal concentrator (30,000 molecular weight cutoff) for each sample collected by adding at least 10 ml of 1x PBS, 0.2% bovine serum albumin (BSA) to the upper sample chamber. Ensure that solution has filled the thin channel concentration chamber, and then hold O/N at 4 °C.
- Discard the fluid. Rinse the concentrator one time with at least 10 ml of sterile reagent grade water to remove excess BSA and then discard the water.
- Add an amount of secondary water concentrate from each test sample equal to S, the Assay Sample Volume into separate centrifugal concentrators.
- Calculate S using Equation 1,

Where D is the Volume of Original Water Sample Assayed, TSV is the Total Sample Volume and FCSV is the Final Concentrated Sample Volume. See supplemental materials S2 for an example of the calculation of S.
- Calculate S using Equation 1,
- Centrifuge each test sample at 3,000–6,000 x g at 4 °C in a swinging bucket rotor for 20 – 30 min. Check the volume in the thin channel concentration chamber.
- If the volume is greater than 400 µl, centrifuge again for 20 min or longer. Continue centrifuging until the sample in the thin channel concentration chamber has been reduced to less than 400 µl. Do not remove the supernatant.
- Wash the sides of the centrifugal concentrator with 1 ml of sterile 0.15 M sodium phosphate, pH 7–7.5 to increase virus recovery. Centrifuge again at 3,000–6,000 x g and 4 °C until the sample has been reduced to less than 400 µl. Repeat this wash step one additional time.
- Using a 100-200 µl micropipette, carefully measure and transfer each concentrated sample to a 1.5 ml microcentrifuge tube (i.e., transfer 200 µl to the microcentrifuge tube and then measure the remaining concentrate by adjusting the micropipette until the remaining fluid can be completely drawn up into the pipettor tip). Add 0.15 M sodium phosphate, pH 7–7.5, to adjust the final volume to 400 ± 2 µl.
- Extract nucleic acid immediately by proceeding to step 3. Hold any concentrated samples that cannot be processed immediately at 4 °C for no more than 24 hr.
3. Nucleic Acid Isolation
- Add 200 µl of extraction buffer prepared as described in Step 3.3 and 200 µl of the tertiary concentrate from each test sample from Step 2.5 or standard curve dilution from Step 1.3 to separate labeled 1.5 ml microcentrifuge tubes. Freeze remaining tertiary concentrates at or below -70 °C. Extract the nucleic acids from each sample according to the nucleic acid extraction kit manufacturer’s instructions for the spin protocol for blood samples with the following exceptions.
- Do not add protease to the water samples or use the extraction buffer supplied with the nucleic acid extraction kit.
- Prepare extraction buffer with carrier RNA
- Add 310 µl of carrier RNA dilution buffer to a vial containing 310 µg of carrier RNA. Mix to dissolve and then divide into 6 aliquots containing about 50 µl. Store at -20 °C.
- Add 28 µl of thawed carrier RNA per ml of the extraction buffer to obtain a carrier RNA concentration of 0.027 µg/µl. Use the carrier RNA-amended extraction buffer in place of that supplied with the extraction kit.
- Prepare a master solution of elution buffer by adding ribonuclease (RNase) Inhibitor to a final concentration of 400 units/ml to the elution buffer supplied with the extraction kit.
- Elute RNA from the nucleic acid binding spin column by placing 50 µl of elution buffer with RNase inhibitor into the column. Wait for 1 min, and then centrifuge at 6,000 x g for 1 min at RT.
- Repeat Step 3.4.1 and then remove and discard the column.
- Prepare aliquots of the RNA extracts from Step 3.4.2. Prepare 6 aliquots of the standard curve working stock and each standard curve dilution containing at least 15 µl each. Prepare 4 aliquots of all other RNA samples containing at least 22 µl each. Store one aliquot of each sample and standard curve controls at 4 °C if they can be processed by reverse transcription within 4 hr; otherwise, store all aliquots at or below -70 °C.
4. Reverse Transcription (RT)
- Prepare 100 µM stock solutions of each oligonucleotide primer and probe listed in Table 1 by adding a volume of PCR-grade water to each vial using an amount (in microliters) equal to ten times the number of nanomoles (nmol) of oligonucleotide present in the vial (as shown on the vial label or in the manufacturer’s specification sheet (e.g., resuspend a primer containing 36.3 nmol in 363 µl). Mix to dissolve.
- Dilute the 100 µM solutions 1:10 with PCR-grade water to prepare 10 µM working solutions.
- Prepare RT Master Mix 1 and 2 in a clean room using the guide in Table 2. Pipette 16.5 µl of RT Master Mix 1 to each PCR plate well using a multichannel pipette.
- Thaw, if frozen, the nucleic acid extracts from each field sample and Lab Fortified Sample Matrix (LFSM; i.e., seeded water matrix sample).
- Dilute each field and LFSM sample 1:5 and 1:25 in elution buffer containing 400 units/ml of RNase inhibitor.
- Thaw, if frozen, but do not dilute Lab Fortified Blank (LFB; i.e., a positive quality control using seeded reagent grade water), Lab Reagent Blank (LRB; i.e., a negative quality control using reagent grade water), Performance Evaluation (PE; i.e., seeded reagent grade water samples used to evaluate laboratory performance prior to the start of a study), Performance Test (PT; i.e., seeded reagent grade water samples with titers unknown to an analyst that are used to evaluate laboratory performance during a study), NA Batch negative extraction control, or extracted RNA from the standard curve set.
- Place 6.7 µl of the RNA from every test sample, control, and standard curve into separate PCR plate wells, using triplicate wells for test samples and controls and duplicate wells for standard curves (see Figure S1 for an RT plate example).
- Place 6.7 µl of elution buffer into separate PCR plate wells for no template controls (NTC). Include 2-8 NTC per RT plate, using two for the first sample and then two more for every fourth additional sample.
- Distribute the negative extraction and NTC controls throughout the plate.
- Seal the PCR plate with a heat resistant plate sealer. Mix the samples for 5-10 sec and then centrifuge at ≥ 500 x g briefly.
- Incubate the plate for 4 min at 99 °C and then cool rapidly to 4 °C in a thermal cycler. Centrifuge again at ≥ 500 x g briefly.
- Carefully remove the plate seal and then add 16.8 µl of RT Master Mix 2 to each well. Seal the plate again with a heat resistant plate sealer, followed by mixing and a brief centrifugation at ≥ 500 x g.
- Place the plate in a thermal cycler and run for 15 min at 25 °C, followed by 60 min at 42 °C, 5 min at 99 °C, and then by a 4 °C hold cycle.
- Process immediately or within 8 hr by qPCR (Step 5), or store samples at or below -70 °C until they can be processed. Store samples that can be processed within 8 hr at 4 °C.
5. Real-time Quantitative PCR (qPCR)
- Determine the mean hepatitis G Cq value for each lot of hepatitis G reagent prior to running any test samples.
- Run an RT assay using 10 replicates prepared as described for NTC controls (Step 4.1.1). Run the hepatitis G qPCR assay as described below (Steps 5.2 to 5.5.3). Calculate the mean Cq value of the 10 replicates.
- Adjust the hepatitis G reagent quantity in RT Master Mix 1 (Table 2), if necessary, to obtain a mean Cq value between 25 and 32 units. Compensate the amount raised or lowered by changing the volume of water added to keep the RT Master Mix 1 final volume at 16.5 µl per assay.
- Confirm any adjustments by repeating Steps 5.1.1 to 5.1.2 and change Table 2 to reflect the adjusted quantities.
- Prepare qPCR master mixes in a clean room using the guides in Table 3 for enterovirus, Table 4 and Table 5 for norovirus genogroup I, Table 6 for norovirus genogroup II, Table 7 for murine norovirus (norovirus genogroup V), and Table 8 for hepatitis G. Mix each master mix and then centrifuge at ≥ 500 x g briefly.
- Add the PCR master mixes to the appropriate wells of a labeled optical reaction plate, using 14 µl per well and separate plates for each qPCR assay (see Figure S2 for a possible layout for a qPCR assay based upon the RT layout in Figure S1).
- Thaw the RT plate from Step 4.8 at RT, if frozen. Mix using a plate mixer and then centrifuge at ≥ 500 x g briefly.
- Dispense 6 µl of the appropriate cDNA to the appropriate wells of the optical reaction plate. Mix the samples in the optical reaction plate and centrifuge at ≥ 500 x g briefly.
- Run the hepatitis G qPCR assay on the undiluted and diluted field and LFSM samples before running all other qPCR assays. Use the lowest dilution of field or LFSM sample that is <1 Cq value greater than the mean hepatitis G Cq value for the enterovirus and norovirus qPCR assays.
- Set up the quantitative PCR thermal cycler software according to the manufacturer’s instructions. Identify the standard curve samples as standards and for each standard curve dilution, enter the genomic copy values shown in Table 9.
- Run the plate in the quantitative PCR thermal cycler for 10 min at 95 °C, followed by 45 cycles of 15 sec at 95 °C and 1 min at 60 °C.
- Determine whether each standard curve meets the acceptable values given in Table 10. See supplemental materials section S3 for examples.
- Calculate the overall standard deviation (StdDev) for the standard curve using Equation 2,

where Cq is the value reported for each standard curve replicate, Cq is the mean value for each set of replicates, #Cq is the total number of Cq values for all standard control replicates that have positive values (i.e., not undetermined), and #Stds is the number of standard controls that have positive values. - If the quantitative PCR thermal cycler software does not calculate the slope for each standard curve, calculate the slope using Equation 3,

where Cq is the mean value of the highest and lowest dilutions used and log GC is the log of the genomic copy value for the highest and lowest dilutions used from Table 9. - Calculate the R2 value using Equation 4.

where Cq is the mean of all Cq values and Log GC is the mean Log GC value for each replicate. - Calculate the % Efficiency using Equation 5:

- Calculate the overall standard deviation (StdDev) for the standard curve using Equation 2,
- Record the GC values calculated by the thermal cycler software for all test samples based upon standard curves that meet the criteria specified in Table 10 and the mean GC values for each sample. Rerun any samples with standard curves that do not meet the criteria in Table 10 or where any negative controls (LRB, NA Batch negative extraction control, or NTC) are positive. Reprocess any samples that fail to meet the criteria or have false positive controls during the rerun.
- Determine the GC per liter (GCL) for each test sample using Equation 6:

where GC is the mean genomic copy number from step 5.7, the factor '199' is the total dilution factor for the volume reductions that occur during the tertiary concentration, RNA extraction and RT-qPCR steps, DF is the dilution factor that compensates for inhibition, and D is the Volume of Original Water Sample Assayed in liters. See supplemental materials section S4 for an example of the calculation of GCL. - Compute the total GC of LFB and LRB samples by multiplying the mean GC value from Step 5.5 by 199 and dividing by 0.3.
Results
Overall virus recovery was determined using paired field and LFSM ground water samples. A total of seven sample sets were analyzed using two sets collected on separate occasions from three public treatment plants, and one sample set collected from the private well. Seed levels for the LFSM samples were 3 x 10⁶ MPN of Sabin poliovirus serotype 3 and 5 x 10⁶ PFU of murine norovirus. Murine norovirus was used as a surrogate in the method evaluation due to a lack of human norovirus stocks with a virus concentration sufficient for LFSM samples. For groundwater samples the mean poliovirus recovery was 20%, with a standard error of 2%, 14 while mean murine norovirus recovery was 30%, with a standard error of 3% (Figure 3). The regular field groundwater sample for each LFSM had no detectable enterovirus or norovirus.
LFB and LRB samples were measured using seeded and unseeded reagent-grade water. All LRB samples were negative (data not shown). Poliovirus recovery averaged 44% with a standard error of 1% (Figure 3), while murine norovirus recovery averaged 4% with a standard error of 0.5%.
RT-qPCR requires the use of adequate standard curve reagents. Figure 4 shows a typical standard curve for enterovirus and norovirus GII. The norovirus GII curve meets the standard curve performance criteria (Table 10) with a R2 value of 0.9987, an overall standard deviation of 0.14, and 101% efficiency. Norovirus GIA and GIB curves (not shown) are nearly identical to that of norovirus GII. The enterovirus curve meets the method performance criteria with a R2 value of 0.9874, an overall standard deviation of 0.58, and 103% efficiency, but has about a hundred fold less sensitivity and thus a higher detection limit than the norovirus curves.

Figure 1. Overview of the Molecular Procedure. The molecular procedure includes additional sample concentration beyond that performed for measuring infectious virus, extraction of nucleic acids, a two-step reverse transcription (RT) protocol, and quantitative PCR (qPCR). The starting volume (S) represents a method-defined proportion of the original water sample.
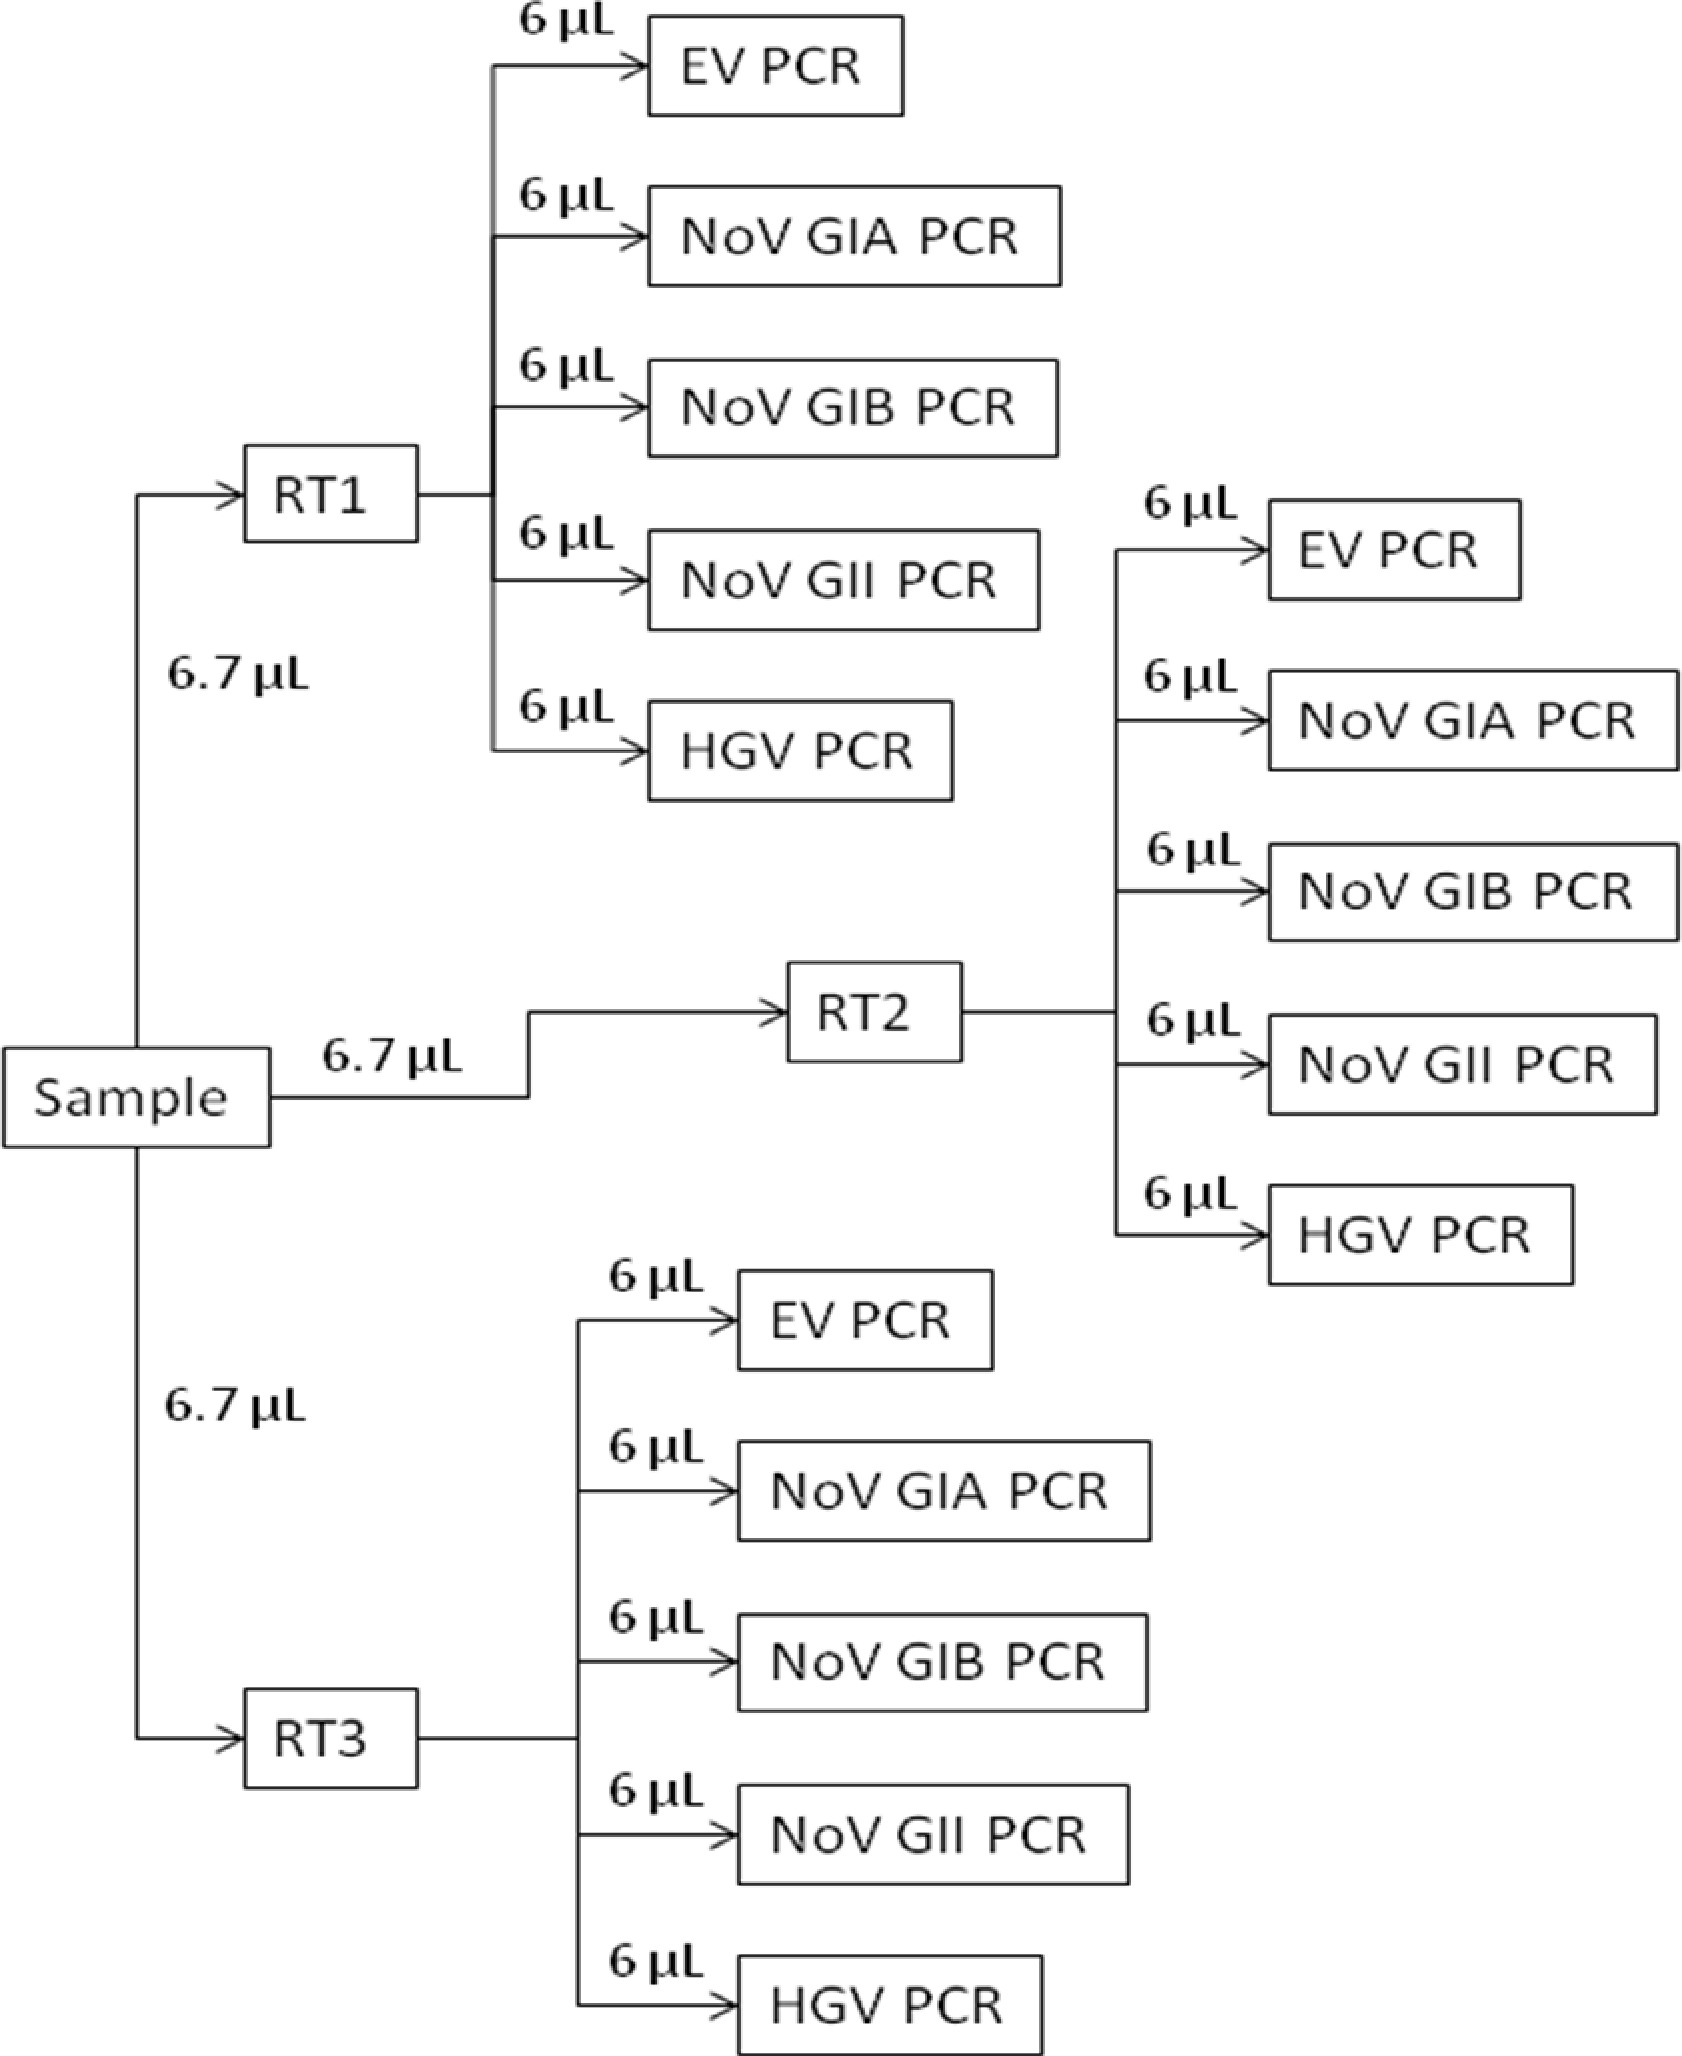
Figure 2. RT-qPCR overview schematic. Each extracted test sample RNA is reverse transcribed using triplicate assays (RT1, RT2, and RT3). The cDNA from each of the triplicate RT assays then is analyzed for specific viruses using separate enterovirus (EV PCR), norovirus genogroup I (NoV GIA PCR and NoV GIB PCR), norovirus genogroup II (NoV GII PCR), and hepatitis G (HGV PCR) assays.
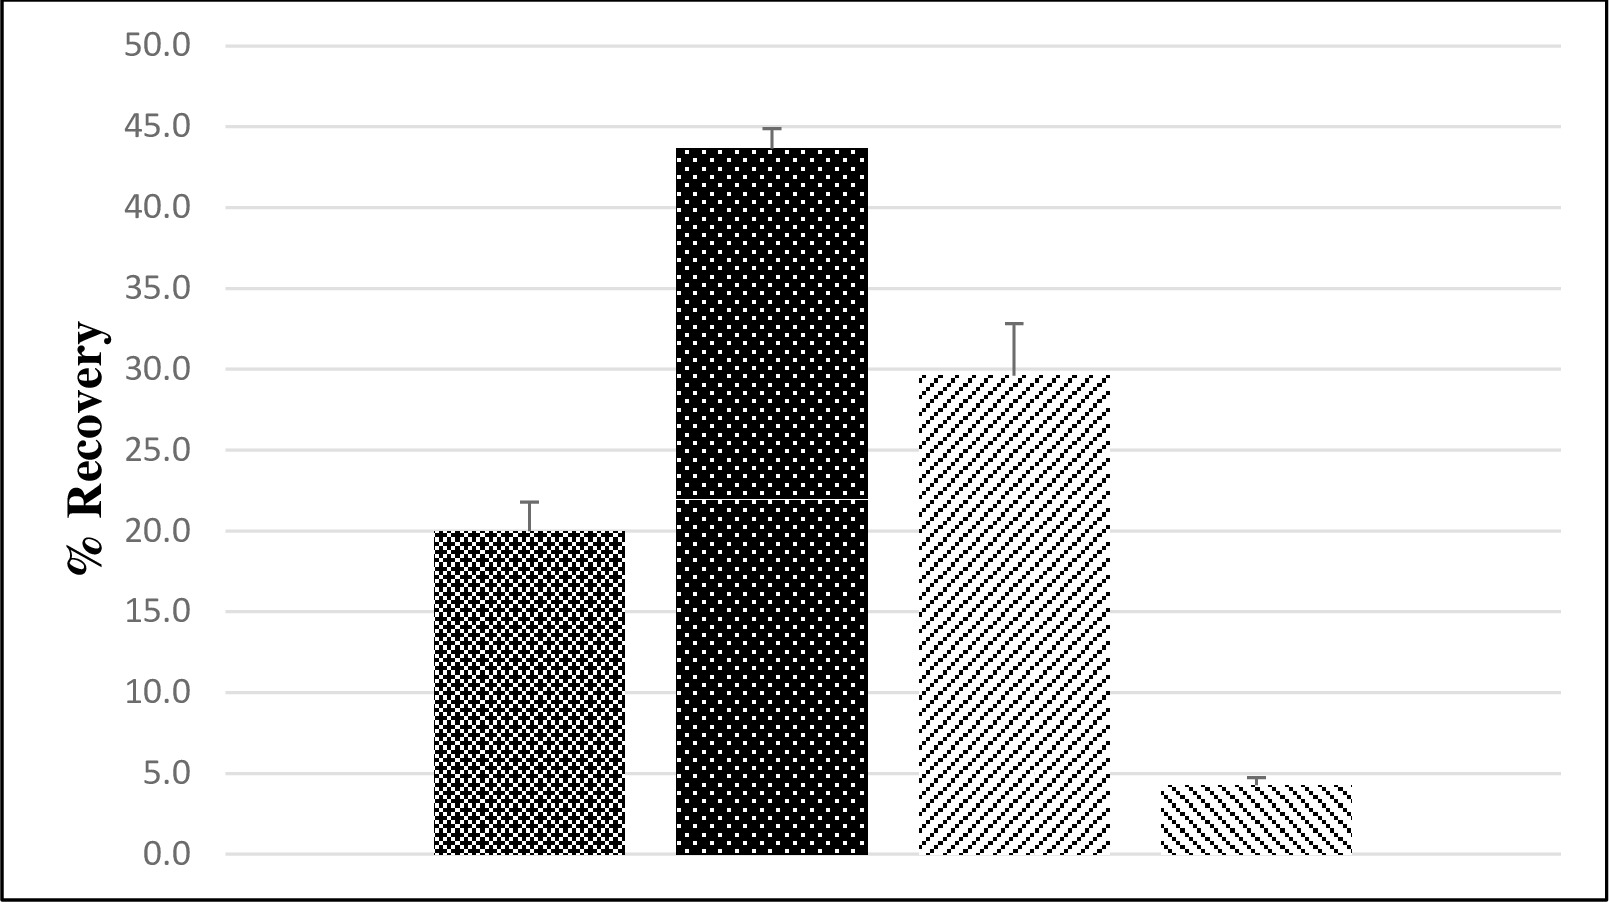
Figure 3. Mean Poliovirus and Murine Norovirus Recovery (%) from Ground and Reagent-Grade Water. The mean percent recovery is shown for poliovirus from ground ( ; n = 7) and from reagent grade (
 ; n = 12) water and for murine norovirus from ground (
 ; n = 7) and from reagent grade (
 ; n=12) water (1), where “n” is the number of separate water samples processed. Error bars represent standard error.

Figure 4. Enterovirus and Norovirus GII Standard Curve. Typical standard curves for enterovirus and norovirus GII are shown. The formulas giving slope and R2 values for each curve are calculated by the thermal cycler.
Supplemental File 1. Please click here to download this file.
| Virus Group | Primer/Probe Name (1) | Sequence (2) | Reference | |
| Enterovirus | ||||
| EntF (EV-L) | CCTCCGGCCCCTGAATG | 20 | ||
| EntR (EV-R) | ACCGGATGGCCAATCCAA | 20 | ||
| EntP (Ev-probe) | 6FAM-CGGAACCGACTACTTTGGGTGTCCGT-TAMRA | 21 | ||
| Norovirus GIA | ||||
| NorGIAF (JJV1F) | GCCATGTTCCGITGGATG | 22 | ||
| NorGIAR (JJV1R) | TCCTTAGACGCCATCATCAT | 22 | ||
| NorGIAP (JJV1P) | 6FAM-TGTGGACAGGAGATCGCAATCTC-TAMRA | 22 | ||
| Norovirus GIB | ||||
| NorGIBF (QNIF4) | CGCTGGATGCGNTTCCAT | 23 | ||
| NorGIBR (NV1LCR) | CCTTAGACGCCATCATCATTTAC | 23 | ||
| NorGIBP (NV1LCpr) | 6FAM-TGGACAGGAGAYCGCRATCT-TAMRA | 23 | ||
| Norovirus GII | ||||
| NorGIIF (QNIF2d) | ATGTTCAGRTGGATGAGRTTCTCWGA | 25 | ||
| NorGIIR (COG2R) | TCGACGCCATCTTCATTCACA | 25 | ||
| NorGIIP (QNIFS) | 6FAM-AGCACGTGGGAGGGCGATCG-TAMRA | 25 | ||
| Norovirus GV | ||||
| MuNoVF1 | AGATCAGCTTAAGCCCTATTCAGAAC | 14 | ||
| MuNoVR1 | CAAGCTCTCACAAGCCTTCTTAAA | 14 | ||
| MuNoVP1 | VIC-TGGCCAGGGCTTCTGT-MGB | 14 | ||
| Hepatitis G | ||||
| HepF (5'-NCR forward primer) | CGGCCAAAAGGTGGTGGATG | 19 | ||
| HepR (5'-NCR reverse primer) | CGACGAGCCTGACGTCGGG | 19 | ||
| HepP (hepatitis G TaqMan Probe | 6FAM-AGGTCCCTCTGGCGCTTGTGGCGAG-TAMRA | 1 | ||
Table 1. Primers and TaqMan Probes for Virus Detection by RT-qPCR.
(1) Method 1615 primer and probe names are the first three letters of the virus name concatenated to F, R, or P for forward, reverse, and probe. The norovirus genogroup is designated by adding GI and GII to the names. The two norovirus GI primer sets also are distinguished using A and B. Primer and probe names from the primary references are given in parentheses.
(2) The orientation of primer and probe sequences is 5’ to 3’. The following degenerate base indicators are used: N–a mixture of all four nucleotides; R–A + G; Y–T + C; W–A + T; and I–inosine.
| Ingredient | Volume per reaction (μl) (2) | Final concentration | Volume per Master Mix (μl) (3) |
| RT Master Mix 1 | |||
| Random primer | 0.8 | 10 ng/μl (c. 5.6 μM) | 84 |
| Hepatitis G Armored RNA (4) | 1 | 105 | |
| PCR grade water | 14.7 | 1543.5 | |
| Total | 16.5 | 1732.5 | |
| RT Master Mix 2 | |||
| 10x PCR Buffer II | 4 | 10 mM tris, pH 8.3, 50 mM KCl | 420 |
| 25-mM MgCl2 | 4.8 | 3 mM | 504 |
| 10-mM dNTPs | 3.2 | 0.8 mM | 336 |
| 100-mM DTT | 4 | 10 mM | 420 |
| RNase Inhibitor | 0.5 | 0.5 units/μl | 52.5 |
| SuperScript II RT | 0.3 | 1.6 units/μl | 31.5 |
| Total | 16.8 | 1764 | |
Table 2. RT Master Mix 1 and 2 (1).
(1) Prepare RT Master Mixes in a clean room, i.e., a room where molecular and microbiological procedures are not performed.
(2) The final RT assay volume is 40-µl.
(3) The volumes show are based on 105 assays. This is sufficient for a 96-well PCR plate with the extra assays added to account for losses. The amount may be scaled up or down according to the number of samples and controls that will be analyzed.
(4) Determine the amount of hepatitis G reagent to include in the RT Master Mix 1 as described in supplemental materials Step S4.
| Ingredient | Volume per reaction (μl) (2) | Final concentration | Volume per Master Mix (μl) (3) |
| 2x LightCycler 480 Probes Master Mix | 10 | Proprietary | 1050 |
| ROX reference dye (4) | 0.4 | 0.5 mM | 42 |
| PCR grade water | 1 | 105 | |
| 10 μM EntF | 0.6 | 300 nM | 63 |
| 10 μM EntR | 1.8 | 900 nM | 189 |
| 10 μM EntP | 0.2 | 100 nM | 21 |
| Total | 14 | 1470 |
Table 3. PCR Master Mix for Enterovirus (EV) Assay(1).
(1) Prepare all PCR Master Mixes in a clean room.
(2) The final qPCR assay volume is 20 µl.
(3) The volumes show are based on 105 assays. This is sufficient for a 96-well PCR plate with the extra assays added to account for losses. The amount may be scaled up or down according to the number of samples and controls that will be analyzed.
(4) Substitute PCR grade water for this reagent when using instruments that do not require it.
| Ingredient | Volume per reaction (μl) (2) | Final concentration | Volume per Master Mix (μl) (3) |
| 2x LightCycler 480 Probes Master Mix | 10 | Proprietary | 1050 |
| ROX reference dye (4) | 0.4 | 0.5 mM | 42 |
| PCR grade water | 1.4 | 147 | |
| 10 μM NorGIAF | 1 | 500 nM | 105 |
| 10 μM NorGIAR | 1 | 500 nM | 105 |
| 10 μM NorGIAP | 0.2 | 100 nM | 21 |
| Total | 14 | 1470 |
Table 4. PCR Master Mix for Norovirus GIA (NoV GIA) Assay(1).
See Table 3 for footnotes (1)–(4).
| Ingredient | Volume per Reaction (μl) (2) | Final Concentration | Volume per Master Mix (μl) (3) |
| 2x LightCycler 480 Probes Master Mix | 10 | Proprietary | 1050 |
| ROX reference dye (4) | 0.4 | 0.5 mM | 42 |
| PCR grade water | 0.3 | 31.5 | |
| 10 μM NorGIBF | 1 | 500 nM | 105 |
| 10 μM NorGIBR | 1.8 | 900 nM | 189 |
| 10 μM NorGIBP | 0.5 | 250 nM | 52.5 |
| Total | 14 | 1470 |
Table 5. PCR Master Mix for Norovirus GIB (NoV GIB) Assay(1).
See Table 3 for footnotes (1)–(4).
| Ingredient | Volume per Reaction (μl) (2) | Final Concentration | Volume per Master Mix (μl) (3) |
| 2x LightCycler 480 Probes Master Mix | 10 | Proprietary | 1050 |
| ROX reference dye (4) | 0.4 | 0.5 mM | 42 |
| PCR grade water | 0.3 | 31.5 | |
| 10 μM NorGIIF | 1 | 500 nM | 105 |
| 10 μM NorGIIR | 1.8 | 900 nM | 189 |
| 10 μM NorGIIP | 0.5 | 250 nM | 52.5 |
| Total | 14 | 1470 |
Table 6. PCR Master Mix for Norovirus GII (NoV GII) Assay(1).
See Table 3 for footnotes (1)–(4).
| Ingredient | Volume per Reaction (μl) (2) | Final Concentration | Volume per Master Mix (μl) (3) |
| 2x LightCycler 480 Probes Master Mix | 10 | Proprietary | 1050 |
| ROX reference dye (4) | 0.4 | 0.5 mM | 42 |
| PCR grade water | 0.3 | 31.5 | |
| 10 μM MuNoVF1 | 1 | 500 nM | 105 |
| 10 μM MuNoVR1 | 1.8 | 900 nM | 189 |
| 10 μM MuNoVP1 | 0.5 | 250 nM | 52.5 |
| Total | 14 | 1470 |
Table 7. PCR Master Mix for Murine Norovirus Assay(1).
See Table 3 for footnotes (1)–(4).
| Ingredient | Volume per Reaction (μl) (2) | Final Concentration | Volume per Master Mix (μl)(3) |
| 2x LightCycler 480 Probes Master Mix | 10 | Proprietary | 1050 |
| ROX reference dye (4) | 0.4 | 0.5 mM | 42 |
| PCR grade water | 1.4 | 147 | |
| 10 μM HepF | 1 | 500 nM | 105 |
| 10 μM HepR | 1 | 500 nM | 105 |
| 10 μM HepP | 0.2 | 100 nM | 21 |
| Total | 14 | 1470 |
Table 8. PCR Master Mix for Hepatitis G (HGV) Assay(1).
See Table 3 for footnotes (1)–(4).
| Standard Curve Concentration | Genomic Copies per RT-qPCR Assay (1, 2) |
| 2.5 x 10⁸ | 502,500 |
| 2.5 x 10⁷ | 50,250 |
| 2.5 x 10⁶ | 5,025 |
| 2.5 x 10⁵ | 502.5 |
| 2.5 x 10⁴ | 50.25 |
| 2.5 x 10³ | 5.025 |
Table 9. Standard Curve Genomic Copies.
(1) Identify the standard curve wells as standards and place the genomic copies per RT-qPCR assay values in the appropriate place in the thermocycler software.
(2) An acceptable standard curve will have an efficiency of 70%–110%, an R2 value >0.97, and an overall standard deviation of <0.5 for norovirus and <1.0 for enterovirus.
| Criteria | Acceptable Value | |
| Norovirus | Enterovirus | |
| Overall Standard Deviation | <0.5 | <1.0 |
| R2 | >0.97 | >0.97 |
| Efficiency | 70% to 115% | 70% to 115% |
Table 10. Standard Curve Acceptance Criteria(1).
(1) Standard curves with % Efficiencies of 70%–110% are acceptable, but values in the 90%–115% range are ideal. Values less than 90% may indicate pipetting or dilution errors.
| QA Component | Mean Recovery Range (%) | Coefficient of Variation (%) |
| Lab Reagent Blank; negative PT or PE samples | 0 | N/A(1) |
| Lab Fortified Blank; Lab Fortified Sample Matrix | 5-200 | N/A |
| Positive PT and PE samples | 15-175 | ≤130 |
Table 11. Method 1615 Performance Criteria.
(1) Not applicable.
| Media | Composition |
| 0.15 M sodium phosphate, pH 7.0–7.5 | Prepare 0.15 M sodium phosphate by dissolving 40.2 g of sodium phosphate, dibasic (Na2HPO4 · 7H2O) in a final volume of 1 L dH2O. Adjust the pH to 7.0–7.5 with HCl. Autoclave at 121 °C, 15 psi for 15 min. Store sodium phosphate solution at RT for up to 12 months. |
| 5% BSA | Prepare by dissolving 5 g of BSA in 100 ml of dH2O. Sterilize by passing the solution through a 0.2-μm sterilizing filter. |
| PBS, 0.2% BSA | Prepare by adding 4 ml of 5% BSA to 96 ml of PBS. Sterilize by passing the solution through a 0.2-μm sterilizing filter. |
| TSM III buffer | Dissolve 1.21 g Trisma base, 5.84 g NaCl, 0.203 g MgCl2, 1 ml Prionex gelatin, and 3 ml Microcide III in 950 ml reagent grade water. Adjust the pH to 7.0 and then bring the final volume to 1 L. Sterilize by passing the solution through a 0.2-μm sterilizing filter. |
| 0.525% sodium hypochlorite (NaClO) | Prepare a 0.525% NaClO solution by diluting household bleach 1:10 in dH2O. Store 0.525% NaClO solutions for up to 1 week at RT. |
| 1-M sodium thiosulfate (Na2S2O3) pentahydrate | Prepare a 1 M solution by dissolving 248.2 g of Na2S2O3 in 1 L of dH2O. Store sodium thiosulfate for up to 6 months at RT. |
Table 12. Table of Media.
Discussion
Large-scale national studies of viral contamination of source and drinking waters require the use of multiple analytical laboratories. Under these conditions a standard method is needed to ensure that the data generated by the multiple laboratories is comparable. There are many published molecular methods for virus detection, but very few standardized molecular methods. EPA Method 1615 is a standardized method specifically designed for detection of enterovirus and norovirus in water matrices by RT-qPCR. Standardized molecular methods are available for virus detection in foods (CEN/ISO TS 15216-1 and CEN/ISO TS 15216-2; April 7, 2013)16,17 and have been applied to the detection of hepatitis A virus and norovirus in spring water16. All standard methods must include quality performance controls and criteria to minimize inter- and intra-laboratory variation and false positive data due to laboratory contamination. To further reduce false data, EPA Method 1615 follows EPA’s guidance on molecular methods,18 which stipulates separation of work during processing and one way work flow. It includes a hepatitis G1,19 internal control and procedures to minimize false negative results due to inhibitors of RT-qPCR15. It uses quantitative assays along with standardized volumes of both water sampled and water analyzed so that all field data is expressed in genomic copies per liter of the field or drinking water sampled. Although efficient single tube (one-step) RT-PCR assays are commercially available, the method intentionally uses separate assays. This has the disadvantage of minimizing the amount of sample that can be assayed in each reaction, but gives greater flexibility in use of multiple primer sets. RT-qPCR assays are limited by and only as good as the primers and probes used and likely no primer set will detect all virus variants within a group. The enterovirus primer set was chosen because it targets the conserved 5’-non coding region,20,21 detects a wide variety of enterovirus serotypes, and viruses detected by it are associated with health effects from consumption of untreated groundwaters1. Two primer sets are used for detection of genogroup I noroviruses22,23. The first was chosen due to the strong correlation between health effects in young children and detected virus1. The second genogroup I primer set and the primer set used for genogroup II noroviruses were chosen because they detect the widest variety of strains24,25.
In spite of the major advantages of qPCR and RT-qPCR procedures for detecting viral RNA in water, there are several limitations. First, both infectious and noninfectious virus particles, including those inactivated by disinfectants, can be amplified by these procedures. The results of Borchardt suggest that this is less of a problem for untreated groundwaters from aquifers similar to those in the communities studied than for disinfected surface waters1. For culturable viruses this problem can be overcome using PCR in combination with culture26,27. The problem has also been addressed for some viruses through use of nucleic acid cross-linking agents28-30. This latter approach is more effective for viruses inactivated by hypochlorite and not effective for those inactivated by UV.
A second limitation of these molecular procedures is that the volume of concentrated sample that can be assayed typically is much smaller than that used for culture procedures6,31. This problem is often handled by either substituting a polyethylene glycol-based procedure for the standard secondary concentration by organic flocculation, which allows the sample to be resuspended in a smaller volume, or by the addition of a tertiary sample concentration step6,32,33. Method 1615 uses centrifugal ultrafiltration to provide tertiary concentration. Centrifugal ultrafiltration removes water and components less than 30,000 Daltons resulting in both concentration of any virus in test samples and a reduction in small molecular weight inhibitors of molecular assays. This tertiary concentration step results in an overall concentration factor of >105 for any virus that was present in the water being tested.
A third limitation is the presence of inhibitors of molecular procedures in environmental samples. Although numerous approaches to remove inhibitors have been developed, no approach is effective for all water matrices and virus types6,34,35, making the use of internal controls designed to estimate the level of inhibition essential. The hepatitis G reagent used in this method satisfies this requirement by providing a constant level of viral RNA in all reactions and an RT-qPCR assay for estimating inhibition. When the best of the inhibitor removal approaches fail to remove inhibition, sample concentrates can be diluted as long as virus concentrations are higher than inhibitor concentrations14,15.
The standard curve procedure described herein has both advantages and a major limitation. An advantage is that the reagent used supplies all the necessary components in a single reagent, allowing a single control to be used for all assays. This reagent is especially an advantage for norovirus assays. Norovirus particles can only be obtained from infected individuals making it very difficult to obtain viral particles for use as standards. A more important advantage is that it provides an RNA standard for all targeted RNA viruses in one reagent, as having an RNA standard is essential for accurate quantification of RNA36. However, its ability to quantify virus accurately is limited by the fact that matrix effects are not taken into account. This means that genomic copy number values cannot be considered absolute and should only be considered in relative terms. It is recommended that a sufficient number of standard curve working stock aliquots (step 1.2) be prepared to cover complete studies. For example, each 250 µl aliquot provides sufficient reagent for 6 RT plates. If it is known that a study will require analysis of 500 samples, a minimum of 12 aliquots would be needed (500 samples/7 samples per RT plate/6 RT plates per aliquot).
EPA Method 1615 is a performance based method. Many manufacturers make equivalent reagents to those specified herein and these reagents can be substituted as long as the performance criteria are met. The standard curve, which also serves as a positive RT-qPCR control, is of value in troubleshooting performance issues. Performance can decline due to degradation of RNA, reagent shelf life, failure of freezers, instrument calibration, and technical error. Performance issues should be suspected if standard curves differ from that shown in Figure 4 or if they do not meet the performance specification for standard curves. The RT-qPCR assay is quite robust; complete failure is likely due to improper handling of RNA or technical error (e.g., a missing reagent). Great care should be taken in handling RNA samples between extraction and the RT step to reduce RNA degradation from ribonucleases.
Poliovirus recoveries from ground and reagent grade waters and murine norovirus recoveries from groundwater met the EPA Method 1615 performance acceptance criteria (Table 11) and are similar to those reported by others33,37,38. Murine norovirus recoveries from LFB samples were much lower than those of poliovirus and would not have met the poliovirus-specific acceptance criteria. The reasons for lower murine norovirus recovery from reagent grade water are unknown. Similar to the results herein, Karim and colleagues reported a recovery for norovirus GI.1 of 4% from tap water39. Lee et al.37 reported mean recoveries for murine norovirus and human norovirus GII.4 of 18% and 26% from distilled water using disc filters, respectively. Using similar conditions to Lee and colleagues, Kim and Ko observed recoveries of 46% and 43% for these viruses, respectively38. Gibbons et al.40 obtained around 100% recovery of human norovirus GII.4 from sea water, but Kim and Ko38 found that the addition of salt to distilled water at concentrations similar or higher than seawater significantly reduced recoveries of the murine virus and resulted in about a two-fold reduction in GII.4 recovery.
Disclosures
The authors have nothing to disclose.
Acknowledgements
The authors thank Dr. Eric Rhodes for preparing the clones used in the development of Standard curve reagent, Brian McMinn for assistance in sample processing, Larry Wymer for statistical analysis, Dr. Mark Borchardt, U.S. Department of Agriculture, Marshfield, WI, for supplying the Sabin poliovirus serotype 3 used in this study and Dr. H. W. Virgin, Washington University, St. Louis, MO, for murine norovirus. The authors also acknowledge Gretchen Sullivan for assistance in preparation of stock laboratory reagents, Dr. Mohammad Karim for propagation of murine norovirus stocks, and local private well owners and utilities for allowing us to collect water samples. Although this work was reviewed by EPA and approved for publication, it may not necessarily reflect official Agency policy. Mention of trade names or commercial products does not constitute endorsement or recommendation for use.
Materials
| Name | Company | Catalog Number | Comments |
|---|---|---|---|
| 1.5 ml tube chamber | Diversified Biotech | CHAM-3000 | |
| 1 °C cool brick | Diversified Biotech | BRIK-2501 | |
| 10x PCR Buffer II and 25-mM MgCl2 | Life Technologies | N8080130 | |
| -20 °C freezer | VWR | 97043-346 | Must be a manual defrost freezer |
| -70 °C or colder freezer | Thermo Scientific | MBF700LSAO-E | |
| 96-well chamber | Diversified Biotech | CHAM-1000 | |
| Absolute ethanol | Fisher Scientific | BP2818-100 | |
| Armored RNA EPA-1615 | Asuragen | Custom order | Used for quantifying the RT-qPCR assay |
| Armored RNA Hepatitis G virus | Asuragen | 42024 | |
| Autoclave | Steris | Amsco Lab Series | |
| Biosafety cabinet | NuAir Laboratory Equipment Supply | Labgard 437 ES | |
| Bovine serum albumin (BSA) | Affymetrix | 10856 | Crystalline grade or better |
| Buffer AVE | Qiagen | 1026956 | Carrier RNA dilution buffer |
| Buffer AVL | Qiagen | 19073 | Extraction buffer |
| Carrier RNA | Qiagen | Not applicable | Use carrier RNA supplied with Buffer AVL |
| Centrifuge bottles | Fisher Scientific | 05-562-23 or 05-562-26 | |
| Centrifuge rotors | Beckman Coulter | 339080, 336380 | |
| Cool safe box | Diversified Biotech | CSF-BOX | |
| Dithiothreitol (DTT) | Promega | P1171 | |
| LightCycler® 480 Probes Master kit | Roche Diagnostics | 4707494001 | |
| Microcentrifuge tubes | Fisher Scientific | 02-682-550 | Use ribonuclease- and deoxyribonuclease-free tubes with snap caps |
| Microcide III | Fitzgerald | 99R-103 | |
| Microseal 'A' film | Bio-Rad Laboratories | HSA5001 | Heat resistant |
| Microseal 'F' film | Bio-Rad Laboratories | MSA1001 | Freezer resistant |
| Mini-plate spinner | Labnet International | MPS1000 | |
| Multichannel pipette | Rainin | L8-20 | |
| Multi-tube chamber | Diversified Biotech | CHAM-5000 | |
| Optical reaction plate | Life Technologies | 4314320 | |
| PCR nucleotide mix | Promega | U1515 | |
| PCR plate | Bio-Rad Laboratories | HSS9601 | |
| PCR-grade water | Roche | 3315932001 | |
| Phosphate buffered saline (PBS) | U.S. Biological | D9820 | |
| Plate mixer | Scientific Industries | MicroPlate Genie | |
| Prionex gelatin | Sigma Aldrich | G0411 | |
| QIAamp DNA Blood Mini Kit | Qiagen | 51104 | Includes Buffers AW1 (first wash buffer), AW2 (second wash buffer), AE (elution buffer); ethanol must be added to Buffers AW1 and AW2 before use; Do not use Buffer AL supplied with the kit |
| Quantitative PCR thermal cycler | Life Technologies | 4351405 | |
| Random primer | Promega | C1181 | |
| Reagent Reservoir | Fisher Scientific | 21-381-27E | |
| Refrigerated centrifuge | Beckman Coulter | 367501 | |
| RNase Inhibitor | Promega | N2515 or N2615 | |
| ROX reference dye | Life Technologies | 12223 | |
| SuperScript II or III Reverse Transcriptase | Life Technologies | 18064-022 or 18080044 | |
| Surgical gloves | Fisher Scientific | 19-058-800 | |
| Thermal cycler | Life Technologies | 4314879 | |
| Trisma base | Sigma Aldrich | T1503 | |
| Vivaspin 20 centrifugal concentrator units | Sartorius-Stedim | VS2022 |
References
- Borchardt, M. A., Spencer, S. K., Kieke, B. A., Lambertini, E., Loge, F. J. Viruses in nondisinfected drinking water from municipal wells and community incidence of acute gastrointestinal illness. Environ. Health Perspect. 120 (9), 1272-1279 (2012).
- Ye, X. Y., et al. Real-time PCR detection of enteric viruses in source water and treated drinking water in Wuhan, China. Curr. Microbiol. 65 (3), 244-253 (2012).
- Williamson, W. M., et al. Enteric viruses in New Zealand drinking-water sources. Water Sci. Technol. 63 (8), 1744-1751 (2011).
- Lambertini, E., Borchardt, M. A., Kieke, B. A., Spencer, S. K., Loge, F. J. Risk of viral acute gastrointestinal illness from nondisinfected drinking water distribution systems. Environ. Sci. Technol. 46 (17), 9299-9307 (2012).
- Chigor, V. N., Okoh, A. I. Quantitative RT-PCR detection of hepatitis A virus, rotaviruses and enteroviruses in the Buffalo River and source water dams in the Eastern Cape Province of South Africa. Int. J. Environ. Res. Public Health. 9 (11), 4017-4032 (2012).
- Fout, G. S., Martinson, B. C., Moyer, M. W., Dahling, D. R. A multiplex reverse transcription-PCR method for detection of human enteric viruses in groundwater. Appl. Environ. Microbiol. 69 (6), 3158-3164 (2003).
- Hewitt, J., Bell, D., Simmons, G. C., Rivera-Aban, M., Wolf, S., Greening, G. E. Gastroenteritis outbreak caused by waterborne norovirus at a New Zealand ski resort. Appl. Environ. Microbiol. 73 (24), 7853-7857 (2007).
- Jack, S., Bell, D., Hewitt, J. Norovirus contamination of a drinking water supply at a hotel resort. New Zealand Med. J. 126 (1387), 98-107 (2013).
- Anderson, A. D., et al. A waterborne outbreak of Norwalk-like virus among snowmobilers-Wyoming, 2001. J. Infect. Dis. 187 (2), 303-306 (2003).
- Parshionikar, S. U., et al. Waterborne outbreak of gastroenteritis associated with a norovirus. Appl. Environ. Microbiol. 69 (9), 5263-5268 (2003).
- U.S. Environmental Protection Agency Office of Water. 820-F-12-058: Recreational Water Quality Criteria. , 1-63 (2012).
- Wade, T. J., et al. Rapidly measured indicators of recreational water quality and swimming-associated illness at marine beaches: a prospective cohort study. Environ. Health. 9, 66(2010).
- Fout, G. S., et al. Method 1615: Measurement of enterovirus and norovirus occurrence in water by culture and RT-qPCR (EPA/600/R-10/181). , U. S. Environmental Protection Agency. 1-91 (2012).
- Cashdollar, J. L., et al. Development and Evaluation of EPA Method 1615 for Detection of Enterovirus and Norovirus in Water. Appl. Environ. Microbiol. 79 (1), 215-223 (2013).
- Gibson, K. E., Schwab, K. J., Spencer, S. K., Borchardt, M. A. Measuring and mitigating inhibition during quantitative real time PCR analysis of viral nucleic acid extracts from large-volume environmental water samples. Water Res. 46 (13), 4281-4291 (2012).
- Fuentes, C., et al. Standardized multiplex one-step qRT-PCR for hepatitis A virus, norovirus GI and GII quantification in bivalve mollusks and water. Food Microbiol. 40, 55-63 (2014).
- Coudray, C., Merle, G., Martin-Latil, S., Guillier, L., Perelle, S. Comparison of two extraction methods for the detection of hepatitis A virus in lettuces using the murine norovirus as a process control. J. Virol. Methods. 193 (1), 96-102 (2013).
- Sen, K., et al. EPA 815-B-04-001: Quality assurance/quality control guidance for laboratories performing PCR analyses on environmental samples. , U.S. Environmental Protection Agency. 1-56 (2004).
- Schlueter, V., Schmolke, S., Stark, K., Hess, G., Ofenloch-Haehnle, B., Engel, A. M. Reverse transcription-PCR detection of hepatitis G virus. J. Clin. Microbiol. 34 (11), 2660-2664 (1996).
- De Leon, R., Shieh, C., Baric, R. S., Sobsey, M. D. Detection of enteroviruses and hepatitis A virus in environmental samples by gene probes and polymerase chain reaction. Proc. Water Qual. Technol. Conf. 1990 Nov 11-15, , 833-853 (1990).
- Monpoeho, S., et al. Quantification of enterovirus RNA in sludge samples using single tube real-time RT-PCR. BioTechniques. 29 (1), 88-93 (2000).
- Jothikumar, N., et al. Rapid and sensitive detection of noroviruses by using TaqMan-based one-step reverse transcription-PCR assays and application to naturally contaminated shellfish samples. Appl. Environ. Microbiol. 71 (4), 1870-1875 (2005).
- da Silva, A. K., et al. Evaluation of removal of noroviruses during wastewater treatment, using real-time reverse transcription-PCR: different behaviors of genogroups I and II. Appl. Environ. Microbiol. 73 (24), 7891-7897 (2007).
- Butot, S., et al. Evaluation of various real-time RT-PCR assays for the detection and quantitation of human norovirus. J. Virol. Methods. 167 (1), 90-94 (2010).
- Loisy, F., et al. Real-time RT-PCR for norovirus screening in shellfish. J. Virol. Methods. 123 (1), 1-7 (2005).
- Reynolds, K. A., Gerba, C. P., Pepper, I. L. Detection of infectious enteroviruses by an integrated cell culture-PCR procedure. Appl. Environ. Microbiol. 62 (4), 1424-1427 (1996).
- Ming, H. X., Zhu, L., Zhang, Y. Rapid quantification of infectious enterovirus from surface water in Bohai Bay, China using an integrated cell culture-qPCR. Mar. Pollut. Bull. 62 (10), 2047-2054 (2011).
- Parshionikar, S., Laseke, I., Fout, G. S. Use of propidium monoazide in reverse transcriptase PCR to distinguish between infectious and noninfectious enteric viruses in water samples. Appl. Environ. Microbiol. 76 (13), 4318-4326 (2010).
- Sanchez, G., Elizaquivel, P., Aznar, R. Discrimination of infectious hepatitis A viruses by propidium monoazide real-time RT-PCR. Food Environ. Virol. 4 (1), 21-25 (2012).
- Kim, S. Y., Ko, G. Using propidium monoazide to distinguish between viable and nonviable bacteria, MS2 and murine norovirus. Lett. Appl. Microbiol. 55 (3), 182-188 (2012).
- Fout, G. S., Schaefer, F. W. 3rd, Messer, J. W., Dahling, D. R., Stetler, R. E. EPA/600/R-95/178: ICR Microbial Laboratory Manual, I.1-ApD-23. , U.S. Environmental Protection Agency. (1996).
- Abbaszadegan, M., Stewart, P., LeChevallier, M. A strategy for detection of viruses in groundwater by PCR. Appl. Environ. Microbiol. 65 (2), 444-449 (1999).
- Lambertini, E., et al. Concentration of enteroviruses, adenoviruses, and noroviruses from drinking water by use of glass wool filters. Appl. Environ. Microbiol. 74 (10), 2990-2996 (2008).
- Rodriguez, R. A., Thie, L., Gibbons, C. D., Sobsey, M. D. Reducing the effects of environmental inhibition in quantitative real-time PCR detection of adenovirus and norovirus in recreational seawaters. J. Virol. Methods. 181 (1), 43-50 (2012).
- Iker, B. C., Bright, K. R., Pepper, I. L., Gerba, C. P., Kitajima, M. Evaluation of commercial kits for the extraction and purification of viral nucleic acids from environmental and fecal samples. J. Virol. Methods. 191 (1), 24-30 (2013).
- Fey, A., et al. Establishment of a real-time PCR-based approach for accurate quantification of bacterial RNA targets in water, using Salmonella as a model organism. Appl. Environ. Microbiol. 70 (6), 3618-3623 (2004).
- Lee, H., et al. Evaluation of electropositive filtration for recovering norovirus in water. J. Water Health. 9 (1), 27-36 (2011).
- Kim, M., Ko, G. Quantitative characterization of the inhibitory effects of salt, humic acid, and heavy metals on the recovery of waterborne norovirus by electropositive filters. J. Water Health. 11 (4), 613-622 (2013).
- Karim, M. R., Rhodes, E. R., Brinkman, N., Wymer, L., Fout, G. S. New electropositive filter for concentrating enteroviruses and noroviruses from large volumes of water. Appl. Environ. Microbiol. 75 (8), 2393-2399 (2009).
- Gibbons, C. D., Rodriguez, R. A., Tallon, L., Sobsey, M. D. Evaluation of positively charged alumina nanofibre cartridge filters for the primary concentration of noroviruses, adenoviruses and male-specific coliphages from seawater. J. Appl. Microbiol. 109 (2), 635-641 (2010).
Reprints and Permissions
