Coxiella burnetii is an obligate intracellular Gram-negative bacterium responsible for the zoonotic disease Q fever. Here we describe methods for the generation of Coxiella fluorescent transposon mutants as well as the automated identification and analysis of the resulting internalization, replication and cytotoxic phenotypes.
Method Article
Generation and Multi-phenotypic High-content Screening of Coxiella burnetii Transposon Mutants
In This Article
Summary
Abstract
Invasion and colonization of host cells by bacterial pathogens depend on the activity of a large number of prokaryotic proteins, defined as virulence factors, which can subvert and manipulate key host functions. The study of host/pathogen interactions is therefore extremely important to understand bacterial infections and develop alternative strategies to counter infectious diseases. This approach however, requires the development of new high-throughput assays for the unbiased, automated identification and characterization of bacterial virulence determinants. Here, we describe a method for the generation of a GFP-tagged mutant library by transposon mutagenesis and the development of high-content screening approaches for the simultaneous identification of multiple transposon-associated phenotypes. Our working model is the intracellular bacterial pathogen Coxiellaburnetii, the etiological agent of the zoonosis Q fever, which is associated with severe outbreaks with a consequent health and economic burden. The obligate intracellular nature of this pathogen has, until recently, severely hampered the identification of bacterial factors involved in host pathogen interactions, making of Coxiella the ideal model for the implementation of high-throughput/high-content approaches.
Introduction
The emerging, endemic bacterium Coxiella burnetii is responsible for large outbreaks of Q fever, a debilitating flu-like zoonosis with severe health and economic impact1. The main reservoirs of Coxiella are domestic and farm animals, and it is estimated that more than 90% of dairy cattle in the US carry C. burnetii2. Humans are accidental hosts that are infected by inhalation of contaminated aerosols. Human Q fever manifests either as an acute or chronic disease, which may have fatal complications with a mortality rate reaching 65%1,3. With an infectious dose of 1 - 10 organisms, Coxiella is the most infectious pathogen known and it has been investigated as a potential bio weapon4. The recent explosive outbreak of Q fever in the Netherlands (2007 - 2010), with cases escalating from 182 to more than 2,000 per year, stands as an example of the severe virulence of this pathogen5.
The remarkable efficiency of Coxiella infections is likely associated with its resistance to environmental stress, combined with its unique adaptation to host cells. Indeed, Coxiella is present in the environment in the form of metabolically inactive small cell variants (SCV), which are remarkably resistant to several harsh conditions (desiccation, temperature, etc.). SCVs are up taken by phagocytic cells via αVβ3 integrins6 while invasion of non-phagocytic cells is mediated by the Coxiella adhesion/invasion OmpA7 and a yet unidentified receptor. Following uptake, Coxiella resides in tight-fitting vacuoles, positive for the early endosomal markers Rab5 and EEA18. Bacteria respond to endosomal acidification by converting to metabolically active large cell variants (LCVs) and activating a Dot/Icm type 4 secretion system (T4SS)9, highly homologous to that of Legionella pneumophila10. The secretion of Dot/Icm effectors allow Coxiella to generate a large, LAMP1-positive acidic compartment containing active lysosomal enzymes where bacteria can thrive and actively protect infected cells from apoptosis11. Hence, the intracellular cycle of Coxiella is controlled by the Dot/Icm-mediated translocation of bacterial effectors12, however, the microbial factors involved in host cell invasion, bacterial replication and dissemination of the infection remain largely unknown.
Combining transposon mutagenesis and fluorescence-based assays, we are developing unbiased approaches for the simultaneous identification of bacterial factors involved in the main steps of Coxiella infections: 1) internalization within host cells, 2) intracellular replication, 3) cell-to-cell spread, and 4) persistence. To date, we have screened over 1,000 mutations in 500 Coxiella coding sequences, which provided us with unprecedented insights into the host-pathogen interactions that regulate Coxiella pathogenesis7. Of note, this approach can be applied to the study of other intracellular pathogens that share cell biology features with Coxiella.
Protocol
1. Generation of a library of GFP-tagged Coxiella transposon mutants
Manipulate Coxiella burnetii RSA439 NMII in a biosafety containment level 2 (BSL-2) in a microbial safety cabinet (MSC) in compliance with local rules. If compatible with the bacterial model used, repeat steps from 1.4.1 to 1.4.4 to increase the probability of obtaining clonal mutants. A typical mutant library is composed (at least) of a number of mutants that is equal to three times the number of coding sequences annotated in the genome of the organism used.
- Preparation of electrocompetent Coxiella RSA439 NMII:
- Prepare 1x ACCM-213: 13.4 mM citric acid, 16.1 mM sodium citrate, 3.67 mM potassium phosphate, 1 mM magnesium chloride, 0.02 mM calcium chloride, 0.01 mM iron sulfate, 125.4 mM sodium chloride, 1.5 mM L-cysteine, 0.1 g/L Bacto Neopeptone, 2.5 g/L casamino acids, 1 g/L methyl beta cyclodextrin, 125 ml/L RPMI. Adjust pH to 4.75 and filter sterilize (do not autoclave). Note: Liquid ACCM-2 is stable at 4 °C for approximately 1 month.
- Inoculate 100 ml of ACCM-2 with 2 x 10⁶ genome equivalent (GE)/ml of Coxiella RSA439 NMII (from a bacterial stock previously generated and quantified as in step 1.5) from -80 °C stocks and distribute the bacterial suspension in 75 cm2 cell culture flasks with vented caps (10 - 15 ml of bacterial suspension per flask). Grow for 7 days at 37 °C in a humidified atmosphere of 5% CO2 and 2.5% O2.
- Pool the resulting bacterial suspension in 50 ml tubes and centrifuge at 3,900 x g for 1 hr at 4 °C.
- Discard the supernatant and resuspend the pellet in 30 ml of 10% glycerol. Centrifuge at 3,900 x g for 1 hr at 4 °C.
- Resuspend the pellet in an adequate volume of 10% glycerol (typically 2 ml) and aliquot 50 µl in 500 µl tubes. Keep resuspended bacteria on ice during the whole process. Note: At this stage, bacteria are electrocompetent and one aliquot is sufficient to perform one electroporation. The bacterial suspensions can be stored at -80 °C for 6 months or be directly used for electroporation of plasmid DNA.
- Electroporation of competent Coxiella with transposon- and transposase-encoding plasmids:
Note: for the following protocol, the transposable element and the transposase are encoded by two different plasmids (pITR-CAT-GFP and pUC19-Himar1C9, respectively)7. Both plasmids lack a Coxiella-specific replication origin, making them suicide plasmids when electroporated in Coxiella. This ensures stable transposon insertions. The transposable element contains a Chloramphenicol resistance cassette under the regulation of the Coxiella promoter p1169 for selection and the gfp gene under the regulation of the Coxiella promoter p311 to tag the generated mutants with GFP.- Pre-cool a 0.1 cm electroporation cuvette for 10 min on ice. Mix 50 µl of electrocompetent Coxiella with 10 µg transposon plasmid and 10 µg of transposase plasmid7. Ensure that plasmid concentration is higher than 500 µg/ml to minimize dilution of the glycerol.
- Electroporate using the following setup: 18 kV, 500 Ω, 25 µF. Ensure that the resulting time constant is comprised between 9 and 13 msec.
- Immediately add 950 µl of RPMI, resuspend the electroporated bacteria and transfer to a screw cap tube and keep at room temperature.
- Take 200 µl of the electroporated bacteria and add to 3 ml of ACCM-2 supplemented with 1% heat-inactivated Fetal Bovine Serum (FBS) into 6-well plates. Add 88 µl of DMSO to the remaining volume of electroporated bacteria (to reach a final concentration of 10% DMSO) and store at -80 °C.
- Selection of the transposon mutants:
- Incubate the 6-well plates inoculated as described above (1.2.4) overnight at 37 °C in a humidified atmosphere of 5% CO2 and 2.5% O2. Add the appropriate antibiotics (375 µg/ml kanamycin or 3 µg/ml chloramphenicol). Incubate the bacterial culture for 3 additional days in the conditions described above.
- Isolation of individual mutants:
- Preparation of solid ACCM-2 plates and plating of Coxiella transposon mutants
Note: Following instructions are for 1 Petri dish, several dilutions of bacterial cultures have to be tested to assess the optimal inoculation volume for colony isolation.- Heat 10.5 ml of 0.5% agarose in a microwave and let it cool in a 55 °C water bath. Heat 11.25 ml of 2x ACCM-2 (pH 4.75) at 37 °C.
- Prepare bottom agarose:
- Mix 10 ml of melted 0.5% agarose with 10 ml of 2x ACCM-2 and add the appropriate antibiotics (375 µg/ml kanamycin or 3 µg/ml chloramphenicol).
- Pour immediately into the Petri dish. Keep the Petri dish unlidded, let the medium cool for 30 min and air-dry for 20 min.
- Prepare top agarose:
- Mix 1.25 ml of 2x ACCM-2 with 0.75 ml of water in a 5 ml polystyrene tube, add the appropriate antibiotics (375 µg/ml kanamycin or 3 µg/ml chloramphenicol) and incubate at 37 °C.
- Add the bacterial culture (typically 1 to 100 µl) and vortex for 5 sec.
- Add 0.5 ml of melted agarose, mix and immediately pour on the bottom agarose.
- Allow to cool for 20 min, replace the lid on the Petri dish and incubate at 4 °C for 20 min to facilitate agarose solidification.
- Air dry for 20 min unlidded in a MSC. Grow plates at 37 °C in a humidified atmosphere of 5% CO2 and 2.5% O2 for 6 to 7 days.
- Add DMSO to the remaining bacterial cultures in order to reach a final concentration of 10% DMSO and store at -80 °C.
- Assess the optimal dilution as follows: ensure that colonies are 0.5 to 1 mm in diameter and are properly isolated to avoid cross-contamination. Thaw remaining bacterial cultures from point 1.4.2 and plate at the appropriate dilution on ACCM-2 agar as described in 1.4.1.2 and 1.4.1.3. Incubate for 6 to 7 days as described in 1.4.1.3.5.
- Once colonies are detectable, collect them by cutting the end of a 1 ml tip, picking the plug containing isolated colonies and dispersing the colony by pipetting in 1.5 ml of ACCM-2 containing the appropriate antibiotics (375 µg/ml kanamycin or 3 µg/ml chloramphenicol) in a 24-well plate. Amplify individual colonies for 6 days in the conditions described in 1.3.1. On day 3 of incubation, disperse the bacterial clumps by pipetting each culture.
- Store each mutant suspension in 2D barcoded screwcap tubes in 96-well plates in 10% DMSO at -80 °C.
- Preparation of solid ACCM-2 plates and plating of Coxiella transposon mutants
- Evaluation of bacterial concentration:
Note: the following protocol can be applied to obtain the growth curves of bacterial mutants replicating in axenic medium (see 1.4.4).- Standard curve preparation:
- Prepare a 2 µg/ml stock solution of dsDNA (typically a random plasmid of known size and concentration) in 1x Tris-EDTA (TE). Prepare 10-fold serial dilutions from the stock solution to obtain concentrations ranging from 2 µg/ml to 2 ng/ml. Dispense 50 µl of each concentration to single wells of a 96-well microplate with black walls and bottom (see Table of Materials).
- Dilute the dsDNA quantitation reagent 1:200 in 1x TE buffer and add 55 µl of the diluted reagent to each sample in the 96-well microplate. Mix well using a plate shaker and incubate for 2 to 5 min at room temperature, in the dark.
- Measure the samples fluorescence using a fluorescence microplate reader and filters for standard fluorescein wavelengths (excitation ~480 nm, emission ~520 nm).
- Plot the plasmid concentration range against the fluorescence intensity readings.
- Bacterial suspension quantitation:
- Dispense 5 µl of 10% Triton X-100 per well in a 96-well microplate with black walls and bottom (see Table of Materials). Add 50 µl of the bacterial suspensions to each well and incubate 10 min at room temperature, on a plate shaker.
- Dilute the dsDNA quantitation reagent 1:200 in 1x TE buffer and add 55 µl of the diluted reagent to each sample in the 96-well microplate. Mix well using a plate shaker and incubate for 2 to 5 min at room temperature, in the dark.
- Measure the samples fluorescence using a fluorescence microplate reader and filters for standard fluorescein wavelengths (excitation ~480 nm, emission ~520 nm).
- To obtain the bacterial DNA concentration, plot the fluorescence readings in the chart obtained at point 1.5.1.4. Divide the DNA concentration by the mass of the Coxiella genome (2.2 fg) to obtain bacterial concentrations. Express results in Genome Equivalent/ml.
- Discard mutants exhibiting a significant growth defect in ACCM-2.
- Standard curve preparation:
2. Single Primer Colony PCR, Sequencing, and Annotation
Note: the following protocol is for DNA amplification of 96 samples, a multichannel pipette is recommended for the following steps. Column purification of PCR products using magnetic beads and DNA sequencing with a transposon-specific primer (2.3) are subcontracted to an external company.
- Ensure that the amplification primer is designed in order to hybridize between 100 and 200 base pairs upstream of the inverted tandem repeat (ITR), to obtain PCR products covering the transposon insertion site on Coxiella genome. Prepare 3 ml of PCR mix (1x high fidelity buffer, 200 µM dNTPs, 1 µM amplification primer, 20 U/ml high fidelity DNA polymerase) and dispense 29 µl per well in a 96-well PCR plate set on ice. Transfer 1 µl of each mutant in stationary phase in ACCM-2 to the PCR mix.
- Run PCR with initial denaturation (98 °C, 1 min), 20 high stringency cycles (98 °C, 10 sec; 50 °C, 30 sec; 72 °C, 90 sec), 30 low stringency cycles (98 °C, 10 sec; 30 °C, 30 sec; 72 °C, 90 sec) and 30 high stringency cycles (98 °C, 10sec; 50 °C, 30 sec; 72 °C, 90 sec) followed by a final extension at 72 °C for 7 min.
- Purify PCR products using magnetic beads and sequence DNA with a transposon-specific primer. Design the transposon-specific primer with a predicted melting temperature comprised between 50°C and 75°C, a GC content between 40% and 60 %, a length between 18 and 25 nucleotides and an annealing site downstream of the amplification primer hybridization site and at least 100 base pairs upstream of the first base pair of the transposon ITR.
- Using sequence analysis software, load the complete, annotated genome of Coxiella burnetii 493 NMI. Use the “align to reference” function to load and align (blastn) the sequencing results and determine the site of transposition. Discard mutants with non-matching and/or displaying double reads.To monitor the saturation of the mutant library, keep a record of the occurrence of multiple transposon insertions at the same site.
3. Eukaryotic Cells Challenge with Coxiella Mutants and Monitoring of Intracellular Growth
Note: A multichannel pipette is recommended for the following steps. Infections were performed in triplicates in sterile 96-well microplates with black walls and flat transparent bottom. wt Coxiella burnetii expressing GFP14 was provided by Dr. Robert Heinzen.
- Grow Vero cells in RPMI without phenol red supplemented with 10% fetal bovine serum (FBS) in the absence of antibiotics (Complete RPMI media).
- The day before infection, wash Vero cells from a confluent or sub-confluent cell culture flask with 10 ml of PBS.
- Detach Vero cells by adding 1 ml of trypsin EDTA solution to the cell culture flask and incubate for 3 to 5 min at 37 °C in a humidified atmosphere of 5% CO2.
- Resuspend cells in 10 ml of Complete RPMI media. Count cells and prepare a cell suspension of 105 cells per ml.
- Dispense 100 µl of the cell suspension in each well of a black 96-well plate with flat transparent bottom.
- Centrifuge for 5 min at 400 x g at RT to facilitate cell adhesion at the bottom of the wells and incubate overnight at 37 °C in a humidified atmosphere of 5% CO2.
- Thaw the 96-well plates containing the Coxiella mutants at RT and dilute 150 µl of bacterial suspension in 300 µl of RPMI without phenol red and FBS in a deep well 96-well plate.
- Remove media from the microplate containing Vero cells and dispense 100 µl/well of diluted Coxiella mutants (MOI of 100). Use well A1 as negative (non-infected cells) control and wells A2 and A3 as positive controls (cells infected with wt Coxiella expressing GFP14 at multiplicities of infections (MOI) of 100 and 200).
- Centrifuge the plate for 10 min at 400 x g at RT using an aerosol-tight centrifuge plate holder.
- Incubate at 37 °C in a humidified atmosphere of 5% CO2 for 2 hr then replace bacteria-containing medium with 100 µl/well of fresh, complete RPMI medium.
- Measure GFP fluorescence everyday for 7 days using a fluorescence microplate reader and filters for standard fluorescein wavelengths (excitation ~480 nm, emission ~520 nm). To avoid interference due to condensation and signal dispersion in the culture medium, use bottom excitation and emission recording on the microplate reader.
4. Preparation of Samples for Automated Image Acquisition
Note: The procedure is for one 96-well plate, scale up volumes accordingly. Steps from 4.2 may take advantage of a plate washer.
- On the 7th day post infection, remove medium from plate and replace it with 50 µl/well of fresh, complete medium containing a cell permeable fluorescent dye at the appropriate dilution (usually 1:1,000, to be optimized according to the cell line used). Incubate cells for 30 - 60 min at 37 °C in a humidified atmosphere of 5% CO2.
- Replace medium with 50 µl/well of 4% paraformaldehyde (PFA) in PBS, incubate for 30 min at room temperature (RT) then remove the PFA-containing buffer and wash 3 times with PBS.
- Remove PBS and dispense 50 µl/well of blocking solution (0.5% bovine serum albumin, 50 mM NH4Cl in PBS, pH 7.4) supplemented with 0.05% saponin. Incubate at RT for 30 min.
- Replace blocking solution with 40 µl/well of fresh blocking solution supplemented with saponin (as above) and with an anti-LAMP1 antibody at a 1:500 dilution. Incubate plate for 30 min at RT.
- Remove blocking solution and wash the 96-well plate 5 times with 100 µl/well of PBS.
- Dispense 40 µl/well of blocking solution supplemented with saponin (as above), the appropriate fluorescently labeled secondary antibody (at a dilution of 1:1,000) to reveal the anti-LAMP1 antibody applied at step 4.4, and with Hoechst 33258 at 5 µg/ml. Incubate plate for 30 min at RT.
- Remove blocking solution and wash the 96-well plate 5 times with 100 µl/well of PBS. Leave the volume of PBS corresponding to the last wash in the 96-well plate, as the fixed cells should not dry out.
- Image the plate immediately or store plate at 4 °C, protected from light, for subsequent analysis.
5. Image Acquisition
- Acquire images in the GFP (488 nm, bacteria), Hoechst 33258 (350 nm, host cell nuclei), red (~555 nm, cell membrane marker) and far red (~615 nm, LAMP1) channels using an epifluorescence automated microscope equipped with a 20X objective. Acquire 21 independent fields per well in order to image a minimum of 5,000 cells per sample. Apply autofocusing using the host cell nuclei channel as a reference. When working with bacterial pathogens infecting a low percentage of host cells, users can adjust the number of independent fields imaged per well, in order to obtain a minimum of 500 infected cells to analyze.
6. Image Processing
Note: the following steps are specific for the use of the image analysis software CellProfiler. In all cases, the optimal algorithm for segmentation must be defined experimentally and the objects touching the border of the image should be eliminated with the appropriate function.
- Load all images in CellProfiler.
- Use the module “ImageMath” to subtract the GFP channel from the Hoechst channel, to avoid detection of Coxiella colonies (also labeled by Hoechst) as host cell nuclei in the following steps.
- Use the module “IdentifyPrimaryObjects” to segment host cell nuclei from the resulting image of step 6.2. Name the segmented objects “Nuclei”.
- Use the module “IdentifySecondaryObjects” to segment host cells from the 555 nm images using the nuclei detected at step 6.3 as seeds. Name the segmented objects “Cells”.
- (Optional) Use the module “IdentifyTertiaryObjects” to subtract nuclei identified at step 6.3 from cells identified at step 6.4. Name the segmented objects “Cytoplasm”.
- Use the module “EnhanceOrSuppressFeatures” on the 615 nm images to remove background and facilitate the following identification of LAMP1-positive compartments.
- Use the module “IdentifyPrimaryObjects” on the image obtained at step 6.6 to identify LAMP1-positive compartments. Name the segmented objects “Lysosomes”.
- Use the module “IdentifyPrimaryObjects” on the 488 nm image to identify Coxiella colonies. Name the segmented objects “Colonies”.
- Use the module “IdentifySecondaryObjects” on the 615 nm images to identify Coxiella-containing vacuoles using the Coxiella colonies detected at step 6.8 as seeds. Name the segmented objects “CCVs”.
- Use the module “MaskObjects” to select CCVs detected on cells (as cells touching the border of the image have been eliminated, some CCVs may be detected “outside” cells). Name the resulting objects “Filtered CCVs”.
- Use the module “MaskObjects” to select Colonies detected on cells (as cells touching the border of the image have been eliminated, some Colonies may be detected “outside” cells). Name the resulting objects “Filtered Colonies”.
- Use the module “MaskObjects” to associate Lysosomes to cells. Name the resulting objects “Filtered Lysosomes”.
- Use the module “MaskObjects” to select cells containing Coxiella colonies. Name the resulting objects “Infected Cells”.
- Use the module “Relate Objects” to set the objects “Filtered CCVs” as children of the parent objects “Cells”. This will allow counting the number of CCVs/Cell.
- Use the module “Relate Objects” to set the objects “Filtered Colonies” as children of the parent objects “Cells”. This will allow counting the number of Colonies/Cell.
- Use the module “Relate Objects” to set the objects “Filtered Lysosomes” as children of the parent objects “Cells”. This will allow counting the number of Lysosomes/Cell.
- Use the module “MeasureObjectSizeShape” to obtain a morphological analysis of Nuclei, Cells, Filtered CCVs, Filtered Colonies and Filtered Lysosomes
- Use the module “MeasureObjectIntensity” to quantify the GFP fluorescence associated with Filtered CCVs and estimate the efficiency of Coxiella replication within CCVs.
- Using the modules “OverlayOutlines” and “SaveImages” overlay the segmentation results and the original image for quality control.
- Use the module “ExportToSpreadsheet” to export all or a selection of the image analysis results.
- (Optional) Use the module “ExportToDatabase” to analyze results using the software CellProfiler Analyst.
7. Data Analysis
- For each parameter obtained, identify and eliminate outliers (due to errors in image segmentation) then calculate the mean values per mutant.
- Use Z-scores to identify significant phenotypes. Consider phenotypes with a Z-score > -2 as non significant, phenotypes with a Z-score between -2 and -4 as mild and phenotypes with a Z-score ≤ -4 as strong.
- Plot combinations of parameters according to experimental needs.
Results
Upon isolation of transposon mutants, single primer colony PCR is a robust, high-throughput method to identify the site of transposon insertion for each mutant. This approach derives from a typical nested PCR protocol but here a single primer hybridizes specifically and/or non-specifically to the template DNA depending on the stringency of the annealing temperature (Figure 1A). The typical PCR products consist of multiple DNA fragments, most of which are specific (Figure 1B). The use of a different sequencing primer that anneals right upstream of the transposon ITR, and downstream of the sequence recognized by the amplification primer provides specificity for the sequencing step (Figure 1C). Automated software for sequence analysis aligns the obtained sequences to the Coxiella genome providing the exact site of transposon insertions (Figure 1C). All transposon insertions can be then annotated on the Coxiella genome (Figure 1D).
Each Coxiella mutant is isolated and amplified axenically in ACCM-2 medium prior to either storage or screening. Figure 2 illustrates an example of 38 transposon mutants in 16 dot/icmCoxiella genes (Figure 2A). To assess the viability of Coxiella mutants, axenic growth curves are obtained by sampling bacterial cultures for 7 days post inoculation and applying the bacterial concentration assay described in 1.5 (Figurie 2B). Amplified mutants are then incubated with epithelial cells, in triplicate 96-well plates for 7 days. All Coxiella mutants generated being GFP-tagged, intracellular growth curves are obtained by measuring the GFP fluorescence intensity of every well, every 24 hr, and plotting the measured values as a function of time (Figure 2C).
Intracellular growth curves provide quantitative analysis of the phenotypes associated with every transposon insertion in the Coxiella genome. To add qualitative information about the same transposon mutants, we opted for automated image acquisition and analysis. Seven days post infection, plates are fixed, processed for immunofluorescence as described in 4 and analyzed using an automated, epifluorescence microscope as described in 5. Automated image analysis software such as CellProfiler (Broad Institute, www.cellprofiler.com) processes the acquired channels independently and segments identified objects for comparative analysis (Figure 3). This allows the identification and morphological characterization of host cell nuclei, cell contours, lysosomes and Coxiella colonies (Figure 3 top panels). Correlating Coxiella colonies with cells and lysosomes allows the identification and specific morphological analysis of Coxiella-containing vacuoles (which are LAMP1 positive, Figure 3 bottom left panel). Correlating Coxiella colonies with host cell contours allows the identification and specific morphological analysis of infected cells (Figure 3 bottom center panel). Finally, the 4 channels are merged for illustration and quality control purposes (Figure 3 bottom right panel).
Data obtained from automated image analysis can be plotted against each other to obtain “multi-phenotypic scatter plots”. As an example, in Figure 4A the average area (in μm2) of Coxiella colonies is plotted against the number of colonies per cell (Figure 4A), in order to identify mutations that affect intracellular replication of Coxiella (replication phenotype) and/or the capacity of bacteria to invade host cells (internalization phenotype). Statistical analysis was used to define regions in the resulting scatter plot corresponding to mild (-4 < Z-score ≤ -2) and severe (Z-score ≤ -4) phenotypes. Mutants were observed in 3 main clusters: mutations that resulted in a defective intracellular growth of Coxiella were grouped in the left-most part of the plot (Figure 4A, pink and red dots); mutations that affected Coxiella internalization in cells were grouped in the bottom part of the plot (Figure 4A, light and dark blue dots) and finally, green dots in the right-most region of the plot correspond to mutations resulting in non-significant phenotypes (Z-score > -2). Importantly, mutants that fail to replicate but are still able to invade host cells, are detected after 7 days of infection as single bacteria, or small colonies, adjacent to host cell nuclei (Figure 4C, second panel). Hence, the size of Coxiella “colonies” will be significantly affected but the number of infected cells will not vary as compared to WT Coxiella-infected cells. On the contrary, mutations that affect the capacity of Coxiella to invade host cells result in a decrease in the number of colonies/cell. When this number is significantly below 1, it indicates that, on average, there is a decrease in the overall number of infected cells. Alternatively, the average area (in μm2) of Coxiella colonies can be plotted against the number of host cells surviving infection (Figure 4B), to identify mutations that confer cytotoxicity to Coxiella (cytotoxic phenotype). As above, statistical analysis was used to define regions in the resulting scatter plot corresponding to mild (-4 < Z-score ≤ -2) and severe (Z-score ≤ -4) phenotypes. Most screened mutations did not significantly affect cell survival, regardless of bacterial replication within host cells (Figure 3B green dots). 37 mutations mildly affected host cell survival (Figure 3B, light red dots), and 7 mutations were particularly detrimental to host cell survival (Figure 3B, dark red dots). Please note that additional parameters obtained by the automated image analysis procedure can be used to derive other charts, according to experimental needs.

Figure 1: Sequencing and annotation of Coxiella transposon mutants. (A) Single primer colony PCR is used to amplify DNA fragments containing the site of transposon insertion. An amplification primer (Amp) is used both as a specific and non-specific primer depending on the stringency of annealing temperature. (B) Typical result of single primer colony PCR. Each reaction produces a number of fragments of variable size, some of which contain the transposon insertion site; some others are randomly amplified as by-products of the low stringency PCR cycle. (C) The use of a sequencing primer (Seq) that hybridizes to the transposon sequence allows the sequencing of the fragments of interest. (D) Sequence analysis software allows the automatic annotation of transposon insertions on the bacterial genome. Please click here to view a larger version of this figure.
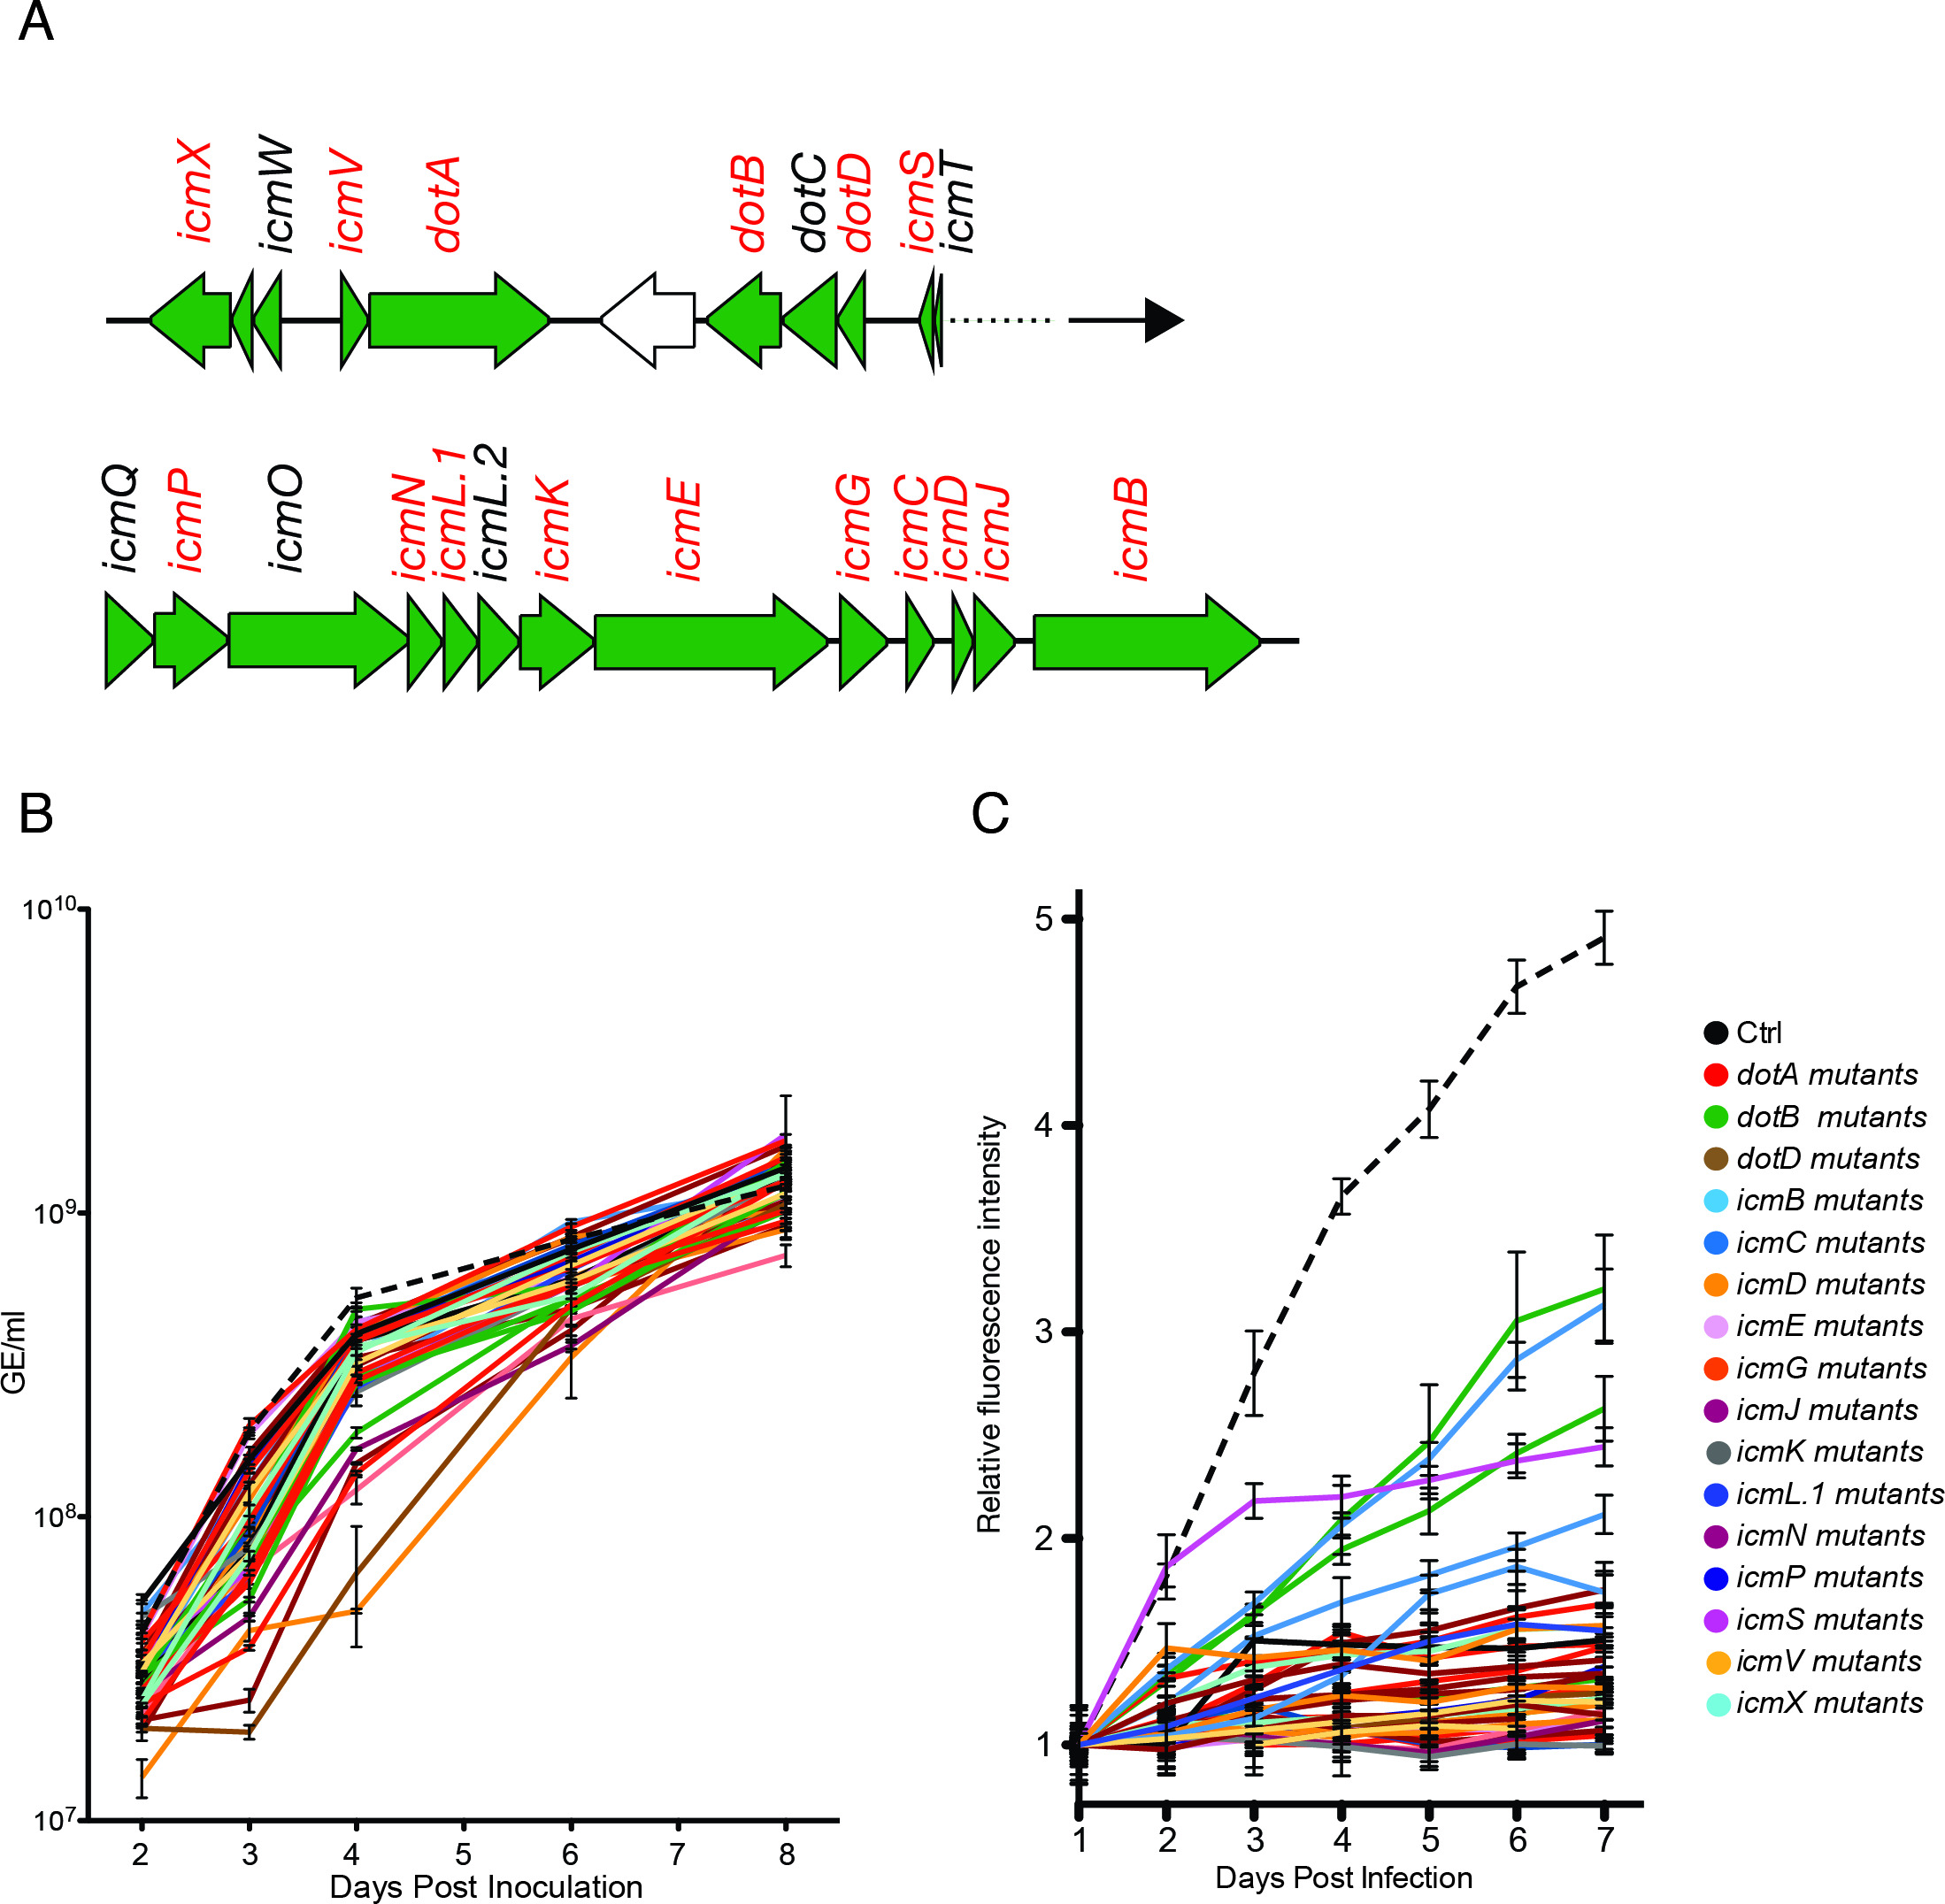
Figure 2: Axenic and intracellular growth of Coxiella transposon mutants. (A) In the pilot screen, we have isolated, sequenced and screened 38 transposon mutants in 16 core genes of the Coxiella dot/icm secretion system (indicated in red). (B) In order to assess the viability of each transposon mutant, the growth of each isolate in axenic culture medium is monitored over 8 days using a fluorescently tagged DNA intercalating agent. (C) Each mutant is then used to infect epithelial cells. As the transposon possesses a GFP cassette, intracellular bacterial growth is monitored over 7 days of infection by following the variations of GFP fluorescence associated with Coxiella replication, using a microplate reader. Please click here to view a larger version of this figure.
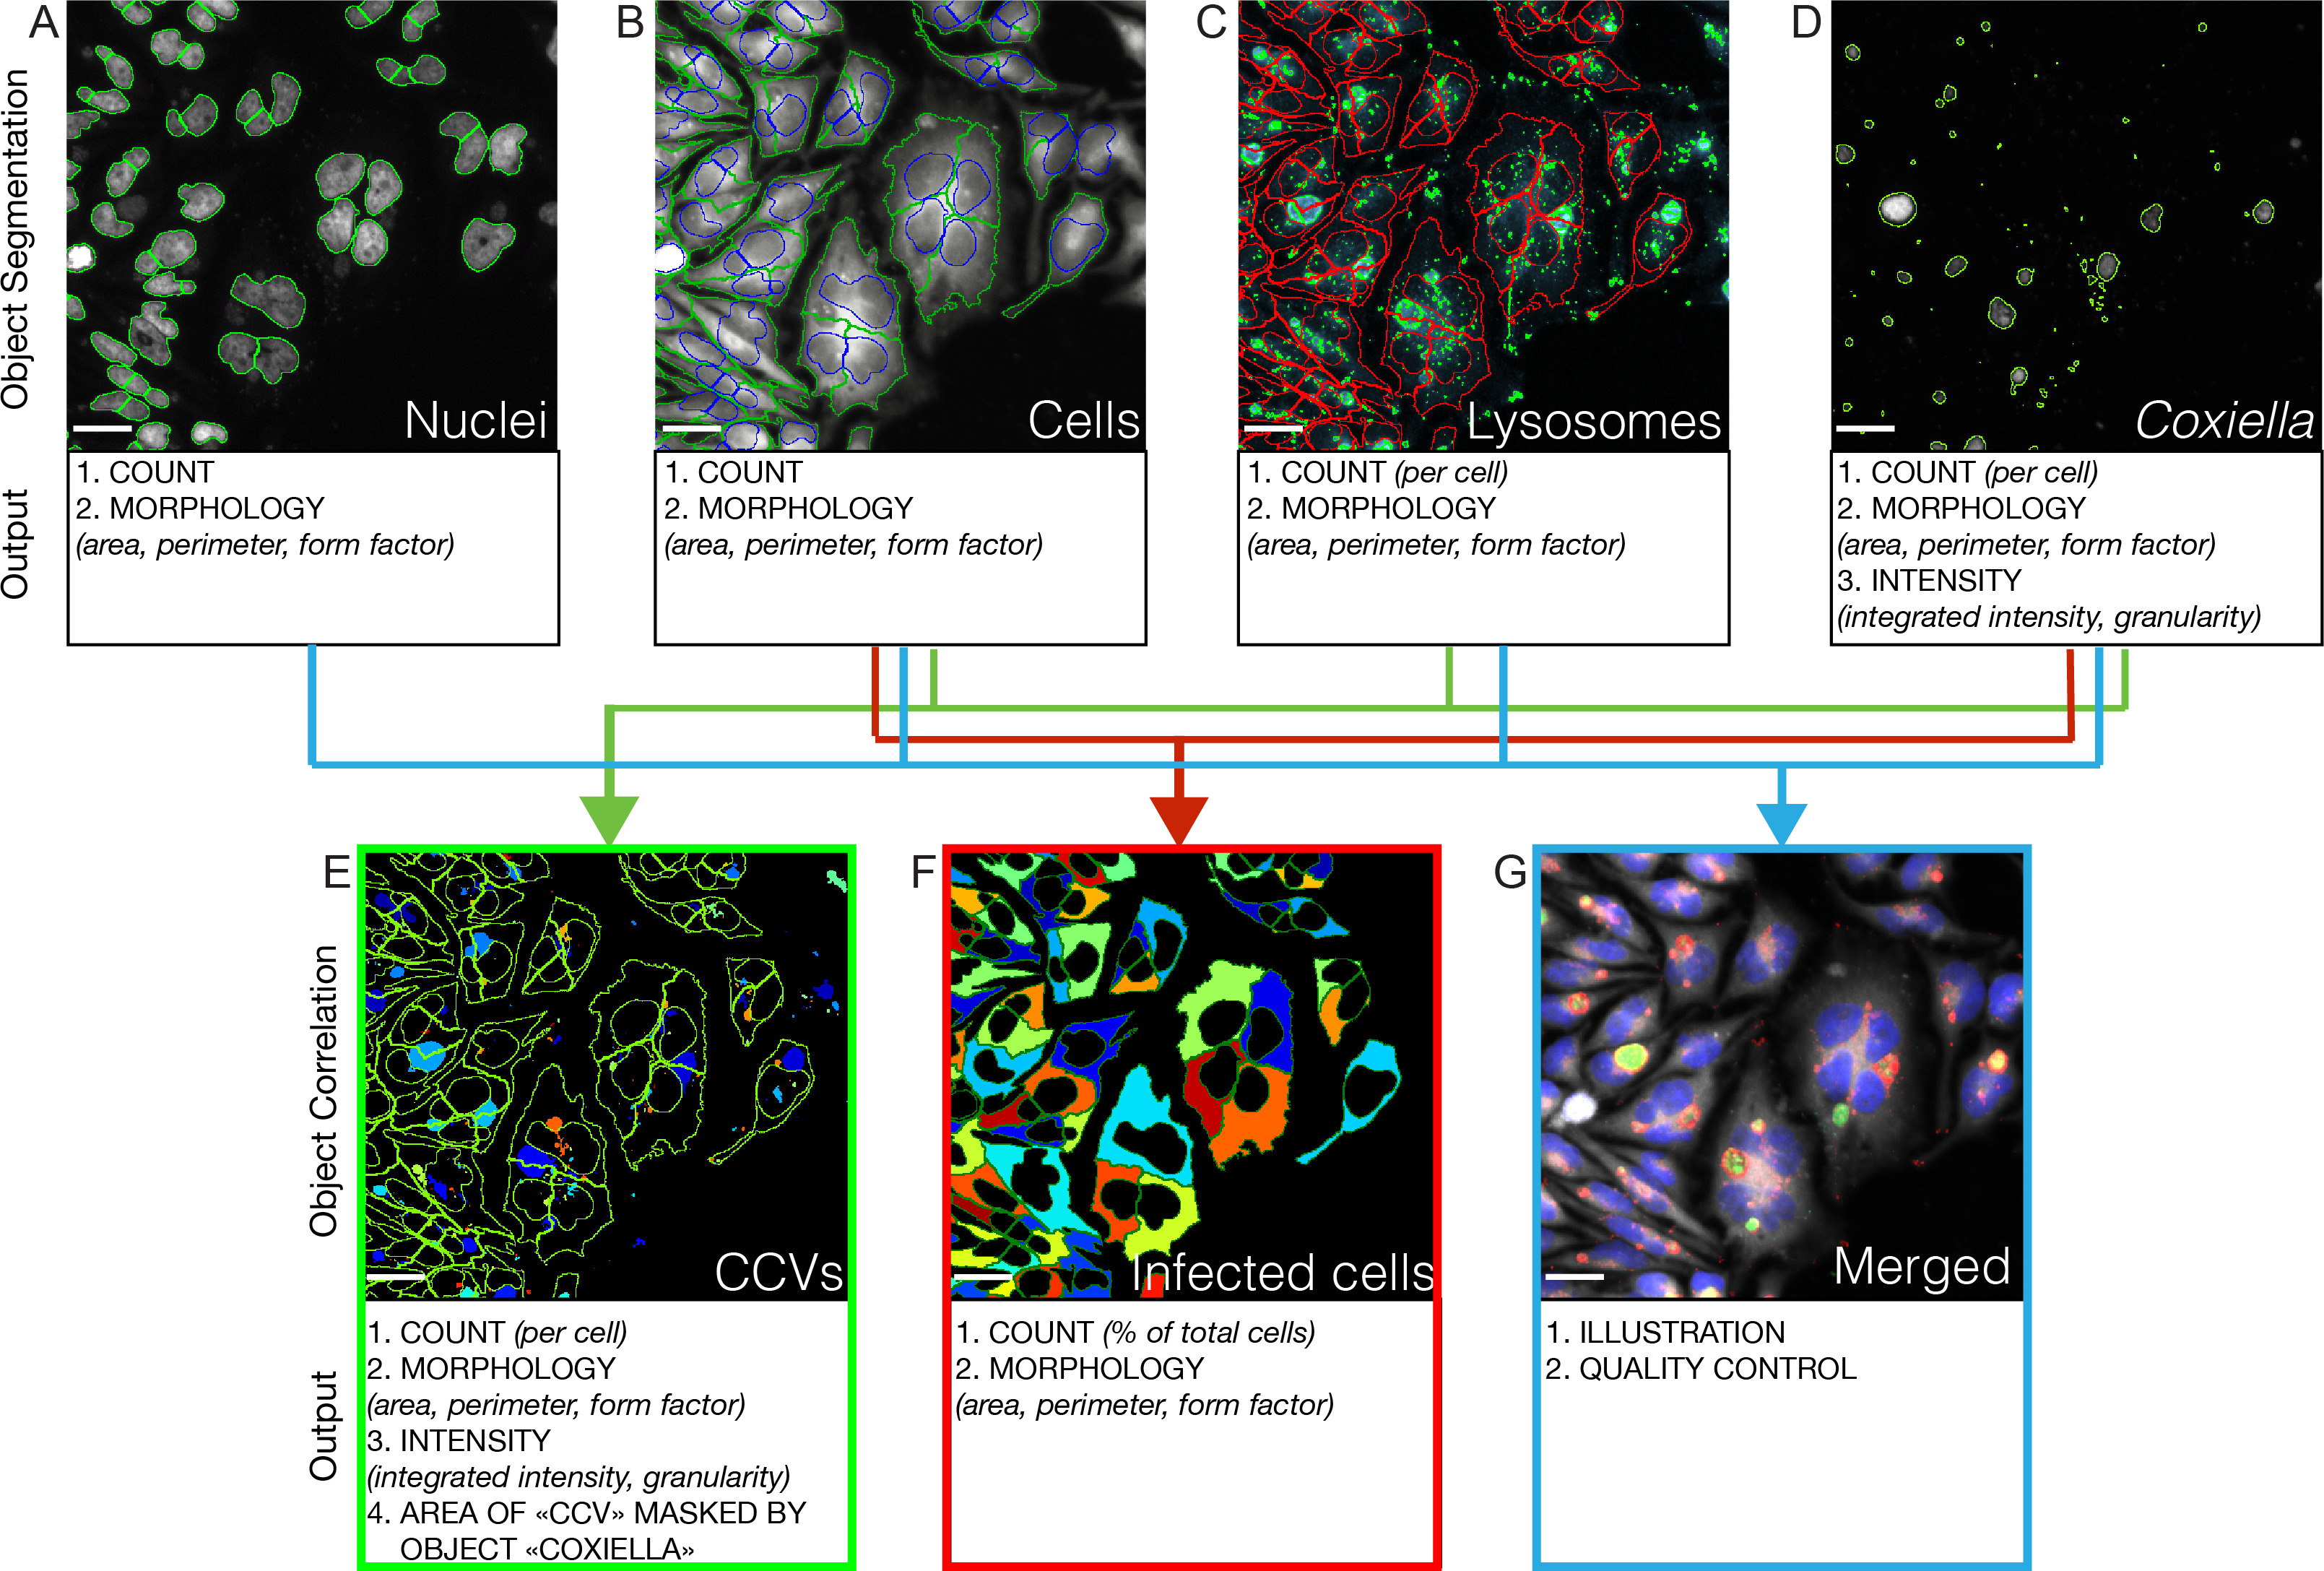
Figure 3: Automated image analysis of Coxiella infections. An automated epifluorescence microscope is used to image 21 positions per well of triplicate 96-well plates. The image analysis software segments objects in each acquired channels for quantification and analysis. In all cases, objects touching the border of the images are excluded. (A) The Hoechst channel is used to identify host cell nuclei (circled in green). (B) These are used as seeds to identify host cell contours in the Cy3 channel (the position of nuclei is circled in blue, cell contours are in green). (C) The Cy5 channel is used to identify LAMP1-positive compartments (circled in green); only the objects included in the previously identified cell contours (in red) are retained for image analysis. (D) The GFP channel is used to identify Coxiella colonies (circled in green). (E) Correlating Coxiella colonies with LAMP1-positive compartments allows the identification of Coxiella-containing vacuoles (CCVs); only the objects included in the previously identified cell contours (in green) are retained for image analysis. (F) Correlating Coxiella colonies with cell contours allows the identification of infected cells (pseudocolored). (G) Images acquired in the 4 fluorescence channels (corresponding to Coxiella colonies (green), host cell nuclei (blue), host cell plasma membrane (grey), LAMP1-positive compartments (red)) are merged and used for illustration and quality control. Scale bars 10 µm. Please click here to view a larger version of this figure.
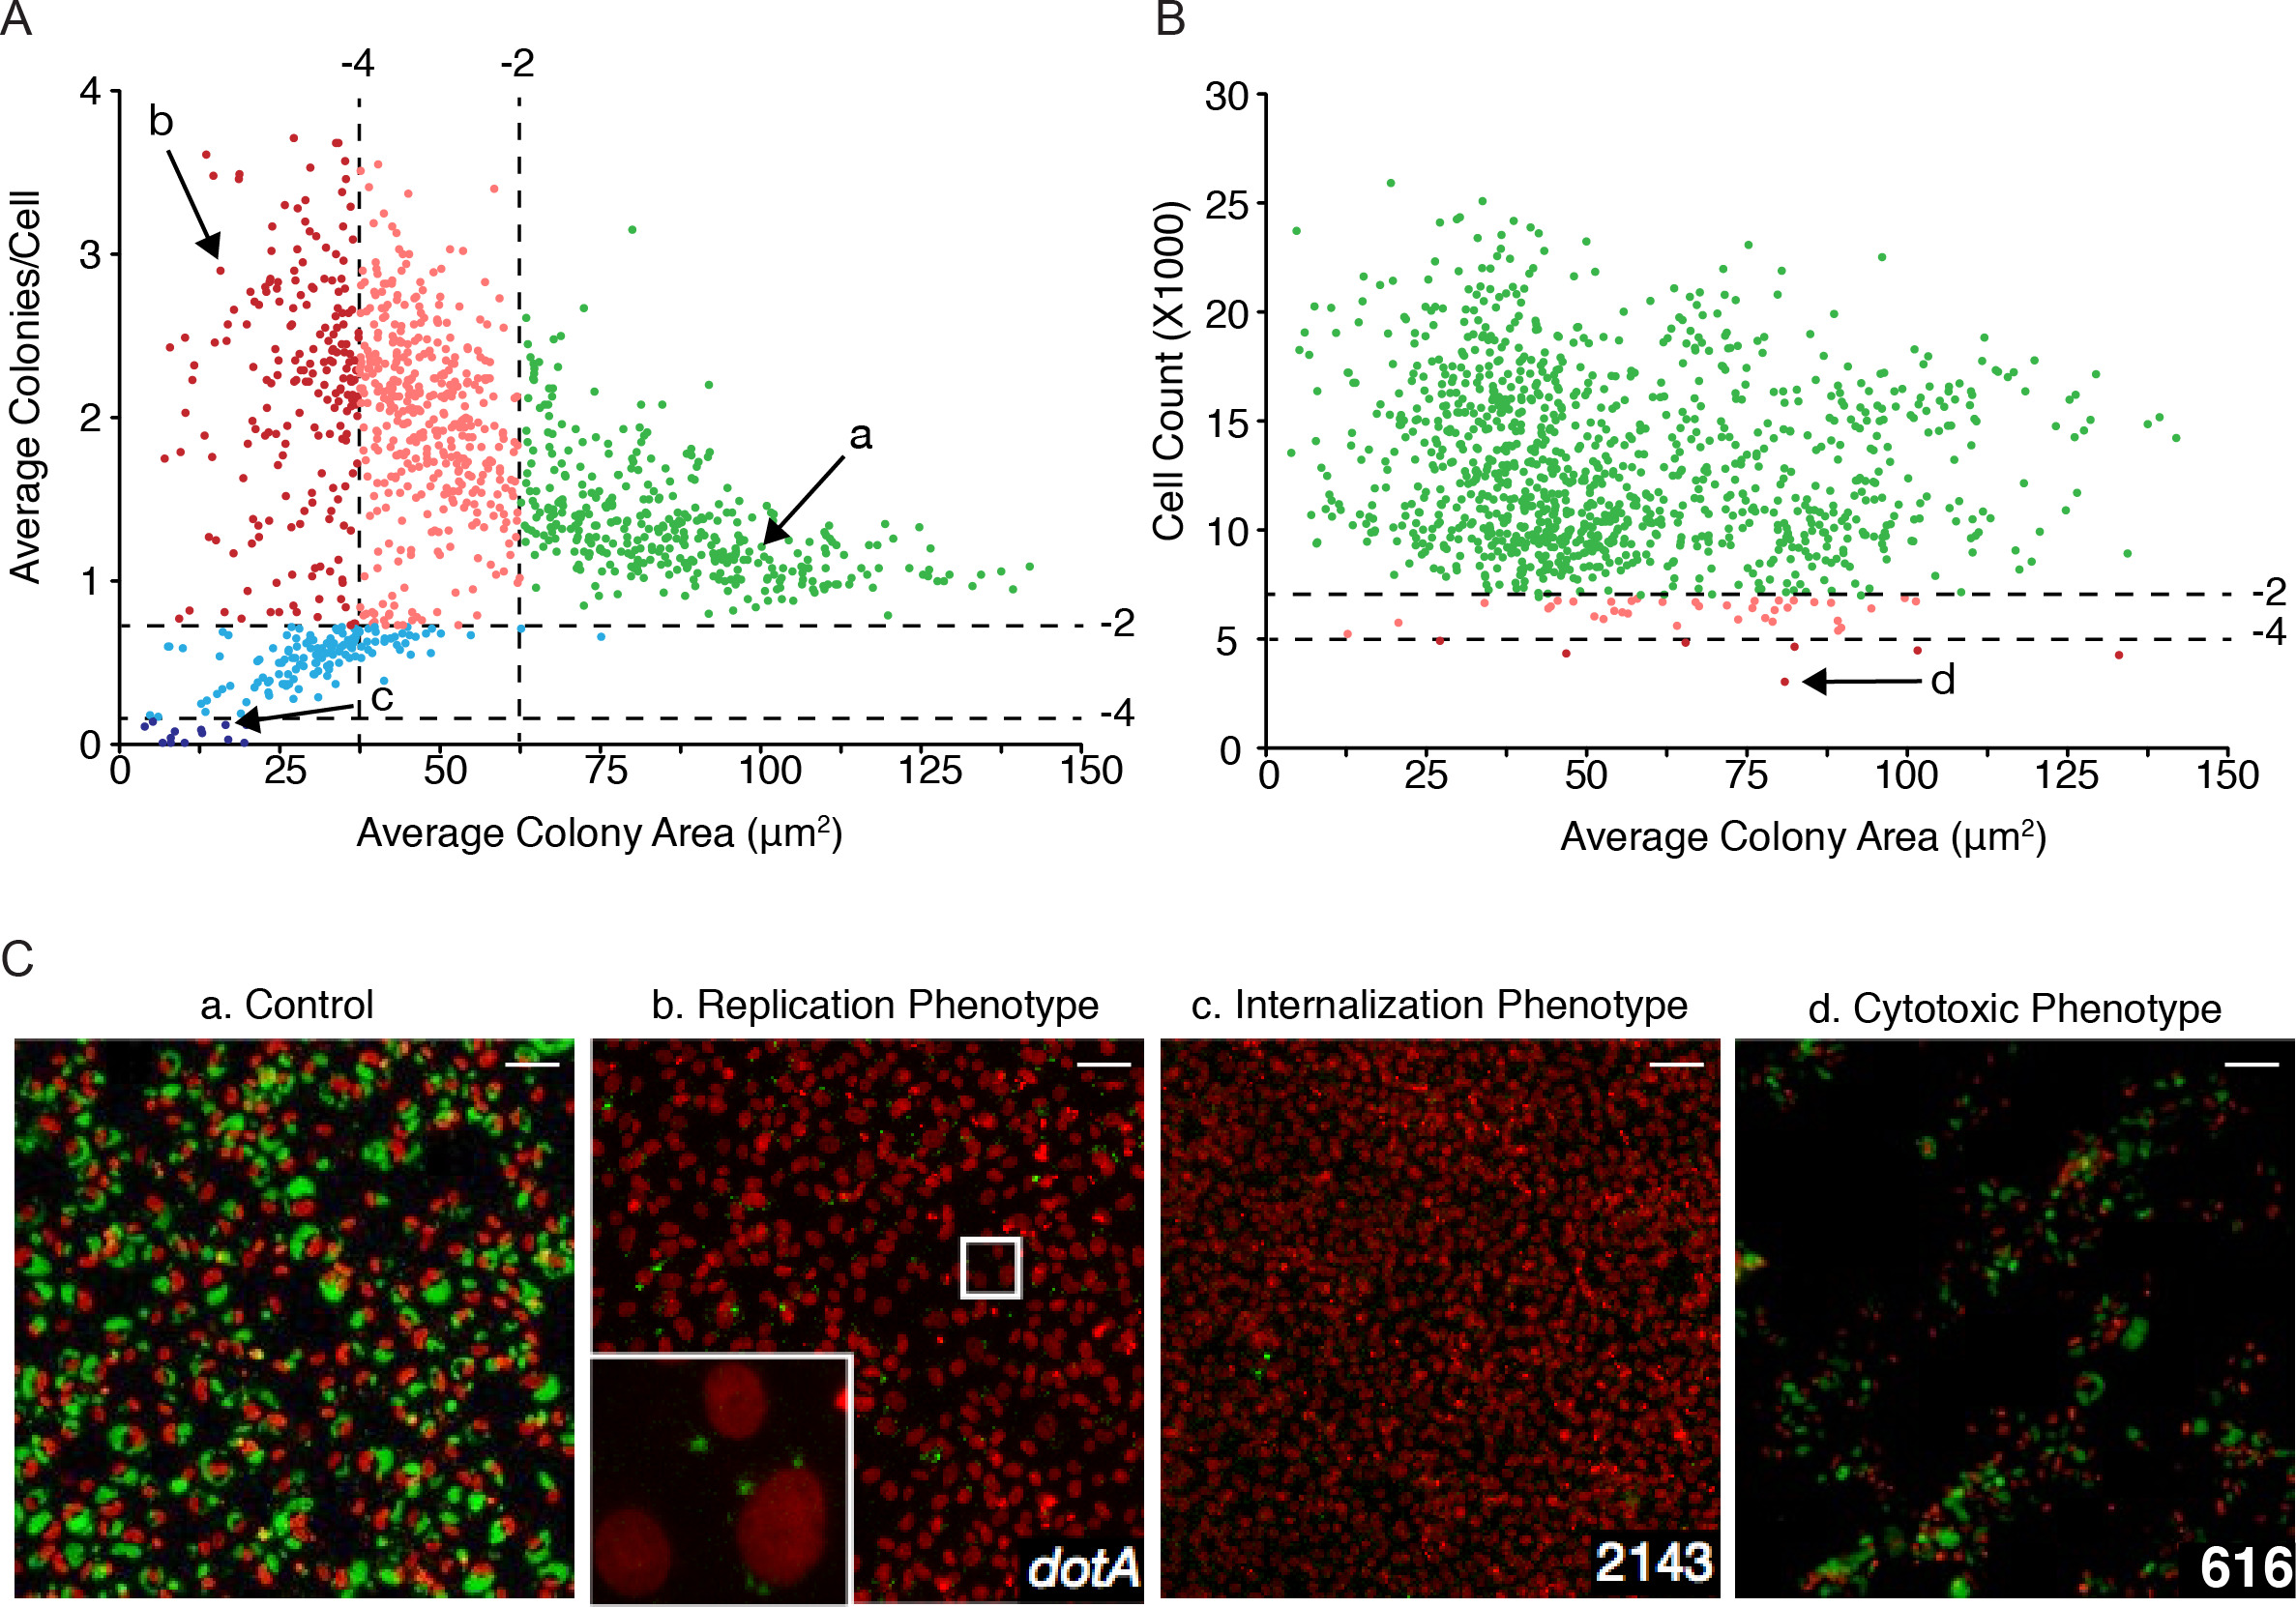
Figure 4: Large-scale identification of Coxiella factors involved in host/pathogen interactions. (A) The average area (in μm2) of Coxiella colonies is plotted against the relative number of colonies per cell, to identify replication and internalization phenotypes of interest. Green dots represent phenotypes that deviate from WT Coxiella by a Z-score > -2 (not significant). Pink and light blue dots represent replication and internalization phenotypes respectively, with a Z-score between -2 and -4 (mild phenotypes). Red and dark blue dots represent phenotypes with a Z-score ≤ -4 (strong phenotypes). (B) The average area (in μm2) of Coxiella colonies was plotted against the total number of cells (infected and not infected) that survived 7 days of infection to estimate the cytotoxic effect resulting from transposon insertions. Green dots represent phenotypes that deviate from WT Coxiella by a Z-score > -2 (not significant). Pink dots represent cytotoxic phenotypes with a Z-score between -2 and -4 (mild phenotypes). Red dots represent cytotoxic phenotypes with a Z-score ≤ -4 (strong phenotypes). Arrows indicate mutants illustrated by the corresponding lowercase letter in C. (C) Representative images of replication, internalization and cytotoxic phenotypes. In all cases, host cell nuclei are in red, Coxiella colonies are in green. Scale bars 50 µm. Please click here to view a larger version of this figure.
Discussion
The study of host/pathogen interactions has proven to be a remarkable method to understand bacterial infections and develop alternative strategies to counter infectious diseases. However, due to the diversity of strategies elaborated by different bacterial pathogens, the identification and characterization of bacterial virulence factors and of the host signaling pathways that are targeted during infections represent a real challenge. This calls for the development of new approaches for the large-scale identification of key host/pathogen interaction hubs. The recent development of innovative, high-throughput and high-content screening techniques represents an invaluable resource that can be adapted to the study of intracellular bacterial pathogens15. Here, we have used the zoonotic bacterial pathogen Coxiella burnetii as a model to develop screening approaches that combine transposon mutagenesis and fluorescence-based assays. Importantly, this screening method allows the simultaneous monitoring of multiple steps of the Coxiella intracellular cycle, providing a global overview of the strategies developed by this bacterium to invade, replicate and persist within infected cells.
The approach described here is based on two well-established techniques, transposon mutagenesis and fluorescence-based assays, which have been successfully applied to the study of bacterial pathogens. Combining these techniques in the context of high-throughput/high-content screens allows us to evaluate the effects of a high number of bacterial mutations by analyzing a very high number of events (typically 15,000 infected cells per bacterial mutations are imaged and analyzed). This provides an important statistical analysis of events such as bacterial invasion of host cells and intracellular replication, which are, by nature, subject to high variability. It is important to note that cell lines other than epithelial can be used for this type of screening. However, flat and large epithelial cells are optimal for image analysis as host cell organelles are easier to detect. Because the majority of automated microscopes can automatically handle a large number of plates, there are virtually no limits to the number of mutants that can be screened simultaneously. Depending on the pathogen, the user can privilege the use of an epifluorescence or a confocal microscope. The time of image acquisition will mostly depend on the sensitivity of the microscope camera, on the number of fields acquired per well and on the number of channels acquired per field of view. The user can decide how to adjust these factors to optimize the screening protocol. As an example, we imaged one 96-well plate/hr using the conditions indicated at point 5.1. Image analysis largely depends on the machine (or cluster of machines) used. We use a 12-core (2 x 3.06 GHz 6-Core), 48 GB RAM workstation. This machine requires approximately 40 min to analyze images acquired from one plate.
An important aspect to be taken into account when developing these assays is the set up of new (or the optimization of existing) protocols to allow the manipulation and processing of a large number of samples. A typical example is the development of the single primer colony PCR approach, which allowed us to rapidly amplify and sequence Coxiella DNA fragments containing the site of insertion of each transposon, from very small samples. Based on our experience, the high-fidelity polymerase has to be carefully selected and tested in order to obtain reproducible results. The only limitation of this approach may hide in the observation that, in the majority of cases, about 30% of the processed samples are not exploitable, either due to the PCR or the sequencing steps. However, considering that the isolation of new Coxiella transposon mutants is not a rate-limiting step, this does not represent a major issue. Similarly, the development of a reliable assay to quantify the bacterial concentration of mutant stocks has been key for this approach. Due to the tendency of Coxiella to aggregate when in suspension, the use of optical density readings is not applicable to calculate the concentration of Coxiella cultures and the only existing alternative was quantitative PCR (qPCR). Here, the use of a fluorescently tagged DNA intercalating agent significantly speeded up bacteria quantitation.
This approach can also take advantage of the use of stable cell lines expressing fluorescent markers for several intracellular compartments depending on the pathogen used. Another important aspect is the use of cell culture media devoid of phenol red. We observed that this pH indicator has a natural fluorescence spanning the red and green spectrum that saturates the signal recorded on the automated fluorescence reader.
The strategy presented here relies on random transposon mutagenesis. For the mutants of interest, we recommend validating unique transpositions (and clonality) using Southern blot and PCR amplifications of the transposon insertion site.
Besides the equipment described in the protocol section, teams interested in using the screening approach presented here, will take great advantage in the set up of a relational database for data collection, a server for data storage and a workstation for rapid image analysis.
Importantly, the method here described is suited for the study of other intracellular bacterial pathogens provided a random mutagenesis method exists for the pathogen, cell lines can be infected by the pathogen and this one displays a specific phenotype during infection.
Disclosures
The authors declare that they have no competing financial interests.
Acknowledgements
This work was supported by an Avenir/ATIP grant to Matteo Bonazzi and a Marie Curie CIG (N° 293731) to Eric Martinez. The authors would like to thank Dr. Robert Heinzen for sharing C. burnetii strains, antibodies and tools, Virginie Georget and Sylvain DeRossi (Montpellier Rio Imaging-MRI, 1919 route de Mende, 34293 Montpellier) for their technical assistance and data analysis.
Materials
| Name | Company | Catalog Number | Comments |
|---|---|---|---|
| Citric acid | Sigma | C0759-500G | ACCM-2 medium component |
| Sodium citrate | Sigma | S4641-500G | ACCM-2 medium component |
| Potassium phosphate | Sigma | 60218-100G | ACCM-2 medium component |
| Magnesium chloride | Sigma | M2670-100G | ACCM-2 medium component |
| Calcium chloride | Sigma | C5080-500G | ACCM-2 medium component |
| Iron sulfate | Sigma | F8633-250G | ACCM-2 medium component |
| Sodium chloride | Sigma | S9625-500G | ACCM-2 medium component |
| L-cysteine | Sigma | C6852-25G | ACCM-2 medium component |
| Bacto Neopeptone | BD (Beckton-Dickinson) | 211681 | ACCM-2 medium component |
| Casamino acids | BD (Beckton-Dickinson) | 223050 | ACCM-2 medium component |
| Methyl-B-cyclodextrin | Sigma | C4555-10G | ACCM-2 medium component |
| RPMI w/glutamax | Gibco | 61870-010 | ACCM-2 medium component |
| RPMI w/glutamax, without phenol red | Gibco | 32404-014 | For cell culture and infection |
| Fetal bovine serum | GE healthcare | SH30071 | For cell culture |
| Trypsin EDTA (0.25%) | Life Technologies | 25200-056 | For cell culture |
| Saponin | Sigma | 47036 | For immunofluorescence staining |
| Ammonium chloride | Sigma | A9434 | For immunofluorescence staining |
| Bovine serum albumin | Sigma | A2153 | For immunofluorescence staining |
| Electroporation cuvette 0.1 cm | Eurogentec | ce0001-50 | For Coxiella transformation |
| Trackmates screw top tubes with caps | Thermo Scientific | 3741 | 2D barcoded screwcap |
| 96-well microplate with black walls and bottom | Greiner | 655076 | Flat dark bottom, for dsDNA quantitation |
| 96-well PCR microplate | Biorad | 2239441 | DNAse/RNAse free |
| 96-well plate, deepwell | Labcon | 949481 | For Coxiella mutants infections |
| PicoGreen | Life Technologies | P7581 | For dsDNA quantitation |
| Triton X-100 | Sigma | T9284-500ML | For dsDNA quantitation |
| Phusion high fidelity DNA polymerase | New England Biolabs | M0530L | For single primer colony PCR |
| Celltracker Red CMTPX | Life Technologies | C34552 | For imaging |
| Anti-LAMP1 antibody | Sigma | 94403-1ML | For immunofluorescence staining |
| Hoechst 33258 | Sigma | L1418 | For imaging |
| Fluorescence microplate reader Infinite 200 Pro | Tecan | ||
| Epifluorescence automated microscope Cellomics | Thermo Scientific |
References
- Maurin, M., Raoult, D. Q fever. Clinical microbiology reviews. 12 (4), 518-553 (1999).
- Kim, S. G., Kim, E. H., Lafferty, C. J., Dubovi, E. Coxiella burnetii. in bulk tank milk samples, United States. Emerging infectious diseases. 11, 619-621 (2005).
- Kazar, J. Coxiella burnetii. infection. Annals of the New York Academy of Sciences. 1063, 105-114 (2005).
- Madariaga, M. G., Rezai, K., Trenholme, G. M., Weinstein, R. A. Q fever: a biological weapon in your backyard. The Lancet infectious diseases. 3, 709-721 (2003).
- Der Hoek, W. V. an, et al. Epidemic Q fever in humans in the Netherlands. Advances in Experimental Medicine and Biology. 984, 329-364 (2012).
- Capo, C., et al. Subversion of monocyte functions by Coxiella burnetii.: impairment of the cross-talk between alphavbeta3 integrin and CR3. Journal of immunology. 163 (11), Baltimore, Md. 6078-6085 (1999).
- Martinez, E., Cantet, F., Fava, L., Norville, I., Bonazzi, M. Identification of OmpA, a Coxiella burnetii. protein involved in host cell invasion, by multi-phenotypic high-content screening. PLoS pathogens. 10 (3), e1004013(2014).
- Romano, P. S., Gutierrez, M. G., Berón, W., Rabinovitch, M., Colombo, M. I. The autophagic pathway is actively modulated by phase II Coxiella burnetii. to efficiently replicate in the host cell. Cellular microbiology. 9 (4), 891-909 (2007).
- Newton, H. J., Mcdonough, J. a, Roy, C. R. Effector protein translocation by the Coxiella burnetii. Dot/Icm type IV secretion system requires endocytic maturation of the pathogen-occupied vacuole. PloS one. 8 (1), e54566(2013).
- Vogel, J. P. Turning a tiger into a house cat: using Legionella pneumophila. to study Coxiella burnetii. Trends in microbiology. 12 (3), 103-105 (2004).
- Van Schaik, E. J., Chen, C., Mertens, K., Weber, M. M., Samuel, J. E. Molecular pathogenesis of the obligate intracellular bacterium Coxiella burnetii. Nature reviews. Microbiology. 11, 561-573 (2013).
- Beare, P. A., et al. Dot/Icm type IVB secretion system requirements for Coxiella burnetii growth in human macrophages. mBio. 2, (2011).
- Omsland, A., et al. Isolation from animal tissue and genetic transformation of Coxiella burnetii. are facilitated by an improved axenic growth medium. Applied and environmental microbiology. 77 (11), 3720-3725 (2011).
- Beare, P. a, Sandoz, K. M., Omsland, A., Rockey, D. D., Heinzen, R. a Advances in genetic manipulation of obligate intracellular bacterial pathogens. Frontiers in microbiology. 2 (May), 97(2011).
- Brodin, P., Christophe, T. High-content screening in infectious diseases. Current opinion in chemical biology. 15 (4), 534-539 (2011).
Reprints and Permissions
