Designer chromosomes of the Synthetic Yeast Genome project, Sc2.0, can be distinguished from their native counterparts using a PCR-based genotyping assay called PCRTagging, which has a presence/absence endpoint. Here we describe a high-throughput real time PCR detection method for PCRTag genotyping.
Method Article
qPCRTag Analysis - A High Throughput, Real Time PCR Assay for Sc2.0 Genotyping
In This Article
Summary
Abstract
The Synthetic Yeast Genome Project (Sc2.0) aims to build 16 designer yeast chromosomes and combine them into a single yeast cell. To date one synthetic chromosome, synIII1, and one synthetic chromosome arm, synIXR2, have been constructed and their in vivo function validated in the absence of the corresponding wild type chromosomes. An important design feature of Sc2.0 chromosomes is the introduction of PCRTags, which are short, re-coded sequences within open reading frames (ORFs) that enable differentiation of synthetic chromosomes from their wild type counterparts. PCRTag primers anneal selectively to either synthetic or wild type chromosomes and the presence/absence of each type of DNA can be tested using a simple PCR assay. The standard readout of the PCRTag assay is to assess presence/absence of amplicons by agarose gel electrophoresis. However, with an average PCRTag amplicon density of one per 1.5 kb and a genome size of ~12 Mb, the completed Sc2.0 genome will encode roughly 8,000 PCRTags. To improve throughput, we have developed a real time PCR-based detection assay for PCRTag genotyping that we call qPCRTag analysis. The workflow specifies 500 nl reactions in a 1,536 multiwell plate, allowing us to test up to 768 PCRTags with both synthetic and wild type primer pairs in a single experiment.
Introduction
Sc2.0, or the Synthetic Yeast Genome Project (www.syntheticyeast.org), has set the goal of designing and building an entirely synthetic eukaryotic genome. Using the highly curated genome sequence of Saccharomyces cerevisiae3 as a starting point, each of the sixteen linear chromosomes has been re-designed to meet a set of design principles that specify maintaining cell fitness, improving genome stability, and increasing genetic flexibility. For instance, destabilizing elements such as repeats are deleted from Sc2.0 chromosomes. All instances of TAG stop codons are re-coded to TAA to ‘free up’ a codon in the final strain for the introduction of a non-genetically encoded amino acid. Additionally an inducible evolution system, SCRaMbLE, enabled by the Cre-lox system, permits unprecedented capacity to generate derivative genomes with novel structures4.
Another major design element in the Sc2.0 genome is the introduction of PCRTags, which serve as DNA watermarks to enable tracking of synthetic and wild type DNA. PCRTags are short, re-coded segments in ORFs on synthetic chromosomes; while the PCRTag sequences differ at the DNA level between synthetic and wild type chromosomes, the encoded proteins are identical in amino acid sequence and thus, presumably, function. PCRTag sequences are specifically designed as primer binding sites to facilitate selective amplification (Figure 1A). PCRTag design is carried out using the ‘most different’ algorithm in GeneDesign5,6, yielding recoded synthetic sequences that are typically ~60% different than the native sequences (minimum 33%) with melting temperatures between 58 °C and 60 °C and amplicon lengths between 200-500 base pairs2. Recoding is not permitted within the first 100 bp of each ORF, as these regions are known to have special preferences in terms of codon usage7. Together, these design rules favor high performance of almost all PCRTags under a single set of PCR conditions whereby synthetic and wild type PCRTag primer pairs exclusively bind and amplify synthetic and native DNA, respectively (Figure 1B).

Figure 1: PCRTag schematic. (A) PCRTags are re-coded sequences within open reading frames (ORF) of genes on Sc2.0 chromosomes. (B) Synthetic (SYN) and wild type (WT) PCRTag primers exclusively bind and amplify synthetic and wild type genomic DNA (gDNA), respectively. Shown here is an analysis of a ~30 kb segment of the left arm of chromosome six, testing thirteen PCRTag primer pairs using either WT or semi-synVIL2 gDNA as template. In many cases a single ORF encodes more than one PCRTag. Presence/absence of PCRTag amplicons is assessed via agarose gel electrophoresis. PCRTag amplicons range in size from 200 bp to 500 bp. The faster migrating species at the bottom of the panels are primer dimers.
PCRTag analysis has proven to be an important tool in the assembly of Sc2.0 chromosomes. In a typical experiment 30-50 kb of synthetic DNA, encoding 20-30 PCRTags, is transformed into yeast cells to replace the corresponding wild type DNA1,2,8. PCRTag analysis is then used to identify transformants that encode synthetic but not wild type PCRTags spanning that segment of DNA, or so-called ‘winners’. It is usually necessary to test multiple transformants to identify ‘winners’, so throughput and cost of PCRTag analysis are important considerations. Currently two Sc2.0 chromosomes have been completed (synIII1 and synIXR2), representing less than 10% of the Sc2.0 genome, although more than half of the remaining chromosomes are currently undergoing synthesis and assembly. The scale of PCRTag analysis required for this project is fast outpacing the ability to run gels and manually score the presence of synthetic DNA and absence of wild type DNA.
To improve the throughput of the PCRTag assay we have developed a workflow using real time PCR to circumvent the use of agarose gel electrophoresis. The workflow makes use of a bulk liquid dispenser to distribute qPCR mastermix into each well of a 1,536 multiwell plate, a nanoscale acoustic liquid dispenser to transfer template DNA and primers, and a 1,536 qPCR thermal cycler, allowing us to miniaturize reactions to 500 nl and maximize throughput. Moreover analysis can be automated. This type of high throughput genotyping protocol should be generalizable to any project requiring analysis of many clones at multiple loci.
Protocol
1. Prepare Yeast Genomic DNA (gDNA)
- Prepare a stock of Yeast Lysis Buffer9 that contains 50 mM Tris pH 8.0, 100 mM NaCl, 1% SDS (w/v), 2% Triton X-100 (v/v), 1 mM EDTA pH 8.0.
- As starting material use ~2 x 10⁶ cells, which typically corresponds to ~100 µl of saturated culture for lab strains of the BY474110 background. Cultured cells should be collected by centrifugation at 1,000 x g for 3 min at room temperature in a 1.5 ml microfuge tube. Aspirate the supernatant.
- Add 200 µl of Yeast Lysis Buffer and resuspend the cell pellet by pipetting.
- Add ~300 µl of acid washed glass beads such that the level of beads is about 1 mm below the level of the cell slurry.
- In a fume hood add 200 µl of phenol/chloroform/isoamyl alcohol (25:24:1). Cap the microfuge tube and ensure that no beads are stuck between the cap and the tube as this will result in leaks during shaking (step 1.6). Invert 3 times to mix and verify the cap is sealed.
- Shake the tube for 10 min at room temperature using a benchtop mixer such as an Eppendorf 5432.
- Centrifuge at 20,800 x g for 10 min at 4 °C.
- Transfer 75 µl of the aqueous phase to a new microfuge tube containing 1 ml of 100% ethanol. Invert 10 times to mix.
- Pellet the DNA by centrifugation at 20,800 x g for 20 min at 4 °C .
- Aspirate the supernatant without dislodging the DNA pellet. Wash the pellet with 500 µl of 70% ethanol.
- Centrifuge at 20,800 x g for 5 min at 4 °C.
- Aspirate the supernatant without dislodging the DNA pellet and air-dry the pellet with the microfuge cap open until excess ethanol has evaporated, which is usually around 10 min.
- Resuspend the DNA pellet in 75 µl of 10mM Tris pH 7.4 and vortex to mix. Store the sample at -20 °C indefinitely. Measure the concentration of DNA in the sample using a benchtop fluorimeter such as the Qubit, which distinguishes DNA from RNA. Ensure that the final concentration of gDNA is ~1-2 ng/µl.
- Prepare a 1:10 dilution of genomic DNA using water and vortex to mix.
- Aliquot 30 µl of diluted gDNA into the appropriate well of a source plate that is compatible with a nanoscale acoustic liquid dispenser (step 3). If using a Labcyte Echo 550, use a 384 well polypropylene plate (384PP plate).
NOTE: When sealed appropriately this plate can be stored for at least one month at -20 °C.
2. Prepare and Dispense qPCR Master Mix into a 1,536 Multiwell Plate
- Prepare 850 µl of qPCR master mix, such as LightCycler 1536 DNA Green Master, in a 1.5 ml microfuge tube and vortex to mix. Centrifuge the qPCR master mix for 2 min at 20,800 x g at room temperature to remove any bubbles. The components of the qPCR master mix required for a single 1,536 multiwell plate are as follows:
- Combine 170 µl of enzyme master mix (Green Master Tube 1, 5x concentrated), 42.5 µl of SYBR (Green Master Tube 4, 20x concentrated), and 637.5 µl of water.
- Dispense 500 nl/well into a 1,536 multiwell plate using a bulk liquid dispenser such as the Art Robbins Cobra. (Note that steps 2.2.1-2.2.4 refer specifically to the Cobra.)
- Create a dispensing program with the following settings: liquid class, water; aspirate volume, 800 µl; dispense volume, 500 nl; wash time, 20 sec. In the dispense settings, verify the dispense speed is set to 49.6 mm/sec, the dispense offset is 0.25 mm, and excess aspirated liquid will be dispensed back into the source well.
- Place the microfuge tube containing the qPCR master mix in well A1 of the microfuge tube holder, which is located in deck position 1. Cut off the cap of the microfuge tube or simply leave it open. Set the ‘Aspirate well’ to A1 by editing the Aspirate settings.
- Perform a wash step prior to dispensing qPCR master mix by first de-selecting the aspirate and dispense steps of the program set up in step 2.2.2 and then hitting ‘run’. Once complete, re-select the aspirate and dispense steps prior to running the full program to dispense qPCR master mix. If the Cobra has been sitting idle for less than 10 min the initial wash step, which serves to prime the system, is unnecessary.
- Hit ‘run’ to dispense qPCR master mix to each well.
- Collect the qPCR master mix at the bottom of each well by brief centrifugation of the 1536 multiwell plate (30 sec using a low-speed PCR plate spinner).
3. Dispense Template DNA and Primers into the 1,536 Multiwell Plate
- Dispense 5 nl of diluted gDNA (step 1.3) into the desired wells of the 1536 multiwell plate using an acoustic liquid transfer system, such as the Echo 550.
- For the Echo 550, use the Plate Reformat software or alternatively provide a custom Excel spreadsheet to program the transfer. Ensure the selected source well for the gDNA in the program matches the source well into which you have physically dispensed the gDNA (step 1.3). Choose the source plate type ‘384PP_AQ_BP2’, which indicates the liquid in the 384PP plate is a buffer without surfactants.
- Dispense 10 nl of primers, pre-mixed forward and reverse to a final concentration of 50 µM each, into the desired wells of the 1536 multiwell plate using an acoustic liquid transfer system, such as the Echo 550.
- For the liquid transfer system, use the Plate Reformat software or alternatively provide a custom Excel spreadsheet to program the transfer.
NOTE: Here it is possible to dispense primers such that the layout on the 1,536 multiwell plate matches the chromosomal order of the primers so it is easy to visually inspect the real time PCR results later (step 6). - Premix the primers in a plate that is compatible with the acoustic liquid dispenser. For the Echo 550, use a Labcyte 384LDV (low dead volume) plate and choose the source plate type ‘384LDV_AQ_B’ when programming the Echo to indicate the liquid is a simple buffer with no proteins.
- For the liquid transfer system, use the Plate Reformat software or alternatively provide a custom Excel spreadsheet to program the transfer.
4. Seal and Centrifuge the 1536 Multiwell Plate
- Using a microplate sealer system such as the Plateloc Thermal Microplate Sealer, immediately seal the 1,536 multiwell plate using optically clear seal that is compatible with the heat sealer instrument. Do not touch the surface of the seal to avoid smudge marks.
- If using the Plateloc Thermal Microplate Sealer, use the following settings: seal time 2.0 sec, seal temperature 162 °C, air pressure 82 psi. This instrument takes ~5 min to heat up and so should be turned on in advance.
- If using the Plateloc Thermal Microplate Sealer, an adapter must be used to raise the height of the 1536 multiwell plate on the stage of the instrument to ensure good sealing.
NOTE: While it is preferable to purchase a Stage Plate for the Plateloc Thermal Microplate Sealer, an alternative solution is to insert four ~2 mm thick standard washers available at any hardware store in the corners to raise the height of the 1,536 multiwell plate.
- Immediately centrifuge the sealed 1,536 multiwell plate at 2,000 x g for 3 min at room temperature to collect all reagents at the bottom of each well.
5. Real Time PCR
- Program a 1,536 qPCR instrument, such as the LightCycler 1536, with a two-step amplification protocol followed by a melt curve analysis. Using the LightCycler 1,536 software set up a program as follows:
- Pre-incubation: 95 °C, 1 min hold, ramp rate 4.8 °C/sec, no acquisition.
- Two Step Amplification: 30 cycles of [95 °C, no hold, ramp rate 4.8 °C/sec, no acquisition; 64 °C, 30 sec hold, ramp rate 2.5 °C/sec, single acquisition].
- Melt curve: 95 °C, 10 sec, ramp rate 4.8 °C/sec, no acquisition; 60 °C, 1 min, ramp rate 2.5 °C/sec, no acquisition; 97 °C, ramp rate 0.1 °C/sec, 5 acquisitions/°C (continuous).
- Cool: 40 °C, 30 sec, ramp rate 2.5 °C/sec, no acquisition.
- Set the Detection Format to ‘Green Intercalating Dye’ in the Run Definition tab.
- Set the pipetting control to ‘Master Control’ in the Run Definition tab. This feature serves as an internal control and detects the presence of qPCR master mix in each well of the 1,536 multiwell plate, which is useful to identify putative false negatives.
- Insert the 1536 multiwell plate prepared in steps 2-4 into the 1,536 qPCR instrument and run the program.
6. Data Analysis
- Perform visual inspection of the data within the qPCR software.
NOTE: The 1,536 software enables visualization of both amplification and melt curves, as well as a heat map showing the call (positive, negative, invalid, N/A; Figure 2), the crossing point value (sliding color scale for positive or gray for negative; Figure 3), or an endpoint fluorescence (EPF) value (sliding color scale). - Export data from the 1,536 Software in the form a .txt file (results table) or .xml file with either the raw data or calculated data for processing offline from the instrument.
NOTE: The proprietary automated crossing point (Cp) calling algorithm built into the 1,536 software takes into account the shape and slope of the amplification curve while determining positive/negative and Cp value calls with high confidence, at low sub microliter reaction volumes with comparatively low fluorescence values. - If the LightCycler DNA Green Master was used for qPCR, verify that all wells passed the ‘master control’. A fail indicates the well did not receive qPCR master mix and the missing data point should be considered a potential false negative. Verify that all wells passed the ‘master control’. A fail indicates the well did not receive DNA mastermix and consider the missing data point a potential false negative.
Results
We tested synthetic and wild type chromosome 3 PCRTag primer pairs1 with yeast genomic DNA (gDNA) extracted from four different strains. Chromosome 3 has 186 PCRTag primer pairs that span the length of the chromosome (synIII is ~270 kb and wild type chromosome 3 is ~315 kb). To test each of the four strains with both sets of primers, we divided the multiwell plate into four quadrants, one for each type of gDNA, assigning synthetic PCRTag primers to the top half of each quadrant and wild type to the bottom half. Genomic DNA was extracted from the yeast strains, two of which encode wild type chromosome 3 (wild type, synIXR2), while the remaining two encode synthetic chromosome 3 (synIII1, synIII synIXR). qPCR master mix was dispensed into each well of a 1,536 multiwell plate using a bulk liquid dispenser, followed by gDNA and PCRTag primers using the Echo 550. Primers were arrayed identically in each quadrant of the multiwell plate for easy visual comparison. The multiwell plate was then heat sealed with optically clear seal and subjected to real time PCR analysis.
In this qPCRTag experiment we observed, for the most part, amplification as expected, whereby synthetic primers exclusively amplified synthetic DNA and vice versa (Figures 2 and 3). However, we also observed several deviations from the expected pattern, suggesting false negatives and false positives in the dataset. In this experiment, the master control was detected in 100% of wells, indicating the bulk liquid dispenser successfully dispensed mastermix into every well on the plate (data not shown). This rules out one potential source of false negatives. Additionally, some chromosome 3 PCRTags are known to fail (shown in Figures S6 and S7 of Annaluru et al.1), including at least 2 SYN and 1 WT primer pairs; thus these wells can be ignored in each quadrant. True false negatives could arise from a lack of transfer of template gDNA or primers, however in our experience, given the correct calibration of the Echo 550 as well as preparation of gDNA and primers as described, this has not been a major source of error. Overall in this experiment the false negative rate was extremely low for WT primers with WT template (~2%) although somewhat higher for SYN primers with SYN DNA (~8%).
False positives, the detection of signal in wells where SYN primers are mixed with WT gDNA (and vice versa), can arise from cross amplification or primer dimers. Indeed, primer dimers are often visible by gel electrophoresis (Figure 1B) and represent a reasonable source of error. For the application of qPCR, the examination of melt curves can be useful to determine whether different species, such as primer dimers, may be contributing to a signal. Further, performing a control experiment whereby primers are dispensed in the absence of template DNA may help identify primers with a propensity to dimerize. Cross amplification can be observed by gel electrophoresis, in particular if too many PCR cycles are performed or if the annealing temperature is too low. We have tried to minimize the number of false positives due to cross amplification by optimizing both of these parameters for the qPCRTag protocol. Finally, examining the crossing point (Cp) values for each well can help identify primers that are not suited to real time-based detection (Figure 3, e.g., Bb22, Fb22, Bb46, Fb46). Overall in this experiment the false positive rate was low for SYN primers with WT template (~5%) and higher for WT primers with SYN template (~10%).
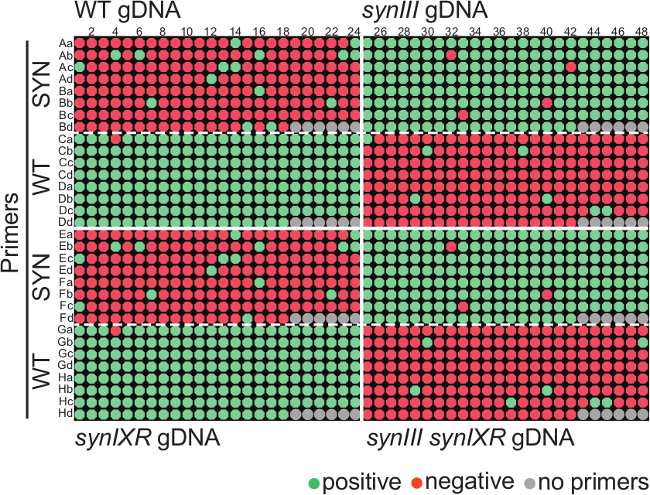
Figure 2: Plate heat map displaying presence/absence call for a qPCRTag experiment. Four different types of genomic DNA (quadrants separated by solid white lines) were subjected to PCRTag analysis using synthetic (SYN) and wild type (WT) chromosome 3 PCRTag primers (dashed white lines to separate SYN (top) and WT (bottom) in each quadrant). WT and synIXR gDNA encode wild type chromosome 3, yielding amplification with WT PCRTag primers. synIII and synIII synIXR gDNA encode synthetic chromosome 3, yielding amplification with SYN PCRTag primers. Primers are arrayed according to their left-to-right chromosomal positioning and positioned identically in the four quadrants for comparison. Please click here to view a larger version of this figure.
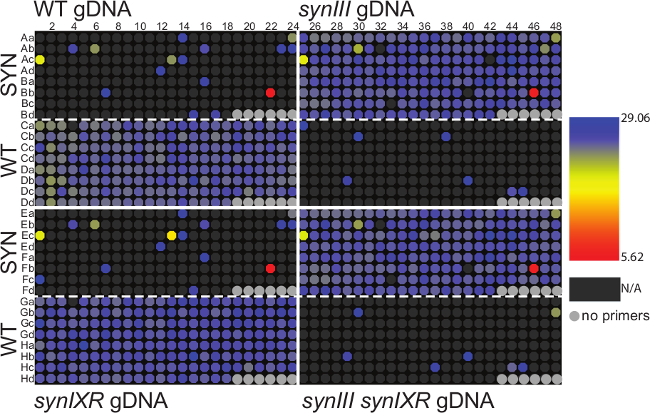
Figure 3: Plate heat map displaying crossing point (Cp) value for a qPCRTag experiment. This is the same dataset as in Figure 2 and the plate layout is therefore identical. N/A refers to ‘no amplification’. Please click here to view a larger version of this figure.
Discussion
Incorporation of real time PCR detection into the PCRTag genotyping assay is an important development for the Sc2.0 project as it enables significantly higher throughput. The previous workflow specified 2.5 µl reactions in 384 well PCR plates, 1.5 hr thermal cycling run time, agarose gel electrophoresis, and manual annotation of the gel.
The workflow presented here, called qPCRTag analysis, overcomes several major bottlenecks. First, a qPCRTag run condenses 4 x 384 well plates into a single experiment that can be processed, start to finish (plate set up plus run time), in about an hour. It is significant to note that the reagent cost per well for qPCRTag analysis is on par with the lower throughput agarose gel-based approach. However, by circumventing gel electrophoresis and manual annotation, the qPCRTag workflow affords substantial savings in time and labor, which are the major advantages. Importantly the qPCRTag workflow is entirely compatible with automation.
A major concern with the use of real time detection as the output of the PCRTag assay is the rate of false positives and false negatives. Since the PCRTag primers were not originally designed for use in real time PCR, it is expected that not all primer pairs will be appropriate for use with this output. To this end it is important to validate the function and specificity of all PCRTag primer pairs to exclude the subset that do not work in the real time-based assay up front. For instance, chromosome 3 PCRTag false positives and negatives are by-and-large reproducible in the real time PCR data (Figures 2 and 3) and these can be excluded from further analyses. Further, primer pairs known to fail (assessed by gel electrophoresis and shown in Figures S6 and S7 of Annaluru et al.1) can also be excluded. This is easily accomplished simply excluding the faulty primer pairs when setting up the acoustic transfer protocol.
Like most high throughput assays, we intend to use real time PCRTag detection as a primary screen to identify transformants that merit further downstream validation. Subsequently, the gold standard for secondary screening will remain PCRTag analysis with gel electrophoresis as the readout. Beyond the application of PCRTag analysis for Sc2.0, combining state-of-the-art nanoscale liquid handling systems with high throughput real time PCR technology enables rapid and automated analysis and has potential to impact many fields. For example, this workflow could be applied to high throughput library screening, infectious disease diagnosis, microbiome analysis, and cutting-edge genome editing approaches attempting to modify multiple loci simultaneously.
Disclosures
L.A.M., N.A.P., J.A.M. and J.D.B. have nothing to disclose. R.C. and A.L. are employed by Roche Life Science, U.S. and worked on developing the application with L.A.M. as part of a proof of principle experiment.
Acknowledgements
This work was supported in part by National Science Foundation Grant MCB-0718846 and Defense Advanced Research Projects Agency Contract N66001-12-C-4020 (to J.D.B). L.A.M. was funded by a postdoctoral fellowship from the Natural Sciences and Engineering Research Council of Canada. Publication of this article is sponsored by Roche.
Materials
| Name | Company | Catalog Number | Comments |
|---|---|---|---|
| Yeast gDNA prep | |||
| yeast gDNA | custom | custom | template for real time PCR |
| Acid-washed glass beads (0.5 mm) | Sigma | G8772 | yeast cell lysis |
| Ultrapure Phenol:Chloroform:Isoamyl Alcohol (25:24:1, v/v) | Invitrogen | 15593-031 | yeast cell lysis |
| 5432 Mixer | Eppendorf | 5432 | yeast cell lysis |
| Microcentrifuge 5417R | Eppendorf | 22621807 | yeast cell lysis |
| Qubit 3.0 Fluorometer | Life Technologies | Q33216 | gDNA quantification |
| Qubit dsDNA BR Assay Kit | Life Technologies | Q32850 | gDNA quantification |
| Labcyte 384PP plate | Labcyte | P-05525 | gDNA source plate |
| DNA Green Mastermix prep and dispensing | |||
| LightCycler 1536 DNA Green | Roche | 5573092001 | real time PCR mastermix |
| 1.5 ml Microfuge Tube Holder | ARI | EST BD060314-1 | microfuge tube holder for deck of Cobra |
| LightCycler 1536 Multiwell Plate | Roche | 5358639001 | |
| Cobra liquid handling system | Art Robbins Instruments | 630-1000-10 | dispense qPCR master mix into 1536 plate |
| PCR Plate Spinner | VWR | 89184-608 | cenrifugation of 1536 plate |
| Template and primer dispensing | |||
| PCRTag primers | IDT | custom | premixed forward and reverse, 50 μM each |
| TempPlate pierceable sealing foil, sterile | USA Scientific | 2923-0110 | temporary seal for PCRTag primer plates |
| Labcyte LDV 384 well plate | Labcyte | LP-0200 | pre-mixed primer source plate |
| Echo 550 Liquid Handler | Labcyte | transfer 2.5 nl drops of primer and template DNA into 1536 plate | |
| Plateloc Thermal Microplate Sealer | Agilent | G5402-90001 | heat seal for 1536 plate prior to LC1536 run |
| Clear Permanent Seal | Agilent | 24212-001 | optically clear heat seal for LC1536 multiwell plate |
| PlateLoc Roche/LightCycler 1536 Plate Stage | Agilent | G5402-20008 | can substitute ~2 mm thick washers |
| Sorvall Legend XTR | Thermo Scientfic | 75-004-521 | centrifuge heat sealed 1536 plate |
| Industrial Air Compressor | Jun Air | 1795011 | to run the Echo and Heat Sealer |
| Real Time PCR | |||
| LightCycler 1536 | Roche | requires 220 V outlet |
References
- Annaluru, N., et al. Total synthesis of a functional designer eukaryotic chromosome. Science. 344 (6179), 55-58 (2014).
- Dymond, J. S., et al. Synthetic chromosome arms function in yeast and generate phenotypic diversity by design. Nature. 477 (7365), 471-476 (2011).
- Goffeau, A., et al. Life with 6000 genes. Science. 274 (5287), 546-547 (1996).
- Dymond, J., Boeke, J. The Saccharomyces cerevisiae SCRaMbLE system and genome minimization. Bioeng Bugs. 3 (3), 168-171 (2012).
- Richardson, S. M., Nunley, P. W., Yarrington, R. M., Boeke, J. D., Bader, J. S. GeneDesign 3.0 is an updated synthetic biology toolkit. Nucleic Acids Res. 38 (8), 2603-2606 (2010).
- Richardson, S. M., Liu, S., Boeke, J. D., Bader, J. S. Design-A-Gene with GeneDesign. Methods Mol Biol. 852, 235-247 (2012).
- Lajoie, M. J., et al. Probing the limits of genetic recoding in essential genes. Science. 342 (6156), 361-363 (2013).
- Jovicevic, D., Blount, B. A., Ellis, T. Total synthesis of a eukaryotic chromosome: Redesigning and SCRaMbLE-ing yeast. Bioessays. 36 (9), 855-860 (2014).
- Dymond, J. S. Preparation of genomic DNA from Saccharomyces cerevisiae. Methods Enzymol. 529, 153-160 (2013).
- Brachmann, C. B., et al. Designer deletion strains derived from Saccharomyces cerevisiae S288C: a useful set of strains and plasmids for PCR-mediated gene disruption and other applications. Yeast. 14 (2), 115-132 (1998).
Reprints and Permissions
