Experimental validation of enhancer activity is best approached by loss-of-function analysis. Presented here is an efficient protocol that uses CRISPR/Cas9 mediated deletion to study allele-specific regulation of gene transcription in F1 ES cells which contain a hybrid genome (Mus musculus129 x Mus castaneus).
Method Article
Generating CRISPR/Cas9 Mediated Monoallelic Deletions to Study Enhancer Function in Mouse Embryonic Stem Cells
In This Article
Summary
Abstract
Enhancers control cell identity by regulating tissue-specific gene expression in a position and orientation independent manner. These enhancers are often located distally from the regulated gene in intergenic regions or even within the body of another gene. The position independent nature of enhancer activity makes it difficult to match enhancers with the genes they regulate. Deletion of an enhancer region provides direct evidence for enhancer activity and is the gold standard to reveal an enhancer's role in endogenous gene transcription. Conventional homologous recombination based deletion methods have been surpassed by recent advances in genome editing technology which enable rapid and precisely located changes to the genomes of numerous model organisms. CRISPR/Cas9 mediated genome editing can be used to manipulate the genome in many cell types and organisms rapidly and cost effectively, due to the ease with which Cas9 can be targeted to the genome by a guide RNA from a bespoke expression plasmid. Homozygous deletion of essential gene regulatory elements might lead to lethality or alter cellular phenotype whereas monoallelic deletion of transcriptional enhancers allows for the study of cis-regulation of gene expression without this confounding issue. Presented here is a protocol for CRISPR/Cas9 mediated deletion in F1 mouse embryonic stem (ES) cells (Mus musculus129 x Mus castaneus). Monoallelic deletion, screening and expression analysis is facilitated by single nucleotide polymorphisms (SNP) between the two alleles which occur on average every 125 bp in these cells.
Introduction
Transcriptional regulatory elements are critical for spatio-temporal fine tuning of gene expression during development1 and modification of these elements can result in disease due to aberrant gene expression2. Many disease-associated regions identified by genome wide association studies are in non-coding regions and have features of transcriptional enhancers3-4. Identifying enhancers and matching them with the genes they regulate is complicated as they are often located several kilobases away from the genes they regulate and may be activated in a tissue-specific manner5-6. Enhancer predictions are commonly based on histone modification marks, mediator-cohesin complexes and binding of cell type-specific transcription factors7-10. Validation of predicted enhancers is most often done through a vector based assay in which the enhancer activates expression of a reporter gene11-12. These data provide valuable information about the regulatory potential of putative enhancer sequences but do not reveal their function in their endogenous genomic context or identify the genes they regulate. Genome editing serves as a powerful tool to study the function of transcriptional regulatory elements in their endogenous context by loss-of-function analysis.
Recent advances in genome editing, namely the CRISPR/Cas9 genome editing system, facilitate the investigation of genome function. The CRISPR/Cas9 system is easy to use and adaptable for many biological systems. The Cas9 protein is targeted to a specific site in the genome by a guide RNA (gRNA)13. The SpCas9/gRNA complex scans the genome for its target genomic sequence which must be 5' to a protospacer adjacent motif (PAM) sequence, NGG14-15. Base pairing of the gRNA to its target, a 20 nucleotide (nt) sequence complementary to the gRNA, activates SpCas9 nuclease activity resulting in a double strand break (DSB) 3 bp upstream of the PAM sequence. Specificity is achieved through complete base pairing in the gRNA seed region, the 6-12 nt adjacent to the PAM; conversely, mismatches 5' of the seed are usually tolerated16-17. The introduced DSB can be repaired either by the non-homologous end joining (NHEJ) DNA repair or homology directed repair (HDR) mechanisms.NHEJ DNA repair often creates insertion/deletion (indels) of a few bp at the target site that can disrupt the open reading frame (ORF) of a gene. To generate larger deletions in the genome two gRNAs, which flank the region of interest, can be used18-19. This approach is particularly useful for the study of transcriptional enhancers clustered into locus control regions or super-enhancers which are larger than conventional enhancers9,18,20-22.
Monoallelic deletions are a valuable model for studying cis-regulation of transcription. The observed change in transcript level after monoallelic deletion of an enhancer correlates to the role of that enhancer in gene regulation without the confounding effects that can occur when transcription of both alleles is affected potentially influencing cellular fitness. Evaluating reduced expression is difficult however without the ability to distinguish the deleted from the wild type allele. Furthermore, genotyping deletions at each allele without the ability to distinguish the two alleles is challenging, especially for large deletions of >10 kb to 1 Mb23 in which it is difficult to amplify the entire wild type region by PCR. The use of F1 ES cells generated by crossing Mus musculus129 with Mus castaneus allows the two alleles to be differentiated by allele-specific PCR18,24. The hybrid genome in these cells facilitates allele specific deletion screening and expression analysis. On average there is a SNP every 125 bp between these two genomes, providing flexibility in primer design for expression and genotyping analyses. The presence of one SNP can influence the primer melting temperature (Tm) and target specificity in real-time quantitative PCR (qPCR) amplification allowing for discrimination of the two alleles25. Furthermore a mismatch within the 3' end of the primer greatly influences the ability of DNA polymerase to extend from the primer preventing amplification of the undesired allele target26. Described in the following protocol is the use of F1 ES cells for allele specific enhancer deletions of greater than 1 kb and subsequent expression analysis using the CRISPR/Cas9 genome editing system (Figure 1).
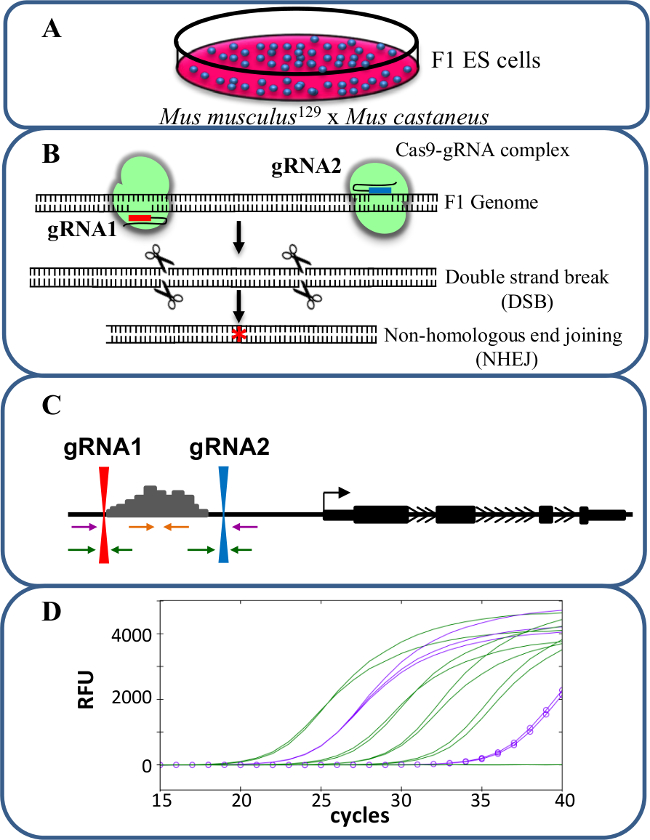
Figure 1. Enhancer deletion using CRISPR/Cas9 to study cis-regulation of gene expression. (A) F1 ES cells generated by a cross between Mus musculus129 and Mus castaneus are used to allow for allele specific deletion. (B) Two guide RNAs (gRNA) are used to induce a large Cas9-mediated deletion of the enhancer region. (C) Primer sets are used to identify large mono- and bi-allelic deletions. The orange primers are the inside primers, the purple primers are the outside primers and the green primers are the gRNA flanking primers. (D) Changes in gene expression are monitored using allele-specific qPCR. RFU denotes relative fluorescence units. Please click here to view a larger version of this figure.
Protocol
1. Designing and Constructing the gRNA
- To delete transcriptional enhancer regions use two gRNAs, one 5' and one 3' of the region of interest. Use the mouse UCSC genome browser track generated by the Zhang laboratory to identify unique gRNA sequences (http://www.genome-engineering.org15). Next check these gRNAs and their adjacent PAM for SNPs and indels using online tools provided by the Sanger Institute (www.sanger.ac.uk/sanger/Mouse_SnpViewer/rel-1211)27-28. To target both alleles with equal efficiency, avoid gRNA/PAM sequences that contain a SNP or indel.
- While choosing the gRNA, check for the feasibility of designing allele-specific primers for genotyping the deletion. Refer to section 5 for allele-specific primer design.
- Assemble the two gRNA plasmids based on the protocol described in Mali et al. 201315. Incorporate the selected unique 20 bp target sequence into the 61mer oligonucleotides as shown in Table 7 (sequences are displayed in the 5' to 3' orientation, and the bolded bases are the 20 bp target sequence that are reverse complements of each other).
- Mix 10 µl of 10 µM gRNA Primer_F and 10 µl of 10 µM complementary Primer_R in a tube.
- Anneal the primers by incubating the primer mix at 100 °C for 5 min and then cool 1 °C/sec to 25 °C. For this step, use a PCR machine or place the tube in boiling water and allow it to cool to RT.
- To the annealed primer mix, add the following reaction mix and incubate at 72 °C for 30 min to extend each primer: 18.5 µl of water, 10 µl of 5x HF buffer, 1 µl of 10 mM dNTP mix and 0.5 µl of high-fidelity DNA polymerase.
- Run 10 µl of target fragment on a 2% agarose gel to confirm the 100 bp guide fragments have been produced.
- Linearize the gRNA vector (a gift from George Church; Addgene plasmid # 41824)15 with AflII by using the following reaction set up: 5 µl of gRNA vector backbone (2-4 µg), 5 µl of 10x buffer, 3 µl of AflII (20 units/µl) and 32 µl of water. Incubate the reaction mix for 3 hr at 37 °C.
- Run the digested product on a 1% agarose gel and purify the DNA band corresponding to the 3.5 kb linearized gRNA vector using a gel extraction kit by following the manufacturer's instructions.
- Set up Gibson assembly reactions29-30 using linearized gRNA vector and target fragment from step 1.2.3 as follows: 1 µl of linear gRNA vector (50 ng/µl), 1 µl of target fragment, 10 µl of 2x Gibson assembly master mix and 8 µl of water. Incubate reactions at 50 °C for 60 min.
- Transformation of E.coli Cells with Assembled gRNA Vector.
- Mix 1 µl of the assembled gRNA vector from 1.2.7 and 50 µl of DH5α (E.coli strain) cells in a tube. Transform the DH5α cells by heat shock method by exposing the cells to 42 °C for 45 sec.
- Snap chill the tubes on ice for 5 min; then add 400 µl of SOC medium and incubate at 37 °C for 45 min in a shaking incubator.
- Spread 100 µl of the DH5α cells on an LB-kanamycin (50 µg/ml) plate for positive selection of transformed cells and incubate O/N at 37 °C.
- Screening Positive E.coli Colonies for gRNA Insert.
- Pick a kanamycin resistant colony and resuspend in 3 ml LB containing 50 µg/ml of kanamycin. Repeat the same for 6-8 colonies and incubate all tubes at 37 °C O/N in a shaking incubator.
- Extract plasmids from the O/N grown culture using plasmid mini prep kit by following the manufacturer's manual.
- Prepare an EcoRI digestion reaction mix to check for gRNA sequence insert in the plasmid. For each sample, prepare the reaction mix as follows: 2 µl of enzyme buffer, 1 µl of EcoRI, 15 µl of water. Aliquot the reaction mix into 1.5 ml tubes and add 2 µl of plasmid. Incubate the tubes at 37 °C for 2 hr.
- Run the digested product on a 1.5% agarose gel.
Note: The samples with insert will display a 475 bp band size that is 100 bp higher than the clones without inserts.
Note: Alternatively, the positive clones can be screened by a colony PCR using Sp6 (forward) and T7 (reverse) primers (Table 7) that bind to the vector sequence to give a 642 bp size fragment in the presence of a gRNA insert. The colony PCR approach is advantageous when there is an EcoRI restriction site within the gRNA sequence.
- Confirm the Sequence of the gRNA Insert by DNA Sequencing Using the T7 Primer.
2. Transfection
Note: Electroporation is an efficient method of transfecting plasmids into ES cells. The method described here uses microporator transfection technology.
- Grow F1 ES cells in a 10 cm gelatin-coated dish containing 10 ml of ES cell media (Table 1) at 37 °C/5% CO2. When the cells reach 85% confluency remove the media and add 2 ml of trypsin. Incubate at 37 °C in the CO2 incubator for 5 min.
Note: F1 ES cells were obtained from Barbara Panning24 and are available on request. - Neutralize the trypsin by adding 10 ml of spin media (Table 2). Pipette repeatedly to detach the cells completely.
- Collect all the cells in a 15 ml tube and spin at 300 x g for 5 min. Resuspend in 3 ml PBS and count the cells using a hemocytometer or automated cell counter.
- Pellet 1 x 10⁶ ES cells in a 1.5 ml tube by centrifugation at 300 x g for 5 min and resuspend in 100 µl of R (resuspension) buffer as supplied by the kit manufacturer.
- Add 5 µg each of pCas9_GFP (a gift from Kiran Musunuru; Addgene plasmid # 44719)31, 5' and 3' gRNA plasmids for deletion of the target region and mix gently with a pipette to avoid the introduction of bubbles.
- Use the electronic pipette tip to aspirate 100 µl of the electroporation mix, being careful to avoid a bubble in the tip.
- Program the volts, width and pulses for electroporation. For F1 ES cells, use 1,400 V, 10 msec for 3 pulses.
- While the electroporation is running observe the tip to watch for any sparks in the solution. A spark indicates the presence of an air bubble and will interfere with the transfection.
- Eject the transfected ES cells into a 10 cm gelatin-coated dish containing 10 ml ES cell media (Table 1) and incubate at 37 °C/5% CO2.
3. FACS Sorting Transfected Cells
- After 48 hr, detach the cells by adding 2 ml of trypsin and incubate at 37 °C in the CO2 incubator for 5 min.
- Neutralize the plate by adding 10 ml of collection buffer (Table 3). Collect the cells in a 15 ml tube and spin at 300 x g for 5 min.
- Discard the supernatant and resuspend the cells in 1 ml of sorting buffer (Table 4). Count the cells and dilute based on the sorting platform. Dilute the cells to 0.5-1 x 10⁶ cells/ml for sorting into 15 ml tubes and for sorting individual cells directly into 96-well plates, dilute the cells to 2-5 x 10⁶ cells/ml.
- Sort Cas9-GFP+ ES cells using a FACS flow cytometer32. Collect cells in bulk in tubes with 2 ml recovery media (Table 5) and plate as described in 3.5 for colony picking, or sort individual cells directly into gelatin-coated 96-well plates containing 100 µl ES cell media/well (Table 1).
- Seed 1-1.5 x 10⁴ GFP+ ES cells in a 10 cm gelatin-coated dish containing 10 mL ES cell media (Table 1). Plating at this low density will facilitate picking individual ES cell colonies.
4. Culturing Clones for Genotyping, Expression Analysis and Freezing Cell Stocks
- On day 4-5 after sorting, score each well of direct sorted 96-well plates for the presence of ES cell colonies.
- Dissociate ES cell colonies by removing the media and adding 30 µl of trypsin. Incubate at 37 °C for 5 min. Neutralize the trypsin by adding 170 µl of ES cell media (Table 1), and pipette up and down for complete dissociation of the colony into single cells. Grow the cells at 37 °C/5% CO2 until most wells are over 70% confluent (usually 2-3 days).
- Alternatively pick individual ES cell colonies from 10 cm dishes using an inverted microscope. After aspirating the colony into the pipette tip follow step 4.1.1 placing each colony in one well of a 96-well plate, pretreated with gelatin and containing 30 µl of trypsin.
Note: Colonies can sit in trypsin at RT while one entire row of colonies is picked. - Once all colonies have been picked and dissociated into media grow the cells at 37 °C in the CO2 incubator until most wells are over 70% confluent (usually 2 days).
- When the 96-well plates are ready for splitting, remove the media, add 30 µl of trypsin and incubate at 37 °C for 5 min. Neutralize the trypsin by adding 180 µl of ES cell media (Table 1) to each well and pipette up and down for complete dissociation into single cells.
- From the resulting 210 µl, seed 70 µl into three gelatin coated 96-well plates each containing 130 µl of ES cell media/well (Table 1). Use these plates for genotyping, expression analysis and freezing cell stocks for each clone as described below.
- When the genotyping plate reaches 70-85% confluence, treat the plate as described in section 6 "Genotyping the deletion".
- When the expression analysis plate reaches 70-85% confluence, remove the media, seal the plate with sealing tape and store at -80 °C until the clones have been genotyped.
Note: The expression analysis plate is useful to analyze changes in gene expression at early passages of the clones. Gene expression analysis from the 96-well plate is possible but as the cell numbers are low a RNA micro extraction kit is recommended. - Preparation of 96-well Plate Freeze Stock:
- When the plate for frozen cell stocks (stock-1) reaches 70-85% confluence, aspirate the media, add 30 µl of trypsin and incubate at 37 °C for 5 min.
- Neutralize the trypsin by adding 100 µl of ES cell media (Table 1) to each well and pipette up and down for complete dissociation into single cells.
- Transfer 15 µl of suspended cells from each well to two gelatin coated 96-well plates, each containing 185 µl of ES cell media (Table 1) and allow to grow at 37 °C/5% CO2.
Note: This is for stock-2 and -3 plates which are additional back-up clones in case reviving the cells from stock-1 is not successful.
- Meanwhile, to the 100 µl of the remaining cells in the 96-well plate (stock-1), add 100 µl of 2x freezing media (Table 6). Seal the plate with a sealing tape and quickly invert the plate 4-5 times for proper mixing. Store the plate at -80 °C until clones are genotyped.
- When the stock-2 and stock-3 plates are ready for freezing aspirate the media, add 30 µl of trypsin and incubate at 37 °C for 5 min. Neutralize the trypsin by adding 70 µl of ES cell media (Table 1) to each well and pipette up and down for complete dissociation into single cells.
- Add 100 µl of 2x freezing media, seal the plate with sealing tape and quickly invert the plate 4-5 times for proper mixing. Store the plate at -80 °C until these plates are needed.
5. Allele-specific Primer Design
- Design 4 sets of primers (Figure 1C) to screen the clones for the desired deletion: inside primers, outside primers, and gRNA flanking primers (for both 5' and 3' gRNA target sites) as described below.
- Obtain the SNP track corresponding to the 129 and Cast genotypes at http://labs.csb.utoronto.ca/mitchell/crispr.html. The given track shows base substitutions between 129 and Cast at coordinates in the mm9 mouse genome assembly.
Note: The link at the above site will redirect to the UCSC genome browser and add a custom track containing the SNPs between the 129 and Cast genomes. - Enter the co-ordinates of the region to be deleted. Zoom in on a region of about 500 bp in the middle of the desired deletion containing >3 SNPs.
- Go to view>DNA in the option bar and click get DNA to download the target sequence in all upper case format.
- Create two FASTA sequences; one for 129 and one for Cast by base substitution at the SNP position. Mark the SNPs by a lower case.
- Go to Primer3 plus (http://www.bioinformatics.nl/cgi-bin/primer3plus/primer3plus.cgi/) and paste the SNP substituted 129 sequence. Use the default settings to design primers.
- To design the inside allele-specific primers select Primer_List in the task drop menu and click Pick Primers. Choose a forward or reverse primer that has a SNP either in the 3' end or within 4 bases from the 3' and falls inside the region to be deleted.
Note: Primers that have a SNP at the 3'end display increased allele specificity in qPCR. - To select the second primer return to the main page, select Detection in the task drop menu and paste the first primer sequence in the appropriate box at the bottom of the page. In the General Settings tab change the setting for product size range to 80-200 bp and click Pick Primers. Chose a primer set from the listed primer pairs; these will be the 129 inside allele-specific primers.
- Repeat steps 5.1.5 to 5.1.7 to design primers for the Cast allele.
- Return to the UCSC genome browser and enter the co-ordinates of the region to be deleted. Go to view>DNA in the option bar, under Sequence Retrieval Region Options add 1,000 bp upstream and downstream click get DNA to download the target sequence.
- Mark the gRNA target sequence in brackets. Save this entire sequence before proceeding.
- To design the outside primers remove the sequence between the two gRNA target sequences. Repeat step 5.1.4-5.1.8 to design the outside allele-specific primers but change the product size 400-800 bp.
- Split the sequence obtained in step 5.1.10 into two sequences, each with 500 bp 5' and 3' of the gRNA target sequence. Repeat steps 5.1.5 to 5.1.7 designing non-allele specific primers for gRNA flanking regions but change the product size 400-800 bp.
Note: For non-allele specific primers, either 129 or Cast sequence can be used and primers should be chosen that do not contain a SNP. It is advisable to set a product size of 400-800 bp for designing outside and gRNA flanking primers. This allows for amplification even if small indels are present.
- Obtain the SNP track corresponding to the 129 and Cast genotypes at http://labs.csb.utoronto.ca/mitchell/crispr.html. The given track shows base substitutions between 129 and Cast at coordinates in the mm9 mouse genome assembly.
- Test the inside primers for allele specificity by qPCR using pure 129 and Cast strain genomic DNA at 2 ng/µl. Follow step 6.2-6.4 to set up the qPCR reaction.
Note: If the 129 genotype in the targeted region is the same as C57BL/6J, DNA from C57BL/6J can be used in the place of 129 DNA. Allele-specific primers should display at least 5 cycles difference between the Ct (cycle threshold) value on the correct vs. the incorrect genotype. The outside primers can be tested to ensure they amplify the deletion using Cas9/gRNA transfected ES cells, and F1 genomic DNA respectively as positive and negative controls. The allele-specificity of outside primers can be tested once the monoallelic clones have been identified.
6. Genotyping the Deletion
- Extract genomic DNA from the genotyping 96-well plate using the plate from step 4.6 that is generated after colony expansion.
- Prepare the genomic DNA extraction mix: 89 µl of water, 10 µl of 10x buffer and 1 µl of extraction reagent (supplied by the manufacturer). Add 100 µl of genomic DNA extraction mix to each well and seal the plate with a sealing tape.
- Incubate the plate at 75 °C for 5 min followed by 95 °C for 5 min.
- Allow the plate to cool by incubating on ice for a few min and then centrifuge briefly to settle any condensation to the bottom of the well. This serves as the template DNA plate for deletion screening.
- Set up the qPCR reactions in duplicate for each clone as follows: 5 µl of 2x SYBR qPCR mix, forward and reverse primer (3 µM) each 1 µl and 1 µl of water. Use a multichannel pipette to add 2 µl of template DNA followed by 8 µl of reaction mix to each well of a 384-well plate.
- Seal the plate with sealing tape and spin at 600 x g for 2 min to mix the contents. Place the 384-well plate array in the real time cycler.
- Program the real time cycler for a 2-step PCR followed by melt curve analysis with detection as follows: 1 cycle at 95 °C for 10 min, 40 cycles of 95 °C for 15 s, 62 °C for 30 sec with plate read and 95 °C for 10 s, 65 °C to 95 °C with increment of 5 °C for 5 sec + plate read.
Note: In addition to primer design, the qPCR mix and the cycle parameters also contribute to primer specificity. The parameters described above and reagents listed in the materials more frequently yield allele specific amplification. - Analyzing qPCR Results
- Check each allele for amplification with inside allele-specific primers. No amplification of one allele or high Ct value differences (>5 cycles) between alleles suggest these clones carry a heterozygous deletion of the allele with the high/absent Ct value. No amplification of both alleles suggests that they carry a homozygous deletion.
- Check each allele for amplification with outside allele-specific primers. When the target deletion is larger than 1 kb amplification with outside primers occurs only when a deletion is present. A Ct value of 22-28 confirms the deletion. For target deletions smaller than 1 kb, confirm the amplicon size by electrophoresis.
Note: If the outside primers show only moderate allele-specificity (see Figure 2), amplicons may be obtained with both allelic primer sets in monoallelic clones due to off target amplification of the outside primers. In this case a Ct value difference between the two alleles of at least five cycles should confirm the correct allele (lower Ct value) is deleted based on the results obtained from the inside primers. If the on target versus off target allele Ct difference is less than five cycles design new allele specific outside primers. - In monoallelic deletion clones check for the integrity of the non-deleted allele by using the secondary screening, gRNA flanking primers.
Note: Indels of >25 bp size around the gRNA target site can be identified by observing a shift in the melt curve in the qPCR for 400-800 bp amplicons. Alternatively, the amplicons from the gRNA flanking primers can be sequenced to detect small indels of <25 bp.- Perform qPCR with 2 sets of gRNA flanking primers i.e., 5' and 3' gRNA used in generating CRISPR deletion. No amplification with these sets of primers indicates indels larger than the qPCR amplicon are present at the gRNA target site on the non-deleted allele of monoallelic deletion clones. Discard clones containing these large indels from further analysis as the results may be difficult to interpret without knowing the extent of the deletion.
- Purify the amplicons obtained from the outside primer qPCR reaction using a PCR clean up kit following manufacturer's instruction.
- Confirm the sequence of the deleted allele by DNA sequencing the purified PCR product from the previous step. Use the qPCR amplification primers for forward and reverse sequencing.
Note: At this stage SNPs within the amplicon act as a secondary confirmation of the genotype of the deleted allele.
7. Analyzing Expression with Allele Specific Primers
- Thaw the 96-well cell stock plate stored at -80 °C (stock-1 from step 4.9) by placing it on a warm bead bath. When more than half of the wells in the plate are thawed, spin at 300 x g for 5 min.
- Carefully, remove the sealing tape and quickly transfer the cells from the deletion positive wells into gelatin-coated, 12-well plates containing 1 ml of ES cell media (Table 1) and incubate at 37 °C/5% CO2.
- When the plate reaches 70-85% confluence, passage the cells and split them into three wells of a gelatin-coated, 6-well plate, each containing 2 ml of ES cell media (Table 1). Use two wells to prepare 2 vials of frozen cell stocks for long-term storage in liquid nitrogen (described in step 8) and the third well for RNA extraction.
- Extract RNA using an RNA extraction kit.
- Convert 100-500 ng of RNA to cDNA by reverse transcribing (RT) the RNA using the cDNA synthesis kit following the manufacturer's protocol. Include an RT negative reaction for each RNA sample to monitor the amount of contaminating DNA in the RNA samples.
- Dilute the cDNA before qPCR in a ratio of between 1:2 and 1:4; depending on the expression level of the target gene in ES cells.
- Set the qPCR as described above including F1 genomic DNA as standard curve (5 fold dilutions from 250 to 0.08 ng/µl) for absolute quantification of transcript levels. Compare the expression of each allele of the gene of interest in each confirmed deleted clone to a suitable control gene, for example Gapdh (primers listed in Table 7).
Note: Control gene primers do not need to be allele specific. Allele-specific primer design is the same for RT-qPCR primers as described for genotyping primers with the exception of the target region for amplification. The gene sequence should be used; if using primers for a single exon or an exon-intron boundary (to monitor primary transcript) F1 genomic DNA can be used for the standard curve. For further details on RT-qPCR please refer to Forlenza et al. 201233.
8. Freeze Stock Preparation for Long-term Storage of ES Cells
- Add 300 µl of trypsin to each 6-well (from step 7.3) and incubate for 5 min at 37 °C. Add 2 ml of spin media (Table 2) to neutralize trypsin and pipette up and down several times to dissociate into single cells.
- Transfer the cells into a 15 ml tube and spin at 300 x g for 5 min.
- Aspirate the supernatant and add 500 µl of ES cell media (Table 1). Pipette up and down to resuspend the cells.
- Transfer the content to a 1.5 ml cryovial tube and add 500 µl of 2x ES cell freezing media (Table 3). Mix well by inverting the tube and place the tube into an alcohol-free cell freezing container. Place this cell freezing containers at -80 °C for at least 12 hr before transferring into a liquid nitrogen storage tank.
Results
The protocol described here uses F1 ES cells to study cis-regulation of gene expression in monoallelic enhancer deleted cells generated using CRISPR/Cas9 genome editing (Figure 1). The gRNA and allele-specific primer design for genotyping and gene expression are the key factors in this approach. Each allele-specific primer set must be validated by qPCR to confirm allele specificity. Allele-specific primers that amplify only their respective genomic DNA target are ideal (Figure 2). Ideally these primers have a SNP at their 3' end. Primers with less allele-specificity can be used if they display a minimum of a 5 Ct value difference in their amplification of the correct vs. the incorrect genotype25. Primers that carry a SNP more 5' than the 4th base from the 3' end usually fail to exhibit allele specificity and amplify both genotypes with equal efficiency, revealing the importance of the SNP position in the primer34. In addition a purine/purine or pyrimidine/pyrimidine substitution has been shown to have a greater impact on the Tm difference of two primers compared to a purine/pyrimidine substitution25.
Primary screening of a 96-well plate of DNA isolated from ES cell clones is conducted with allele-specific inside primers to identify clones that carry a deletion on one or both alleles. These deleted clones are further screened with outside allele-specific primers to confirm each deletion. The example given here is from an efficient gRNA pair that resulted in 46% of clones carrying a deletion on the 129, Cast, or both alleles (Figure 3). Secondary screening is done for confirmed monoallelic deletion clones to identify indels around the gRNA target sites on the non-deleted allele as the frequency of indel occurrence at the gRNA target site is high23. Indels around the gRNA are not identifiable in the primary screening, as these clones show no deletion with inside primers and do not amplify with the outside primers (Figure 4). Monoallelic deletion clones that give amplification with both sets of left and right gRNA flanking primers have their other allele largely intact as they do not contain a deletion larger than the 5' or 3' gRNA flanking amplicons. Sequencing the amplicons from the gRNA flanking primers will identify indels smaller than the gRNA flanking amplicons which may not be noticeable in the qPCR. The monoallelic deletion clones that do not give amplification at both regions in the secondary screening are not included for further gene expression analysis. As gRNA target regions are chosen outside the region suspected to have enhancer function, indels smaller than the gRNA flanking amplicons are not likely to affect enhancer function and clones containing these can be included in further analysis.
To restrict a large deletion to one allele a gRNA can be chosen which overlaps a SNP in the seed region or the PAM. Described here is an example of a high-efficiency deletion (53%) on the 129 allele due to a SNP in the PAM for the 3' gRNA on the Cast allele (Figure 5). This deletion removed the SCR, a recently described Sox2 specific enhancer in ES cells18,22. Although the introduction of the large deletion was greatly reduced on the Cast allele, three clones (1, 11, 75) were identified with a large deletion on the Cast allele (Figure 5). Of these three clones two (1, 11) contained 3' break points within 50 bp of the 3' gRNA target region. For the third clone we were not able to identify the 3' break point and concluded that the deletion was greater than 11 kb18. Deletions with one or both of their break points located >100 bp from either the 5' of 3' gRNA target region are difficult to genotype, generally account for 15-30% of all clones, and remain uncharacterized in the primary screening as the deletion is not amplified with the outside primers.
Once clones with monoallelic deletion have been identified they are analyzed for allele-specific gene expression using absolute quantification by reverse transcription qPCR. Gene expression from clones carrying a monoallelic deletion of the critical Sox2 enhancer region, the SCR, is shown here compared with expression in wild-type F1 ES cells (Figure 6). Specifically, clones carrying a deletion of the enhancer region on the 129 allele displayed a decrease in 129 transcript levels whereas clones carrying a deletion on the Cast allele displayed a decrease in Cast transcript levels. The allele-specific gene expression analysis revealed that this distal enhancer region, SCR, is a critical cis-regulator of Sox2 in ES cells18.
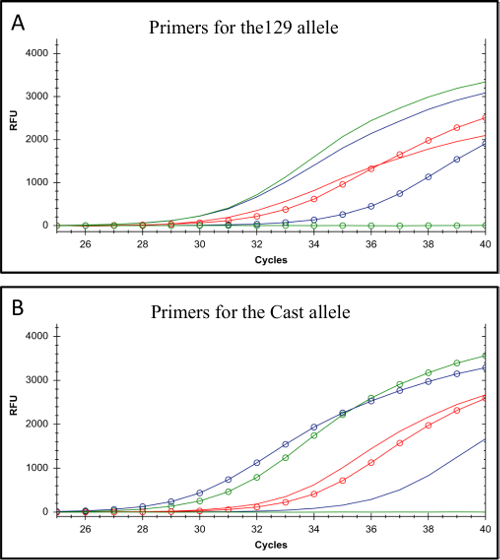
Figure 2. Testing the allele-specificity of 129 and Cast allele-specific primers. (A) Amplification from primers for the 129 genotype. (B) Amplification from primers for the Cast genotype. In both A and B the lines display the amplification profiles for C57BL/6 genomic DNA which has the same genotype as 129 DNA at these specific SNPs; the lines with open circles display the amplification profiles for Cast genomic DNA. Amplification resulting from the primer set with the most allele-specificity is shown in green (Allele-specific primer-1), a primer set displaying a 5 Ct difference is shown in purple (Allele-specific primer-2) and a primer set displaying a minimal difference in Ct value is represented in red (Allele-specific primer-3, primer details in Table 7). The red primer set would not be appropriate for allele-specific screening. RFU denotes relative fluorescence units. Please click here to view a larger version of this figure.
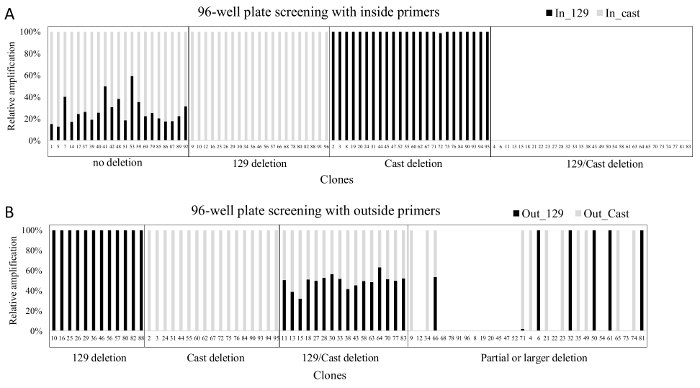
Figure 3. Results obtained after screening a 96-well plate with allele-specific inside and outside primers. (A) qPCR results from the screen with inside primers (Enh_del_IS_F1_129, Enh_del _IS_F1C, Enh_del _IS_R1) B) qPCR results from the screen with outside primers (Enh_del_OS_F1, Enh del_OS_R1_129, Enh_del_OS_F2C, Enh_del_OS_R3, primer details in Table 7). In both grey bars represent amplification from Cast-specific primers and black bars represent amplification from 129-specific primers. Note that only clones with a deletion on one or both alleles are screened with the outside primers. The relative amplification of each allele was calculated using 2-CT to approximate the initial concentration and subsequently expressing each allele as a percentage of the sum of the two alleles. Please click here to view a larger version of this figure.
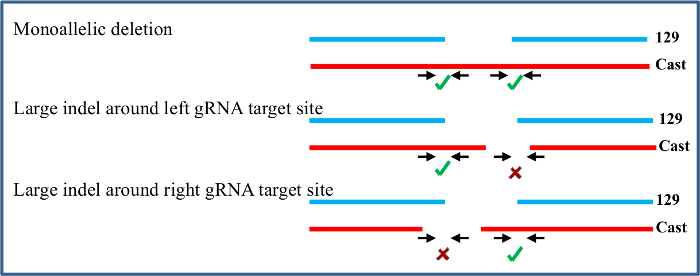
Figure 4. Clones with a monoallelic deletion are screened to identify large indels at the gRNA target sites. Primers flanking the gRNA target regions are used to confirm that the non-deleted allele is intact. Only monoallelic clones without large indels at the target sites on the non-deleted allele are used in the subsequent expression analysis. Please click here to view a larger version of this figure.
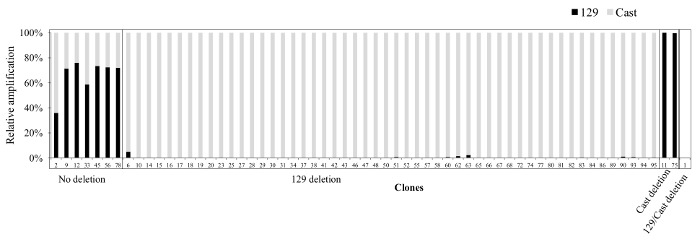
Figure 5. Clones obtained from the Sox2 SCR deletion. Shown are the qPCR results from a screen with inside primers (pr111R, pr111F_129, pr111F_Cast, details in Table 7). Grey bars represent amplification from Cast-specific primers and black bars represent amplification from 129-specific primers. Note that the deletion is heavily skewed towards the 129 allele due to the presence of a SNP in the PAM of the 3' gRNA target region on the Cast allele. The relative amplification of each allele was calculated using 2-CT to approximate the initial concentration and subsequently expressing each allele as a percentage of the sum of the two alleles. Please click here to view a larger version of this figure.
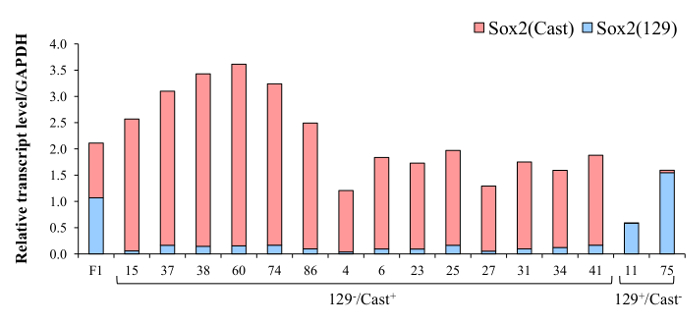
Figure 6. SCR deletion dramatically reduces the expression of Sox2. Representative results from 129 or Cast SCR deleted clones. Red bars represent expression of the Sox2 Cast allele and blue bar represents amplification of the Sox2 129 allele. Deletion of the SCR on the 129 allele reduced expression of Sox2 (129) whereas deletion of the SCR on the Cast allele reduced expression of Sox2 (Cast). Data displayed are an average of three technical replicates, error bars not shown. Primers used for Sox2 expression analysis [Sox2_F, Sox2(129)_R, Sox2(Cast)_R] are listed in Table 7. Please click here to view a larger version of this figure.
| Reagent | Stock concentration | Volume | Final concentration |
| GlutaMAX | 200 mM | 6 ml | 2 mM |
| 2-Mercaptoethanol | 10 mM | 6 ml | 0.1 mM |
| MEM Non-essential aminoacids (NEAA) | 10 mM | 6 ml | 0.1 mM |
| Sodium Pyruvate | 100 mM | 6 ml | 1 mM |
| Pencillin/Streptomycin | 10,000 units | 3 ml | 50 U/ml |
| FBS | 90 ml | 15% | |
| CHIR99021* | 10 mM | 3 µM | |
| PD0325901* | 10 mM | 1 µM | |
| LIF* | 107 units/ml | 1000 U/ml | |
| # to prepare ES cell media, add the above components to 500 ml of high glucose DMEM. The ES cell media should not be stored for more than 4 weeks and with inhibitors* not more than 2 weeks. | |||
Table 1. ES cell media.
| Reagent | Stock concentration | Volume | Final concentration |
| GlutaMAX | 200 mM | 5 ml | 2 mM |
| Pencillin/Streptomycin | 10,000 units | 5 ml | 100 U/ml |
| FBS | 50 ml | 10% | |
| # to prepare Spin media, add the above components to 500 ml of high glucose DMEM. | |||
Table 2. Spin media.
| Reagent | Final concentration | Volume (50 ml) |
| 1x PBS without Ca/Mg2+ | 42.0 ml | |
| BSA Fraction V (7.5 %) | 15% (v/v) | 7.5 ml |
| 0.5 M EDTA | 5 mM | 0.5 ml |
Table 3. Collection buffer.
| Reagent | Final concentration | Volume (50 ml) |
| 1x HBSS | 47.25 ml | |
| 1M HEPES | 25 mM | 1.25 ml |
| 0.5 M EDTA | 5 mM | 0.5 ml |
| BSA Fraction V (7.5 %) | 1% (v/v) | 0.5 ml |
| FBS | 1% (v/v) | 0.5 ml |
Table 4. Sorting buffer.
| ES cell media | 60% |
| FBS | 40% |
Table 5. Recovery media.
| ES cell media | 60% |
| FBS | 20% |
| DMSO | 20% |
Table 6. 2x freezing media.
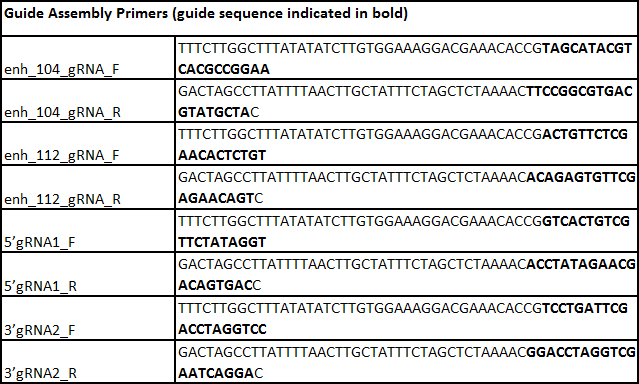
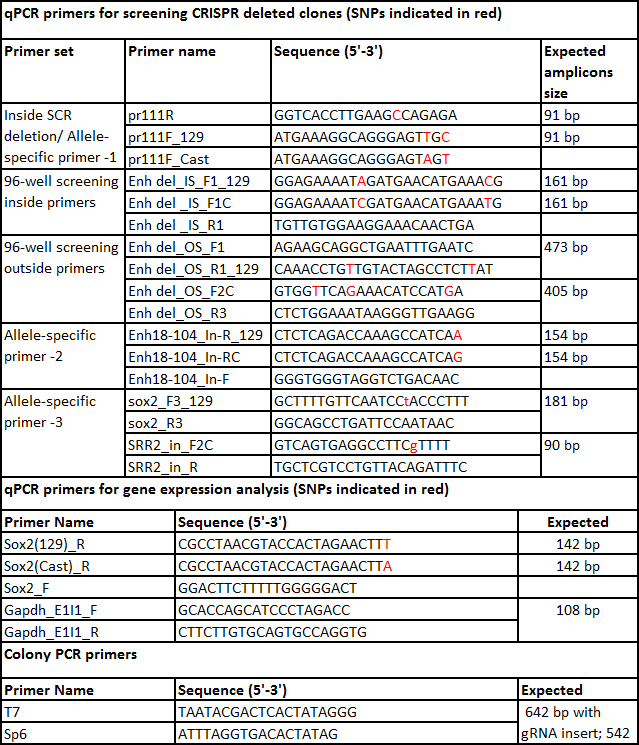
Table 7. List of primers.
Discussion
CRISPR/Cas9 mediated genome editing technology provides a straightforward, fast and inexpensive method for genome modification. The method detailed here to generate and analyze monoallelic enhancer deletion for functional enhancer characterization takes advantage of SNPs in F1 mouse cells. The advantages of this type of approach are: 1) monoallelic enhancer deletions do not produce confounding effects that occur when a critical enhancer is deleted from both alleles, i.e., a great reduction in the protein levels of the regulated gene leading to cell lethality or altered phenotype; 2) if the frequency of monoallelic deletion is low obtaining a homozygous deletion is less likely; however, with the use of allele-specific primers in gene expression analysis one can analyze clones with a monoallelic deletion; 3) using four sets of primers to screen monoallelic deletions permits the elimination of clones containing partial or large deletions which confound the downstream analysis.
Allele-specific primer design is critical for genotyping mono/biallelic CRISPR deletions and analyzing the effect on gene expression in an allele-specific manner. This is more easily achieved when the F1 cells used contain more frequent SNPs that allow discrimination of the two alleles. Here ES cells generated from a Mus musculus129 x Mus castaneus cross are used; however, other cells could be used if SNPs between the two alleles allow for allele-specific deletion screening and expression analysis, and if sufficient data exist to predict active enhancer regions to be targeted in the chosen cell type. Therefore, this method can be adapted to any cell line where information about allelic SNPs is available. One of the limitations of the protocol is the dependence on SNPs at specific locations. Some target regions carry fewer SNPs which makes designing allele-specific outside primers that amplify a <800 bp fragment challenging. In such cases a PCR approach could be used as an alternative to qPCR screening allowing for a larger amplicon. In addition there may be SNP associated differences in the phenotype of F1 ES cells; to confirm the function of specific enhancers in additional genotypes homozygous deletions can be conducted in standard ES lines. The specificity of the SpCas9 nuclease is an important issue especially in considering potential applications in clinical approaches. Investigation into SpCas9 specificity has revealed that both the 6-12 nt seed region of the gRNA recognition sequence and the adjacent PAM are important for nuclease activity13-14,17. Off target mutations can be minimized by ensuring that the seed region and adjacent PAM are unique in the genome being modified14,16.
A monoallelic deletion approach described here coupled with allele specific RNA-seq can definitively reveal the gene or genes regulated by a specific enhancer18. These experiments are important for understanding genome function as deletion of even reporter-assay validated enhancers does not always affect gene expression18. Furthermore, enhancers may not regulate the closest gene in the genome or may regulate more than one gene1,20,35. As a result, loss-of-function analysis is the most informative approach to determine the function of an enhancer region. This can be rapidly achieved using CRISPR/Cas9-mediated monoallelic deletion.
Disclosures
The authors have read JoVE's policies on conflict of interest and have no conflicts to disclose.
Acknowledgements
We would like to thank all the members of the Mitchell lab for helpful discussions. This work was supported by the Canadian Institutes of Health Research, the Canada Foundation for Innovation and the Ontario Ministry of Research and Innovation (operating and infrastructure grants held by JAM).
Materials
| Name | Company | Catalog Number | Comments |
|---|---|---|---|
| Phusion High-Fidelity DNA Polymerase | NEB | M0530S | high fidelity DNA polymerase used in gRNA assembly |
| Gibson Assembly Master Mix | NEB | E2611L | |
| gRNA_Cloning Vector | Addgene | 41824 | A target sequence is cloned into this vector to create the gRNA plasmid |
| pCas9_GFP | Addgene | 44719 | Codon-optimized SpCas9 and EGFP co-expression plasmid |
| AflII | NEB | R0520S | |
| EcoRI | NEB | R3101S | |
| Neon Transfection System 100 µL Kit | Life Technologies | MPK10096 | Microporator transfection technology |
| prepGEM | ZyGEM | PT10500 | genomic DNA extraction reagent |
| Nucleo Spin Gel & PCR Clean-up | Macherey-Nagel | 740609.5 | |
| High-Speed Plasmid Mini Kit | Geneaid | PD300 | |
| Maxi Plasmid Kit Endotoxin Free | Geneaid | PME25 | |
| SYBR select mix for CFX | Life Technologies | 4472942 | qPCR reagent |
| iScript cDNA synthesis kit | Bio-rad | 170-8891 | Reverse transcription reagent |
| 0.25% Trypsin with EDTA | Life Technologies | 25200072 | |
| PBS without Ca/Mg2+ | Sigma | D8537 | |
| 0.5 M EDTA | Bioshop | EDT111.500 | |
| HBSS | Life Technologies | 14175095 | |
| 1 M HEPES | Life Technologies | 13630080 | |
| BSA fraction V (7.5%) | Life Technologies | 15260037 | |
| Max Efficiency DH5α competent cells | Invitrogen | 18258012 | |
| FBS | ES cell qualified | FBS is subjected to a prior testing in mouse ES cells for pluripotency | |
| DMSO | Sigma | D2650 | |
| Glutamax | Invitrogen | 35050 | |
| DMEM | Life Technologies | 11960069 | |
| Pencillin/Streptomycin | Invitrogen | 15140 | |
| Sodium pyruvate | Invitrogen | 11360 | |
| Non-essential aminoacid | Invitrogen | 11140 | |
| β-mercaptoethanol | Sigma | M7522 | |
| 96-well plate | Sarstedt | 83.3924 | |
| Sealing tape | Sarstedt | 95.1994 | |
| CoolCell LX | Biocision | BCS-405 | alcohol-free cell freezing container |
| CHIR99021 | Biovision | 1748-5 | Inhibitor for F1 ES cell culture |
| PD0325901 | Invivogen | inh-pd32 | Inhibitor for F1 ES cell culture |
| LIF | Chemicon | ESG1107 | Inhibitor for F1 ES cell culture |
References
- Sagai, T., Hosoya, M., Mizushina, Y., Tamura, M., Shiroishi, T. Elimination of a long-range cis-regulatory module causes complete loss of limb-specific Shh expression and truncation of the mouse limb. Development. 132 (4), 797-803 (2005).
- Kleinjan, D. A., Lettice, L. A. Long-range gene control and genetic disease. Adv Genet. 61, 339-388 (2008).
- Visel, A., Rubin, E. M., Pennacchio, L. A. Genomic views of distant-acting enhancers. Nature. 461 (7261), 199-205 (2009).
- Maurano, M. T., et al. Systematic localization of common disease-associated variation in regulatory DNA. Science. 337 (6099), 1190-1195 (2012).
- Heintzman, N. D., et al. Histone modifications at human enhancers reflect global cell-type-specific gene expression. Nature. 459 (7243), 108-112 (2009).
- Shen, Y., et al. A map of the cis-regulatory sequences in the mouse genome. Nature. 488 (7409), 116-120 (2012).
- Johnson, D. S., Mortazavi, A., Myers, R. M., Wold, B. Genome-wide mapping of in vivo protein-DNA interactions. Science. 316 (5830), 1497-1502 (2007).
- Rhee, H. S., Pugh, B. F. Comprehensive genome-wide protein-DNA interactions detected at single-nucleotide resolution. Cell. 147 (6), 1408-1419 (2011).
- Whyte, W. A., et al. Master transcription factors and mediator establish super-enhancers at key cell identity genes. Cell. 153 (2), 307-319 (2013).
- Chen, C. Y., Morris, Q., Mitchell, J. A. Enhancer identification in mouse embryonic stem cells using integrative modeling of chromatin and genomic features. BMC Genomics. 13 (1), 152(2012).
- Patwardhan, R. P., et al. Massively parallel functional dissection of mammalian enhancers in vivo. Nat Biotechnol. 30 (3), 265-270 (2012).
- Melnikov, A., et al. Systematic dissection and optimization of inducible enhancers in human cells using a massively parallel reporter assay. Nat Biotechnol. 30 (3), 271-277 (2012).
- Jinek, M., et al. A programmable dual-RNA-guided DNA endonuclease in adaptive bacterial immunity. Science. 337 (6096), 816-821 (2012).
- Cong, L., et al. Multiplex genome engineering using CRISPR/Cas systems. Science. 339 (6121), 819-823 (2013).
- Mali, P., et al. RNA-guided human genome engineering via Cas9. Science. 339 (6121), 823-826 (2013).
- Hsu, P. D., et al. DNA targeting specificity of RNA-guided Cas9 nucleases. Nat Biotechnol. 31 (9), 827-832 (2013).
- Cho, S. W., et al. Analysis of off-target effects of CRISPR/Cas-derived RNA-guided endonucleases and nickases. Genome Res. 24 (1), 132-141 (2014).
- Zhou, H. Y., et al. A Sox2 distal enhancer cluster regulates embryonic stem cell differentiation potential. Genes Dev. 28 (24), 2699-2711 (2014).
- Fujii, W., Kawasaki, K., Sugiura, K., Naito, K. Efficient generation of large-scale genome-modified mice using gRNA and CAS9 endonuclease. Nucleic Acids Res. 41 (20), e187(2013).
- Tuan, D. Y., Solomon, W. B., London, I. M., Lee, D. P. An erythroid-specific, developmental-stage-independent enhancer far upstream of the human 'beta-like globin' genes. Proc Natl Acad Sci U S A. 86 (8), 2554-2558 (1989).
- Amano, T., et al. Chromosomal dynamics at the Shh locus: limb bud-specific differential regulation of competence and active transcription. Dev Cell. 16 (1), 47-57 (2009).
- Li, Y., et al. CRISPR reveals a distal super-enhancer required for Sox2 expression in mouse embryonic stem cells. PLoS One. 9 (12), e114485(2014).
- Canver, M. C., et al. Characterization of genomic deletion efficiency mediated by clustered regularly interspaced palindromic repeats (CRISPR)/Cas9 nuclease system in mammalian cells. J Biol Chem. 289 (31), 21312-21324 (2014).
- Mlynarczyk-Evans, S., et al. X chromosomes alternate between two states prior to random X-inactivation. PLoS Biol. 4 (6), e159(2006).
- Lefever, S., Pattyn, F., Hellemans, J., Vandesompele, J. Single-nucleotide polymorphisms and other mismatches reduce performance of quantitative PCR assays. Clin Chem. 59 (10), 1470-1480 (2013).
- Huang, M. M., Arnheim, N., Goodman, M. F. Extension of base mispairs by Taq DNA polymerase: implications for single nucleotide discrimination in PCR. Nucleic Acids Res. 20 (17), 4567-4573 (1992).
- Keane, T. M., et al. Mouse genomic variation and its effect on phenotypes and gene regulation. Nature. 477 (7364), 289-294 (2011).
- Yalcin, B., et al. Sequence-based characterization of structural variation in the mouse genome. Nature. 477 (7364), 326-329 (2011).
- Gibson, D. G., et al. Enzymatic assembly of DNA molecules up to several hundred kilobases. Nat Methods. 6 (5), 343-345 (2009).
- Gibson, D. G., Smith, H. O., Hutchison, C. A., Venter, J. C., Merryman, C. Chemical synthesis of the mouse mitochondrial genome. Nat Methods. 7 (11), 901-903 (2010).
- Ding, Q., et al. Enhanced efficiency of human pluripotent stem cell genome editing through replacing TALENs with CRISPRs. Cell Stem Cell. 12 (4), 393-394 (2013).
- Basu, S., Campbell, H. M., Dittel, B. N., Ray, A. Purification of specific cell population by fluorescence activated cell sorting (FACS). J Vis Exp. (41), (2010).
- Forlenza, M., Kaiser, T., Savelkoul, H. F., Wiegertjes, G. F. The use of real-time quantitative PCR for the analysis of cytokine mRNA levels. Methods Mol Biol. 820, 7-23 (2012).
- Wu, J. H., Hong, P. Y., Liu, W. T. Quantitative effects of position and type of single mismatch on single base primer extension. J Microbiol Methods. 77 (3), 267-275 (2009).
- Sanyal, A., Lajoie, B. R., Jain, G., Dekker, J. The long-range interaction landscape of gene promoters. Nature. 489 (7414), 109-113 (2012).
Reprints and Permissions
