Filamentous actin (F-actin) plays an important role in spinogenesis, synaptic plasticity, and synaptic stability. Quantification of F-actin puncta is therefore a useful tool to study the integrity of synaptic structures. This protocol describes the procedures of quantifying F-actin puncta labeled with Phalloidin in low-density primary cortical neuronal cultures.
Method Article
Quantification of Filamentous Actin (F-actin) Puncta in Rat Cortical Neurons
* These authors contributed equally
Opens in a new tab
In This Article
Summary
Loading...
$$\rightleftharpoonup{xx}$$
$$\longleftharp{xx}$$,
$$\longrightharp{xx}$$,
Abstract
Loading...
$$\rightleftharpoonup{xx}$$
$$\longleftharp{xx}$$,
$$\longrightharp{xx}$$,
Filamentous actin protein (F-actin) plays a major role in spinogenesis, synaptic plasticity, and synaptic stability. Changes in dendritic F-actin rich structures suggest alterations in synaptic integrity and connectivity. Here we provide a detailed protocol for culturing primary rat cortical neurons, Phalloidin staining for F-actin puncta, and subsequent quantification techniques. First, the frontal cortex of E18 rat embryos are dissociated into low-density cell culture, then the neurons grown in vitro for at least 12-14 days. Following experimental treatment, the cortical neurons are stained with AlexaFluor 488 Phalloidin (to label the dendritic F-actin puncta) and microtubule-associated protein 2 (MAP2; to validate the neuronal cells and dendritic integrity). Finally, specialized software is used to analyze and quantify randomly selected neuronal dendrites. F-actin rich structures are identified on second order dendritic branches (length range 25-75 µm) with continuous MAP2 immunofluorescence. The protocol presented here will be a useful method for investigating changes in dendritic synapse structures subsequent to experimental treatments.
Introduction
Loading...
$$\rightleftharpoonup{xx}$$
$$\longleftharp{xx}$$,
$$\longrightharp{xx}$$,
The primary goal of this study is to develop a reliable method of measurement (estimation) of synaptic integrity of the neuronal dendritic network. Here we describe quantification of F-actin puncta in primary rat cultured neurons using a combination of Phalloidin staining and immunocytochemical (ICC) detection of dendrites with subsequent analysis using specialized (NIS-Elements) software.
Labeled phallotoxins have similar affinity for both large and small filaments (F-actin) but do not bind to monomeric globular actin (G-actin), unlike some actin antibodies 1. Nonspecific binding of Phalloidin is negligible, thus providing minimal background during cellular imaging. Phalloidin is much smaller than antibodies that would typically be used to label cellular proteins for fluorescent microscopy, which allows for much more intense labeling of F-actin by Phalloidin. Thus, detailed images of F-actin localization in neurons can be obtained through the use of labeled Phalloidin.
Phalloidin (F-actin) staining of neuronal dendrites generates discrete "hot spots" or bright "puncta", which represent a variety of dendritic structures, including mature spines, non-spiny synapses 2 and immature spines. Immature spines include thin filopodia and some forms of patch morphology, and may represent the initiation of spinogenesis 3. Immature spines and non-spiny patches lack PSD95 4. Changes in production of F-actin lead to subsequent changes in not only spines but also additional dendritic structures, thus making Phalloidin an important tool for investigating synaptodendritic integrity 5-7. In general, numbers of Phalloidin-positive (F-actin) puncta reflect a balance among active synapses (excitatory and inhibitory), actin dynamics and synapse stability 8.
Although it is important to study specific types of synapses (i.e., excitatory spines), when the target of a treatment is unknown it is necessary to first estimate the general integrity of a variety of dendritic structures. Since F-actin is a major component of dendritic spines and other structures, including inhibitory synapses, an altered number of F-actin puncta may indicate a synaptopathy. This synaptopathy may then be investigated further for more specific alterations. Our quantification method for detecting multiple synaptic types/structures yields an overall estimate of dendritic synaptic alterations (increases and decreases) following various experimental treatments.
Protocol
Loading...
$$\rightleftharpoonup{xx}$$
$$\longleftharp{xx}$$,
$$\longrightharp{xx}$$,
All animal protocols were reviewed and approved by the Animal Care and Use Committee at the University of South Carolina (assurance number: A3049-01).
1. Low-density Embryonic Neuronal Culture
- Preparation for primary cortical neuron culture
- Solutions:
- Prepare Poly-L-Lysine stock solution by dissolving 5 mg of Poly-L-Lysine in 10 ml Borate buffer.
- Prepare working solution by diluting 1 ml Poly-L-Lysine Stock in 49 ml Borate Buffer.
- Prepare borate Buffer, pH 8.4 by starting with 395 ml dH2O and then adding all ingredients (1.24 g boric acid + 1.9 g of Borax). Adjust pH to 8.4 by 1 M NaOH. Adjust to 400 ml and filter with 0.2 µm nylon membrane filter under hood.
- Prepare HBSS solution, pH 7.2 by starting with 445 ml dH2O and adding all other ingredients (50 ml 10X HBSS Stock + 1.2 g HEPES). Adjust pH to 7.2 by 1 N HCl, bring to 500 ml and filter with 0.2 µm nylon membrane filter under hood.
- Prepare plating medium: DMEM/F12 with 10% fetal bovine serum. Filter with 0.2 µm nylon membrane filter under hood.
- Prepare complete growth medium: To 50 ml Neurobasal medium, add the supplements (500 µl GlutaMax (100X) + 500 µl Glucose + 1 ml B-27 (50X) + 500 µl of Antibiotic-Antimycotic solution (100X) + 100 µl 7.5% Sodium Bicarbonate. Filter with 0.2 µm nylon membrane filter under hood.
- Two days before culture:
- Coat twelve 35 mm glass-bottom dishes with 2 ml of Poly-L-Lysine working solution, and keep under the hood O/N.
- One day before culture:
- Empty coating agent from the dishes and rinse with ddH2O. Allow dishes to dry for an hour under hood.
- Prepare plating medium (DMEM/F12 with 10% fetal bovine serum (10% of total solution). Pipette 2 ml medium into each dish, and incubate O/N at 37 oC, 5% CO2.
Note: It is important to avoid plastic culture dishes when culturing. Use of glass-bottom dishes (for inverted microscopes) or glass coverslips (for upright microscopes) yields sharp and clear images. Compared to a plastic-bottom dish, the glass-bottom dish avoids unwanted hues or glare during fluorescent microscopy.
- Solutions:
- Cell culture protocol:
- Put refrigerated HBSS Buffer (100-150 ml), 100 mm petri dishes, forceps, scissors, 50 ml tubes, and 15 ml tubes under UV light in hood.
- Euthanize pregnant rat with lethal inhalation of 5% sevoflurane under the hood outside of culture room.
- Sterilize with 70% EtOH, tent the skin of the lower abdomen using forceps while cutting from the tail up in the middle of abdominal cavity.Open the uterus using scissors to expose the placenta.
- Remove 8-10 E18 fetuses. Place 8-10 fetuses in petri dishes containing HBSS solution.
- Hold the back of the head of the fetus with forceps, then use scissors to sever the head from body. Place it in another petri dish filled with 5-7 ml of HBSS. Transfer dish to hood.
- Fill two additional 100 mm petri dish with cold HBSS.
- Peel aside skull, and scoop brain into a new petri dish filled with HBSS.
- Use sharp curved forceps, separate cerebellum and brain stem from brain, then transfer brain to a new petri dish with cold HBSS in it.
- Use tweezers to secure, separate the hemispheres with curved forceps. Remove meninges; isolate frontal cortex and transfer pieces into marked 15 ml centrifuge tubes.
- Fill the 15 ml tube with fresh 2 ml HBSS and add 20 µl Trypsin EDTA (10x concentrated mixture with 0.5% Trypsin and 5.3 mM EDTA.) to each 15 ml tube.
- Incubate 10-15 min at RT. Gently swirl tube every few minutes, do not allow settling.
- After 10-15 min, use glass pipette to remove old HBSS and rinse twice with new HBSS.
- Immerse in trypsin inhibitor (1 mg/ml, 2 mg Trypsin inhibitor in 2 ml HBSS), mix well and let it sit 5 min. Wash twice with fresh HBSS.
- Using glass pipette with rubber bulb, triturate brain pieces 10-15 times very slowly so as to avoid bubbles.Triturate again using a calibrated pipette and a sterile tip with a reduced tip diameter very slowly until homogeneous.
- Transfer dissociated cells at desired density to pre-prepared coated culture dishes (50 cells/mm2). Incubate O/N at 37 oC, 5% CO2.
- After 24 hr, replace DMEM/F12 medium with freshly made complete growth serum-free Neurobasal medium.
- Maintain the cells at all times in a 5% CO2/95% room air humidified incubator for at least 12-14 days before experimentation. Supplement the cells every 5-6 days with fresh Neurobasal medium replacing approximately 50% of the old medium.
2. Fluorescent Labeling and Immunocytochemistry
Note: The immunofluorescent labeling of primary cortical cell cultures was carried out in glass bottom 35 mm cell culture dishes with a working volume of 1 ml.
- Wash the glass-bottom dish twice with phosphate-buffered saline pH 7.4 (PBS).
- Fix cells with 4% paraformaldehyde for 15 min at RT.
- Wash cells twice with PBS and permeabilize with 0.1% Triton X-100 in PBS for 5 min.
- Treat cells for 20 min at RT with an F-actin specific stain, AlexaFluor 488 Phalloidin (1:40, 25 µl of Phalloidin in 1 ml PBS).
- Rinse cells twice with PBS and block with 10% normal goat serum at RT for 1-2 hr.
- Dilute the chicken polyclonal anti-MAP2 antibody (1:2,500) in PBS with 2% normal goat serum and incubate O/N at 4 oC.
- Following incubation, rinse in PBS twice.
- Dilute the secondary antibody (Alexa Red 594-conjugated goat anti-chicken IgG (1:500) with 2% normal goat serum and incubate for 2 hr at RT.
- Rinse with PBS and add 10 µl/dish of Hoescht dye.
- Incubate 3 min at RT and wash with PBS twice.
Note: The labeled cells now ready for step 3 (F-actin puncta counting). - Preserve cell sample with 100 µl of antifade reagent as a coverslipping agent and keep at 4 oC in the dark for long term storage.
Note: Phalloidin is relatively stable in PBS at +4 °C in the dark for up to 1 week and fluorescence can be preserved with antifade coverslipping reagents. However, optimal images are obtained from 1-3 days after staining since Phalloidin may start to diffuse out with extended storage.
3. F-actin Puncta Counting
- Turn on fluorescent microscope and switch to 20× objective. Open microscope software, and set up program at 1280×960 pixel image size, and 0.17 µm/pixel image resolution at 1× zoom.
- Acquire images of co-labeled F-actin/MAP2 neurons under green (495 nm)/red (613 nm) fluorescent channels.
- Choose 5 Green (F-actin)/Red (MAP2) immunolabeled/Blue (Hoescht) fluorescent images of individual neuron with clearly defined dendritic arbors.
- Identify the F-actin rich structures in second order dendritic segment (length range 25-75 µm) with continuous MAP2 immunofluorescence.
- Rotate the selected region of images to a horizontal level. Copy and paste as a new image.
- Subtract the background of images, using a consistent adjustments for each dish.
- Count the bright green F-actin puncta and trace the length of selected dendritic segment manually by trained independent observers. Export the data to a spreadsheet file.
- Calculate the density by dividing total F-actin labeled puncta (N) by the length (L) of the MAP2 labeled dendrites. Express data as number of F-actin puncta per 10 µm of dendrite
Note: Puncta (size ≤1.5 µm) of F-actin fluorescence with a peak intensity of at least 50% above the average intensity of staining in the dendritic shaft were included in each selected dendritic segment.
Results
Loading...
$$\rightleftharpoonup{xx}$$
$$\longleftharp{xx}$$,
$$\longrightharp{xx}$$,
In the present methods, we first culture rat cortical neurons at low density in 35 mm glass-bottom dishes, which allows us to identify the dendrites of individual neurons. In Figure 1, the differential interference contrast (DIC) images show the morphological changes in developing fetal rat cortical neurons at days 4, 6, 10, 14, 21 and 27 in vitro. Note that the length and number of dendrites increase with maturation of cultured rat primary neurons. Neurons are used in experiments only after 14 days maturation.
To detect dendritic and synaptic changes, we combine the Phalloidin F-actin labeling with MAP2 antibody detection of dendrites. Since Phalloidin labeling of F-actin is very rapid (20-30 min), it is possible to visually estimate the integrity of synaptodendritic network before proceeding with ICC antibody labeling (Figure 2). MAP2 indicates the intact dendrites and overlies the Phalloidin staining. This allows confirmation that the F-actin puncta are located on neuronal dendrites and not localized to other cells, such as astrocytes.
Next, we acquire high resolution images of co-labeled Phalloidin (F-actin)/MAP2 neurons and analyzed randomly selected neurons. Fine filopodia, spine protrusions, and F-actin patches were considered F-actin rich structures and were included in our studies (Figure 3). Segments of the second order dendrites (MAP2 positive) were selected for the analysis of F-actin puncta densities. MAP2 positive staining is used to confirm the neuronal localization of the F-actin puncta. Computer-assisted detection and counting of Phalloidin (F-actin) labeled (green fluorescence channel) synaptic puncta was performed via use of specialized software. There is a step by step detailed protocol in Figure 4 describing the use of the software package. We have reported that computer-assisted F-actin counting correlates very well with manual counting of F-actin and that the inter-observer correlation in F-actin puncta counts between two trained observers is very high (r2=0.97).
Previously, we used quantification of F-actin puncta to assess synaptodendritic injury induced by HIV-1 Tat9 and recovery from HIV-1 Tat-induced synaptopathy10. In Figure 5, rat cortical neurons were co-labeled with Phalloidin and MAP2 antibody after 50 nM of HIV-1 Tat treatment. MAP2 staining revealed fewer dendritic branches and diminished F-actin following HIV-1 Tat-treatment.
We found that F-actin puncta may either increase or decrease in response to experimental treatments. In Figure 6, cultured neurons were treated with the uncompetitive NMDA receptor antagonist memantine, significantly increasing F-actin positive puncta. In contrast, treatment with a combination of Methamphetamine+HIV-1 Tat resulted in significant loss of F-actin puncta.
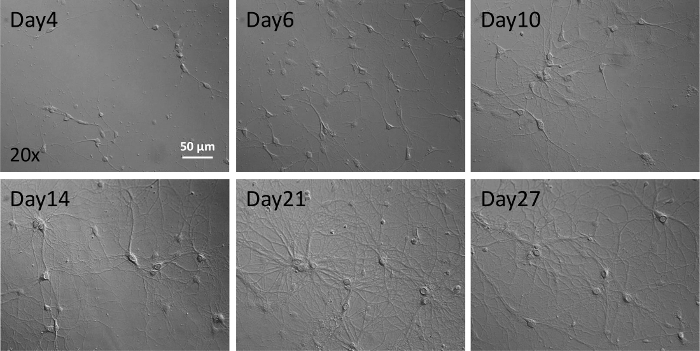
Figure 1. Fetal rat cortical neurons in cell culture. Differential interference contrast (DIC) images of fetal rat cortical neurons between 4 - 27 days in vitro (20X). Neurons appear mature at 14 days in vitro. Please click here to view a larger version of this figure.
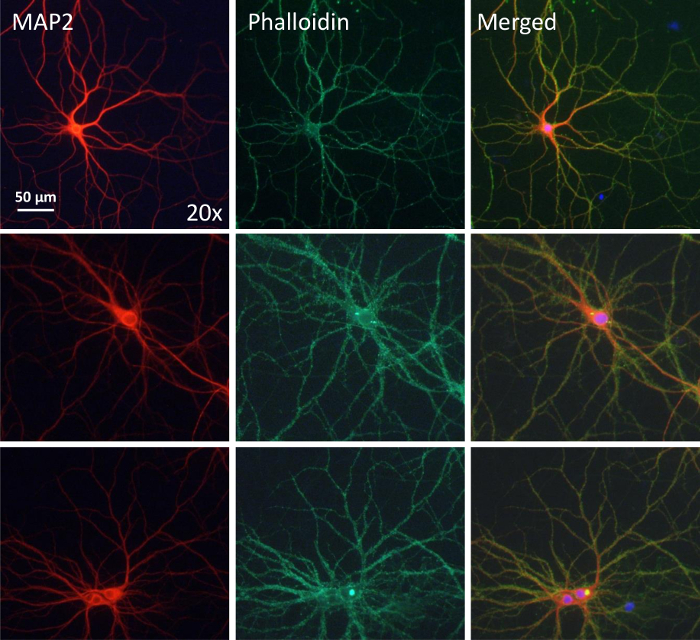
Figure 2. Phalloidin/MAP2 co-labeling in rat cortical neurons. Cultured neurons labeled with MAP2 antibody (red) and Phalloidin (green). Merged images allow determination that the Phalloidin staining is localized to neuronal dendrites (20X). Please click here to view a larger version of this figure.
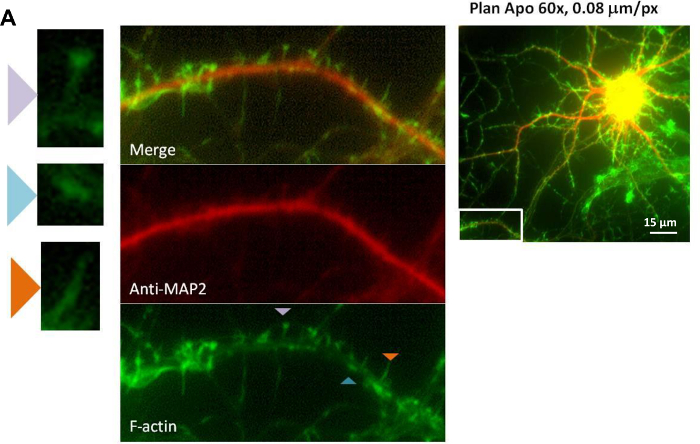
Figure 3. F-actin synaptic structures of rat cortical neurons. (A) Left - F-actin positive structures labeled with Phalloidin (60X). The arrowheads indicate F-actin labeled structures include mushroom spines (purple), patch-like morphology (blue) and long filopodia (orange). Middle - Merged image demonstrating these F-actin structures are localized to dendrites (20X). Right - Box in the lower right indicates the second order dendritic branch selected for analysis (20X). (B) Dendritic segments of Phalloidin (F-actin) (Green)/MAP2(Red) co-labeled cortical neurons (20X) are used to verify neuronal origin of F-actin puncta. The green only image (Phalloidin/F-actin) is further processed. (C) Phalloidin/F-actin (green) images of three dendritic segments selected for puncta counting. Densities are determined by dividing N/L. N=number of puncta, L=length of dendritic segment. Please click here to view a larger version of this figure.
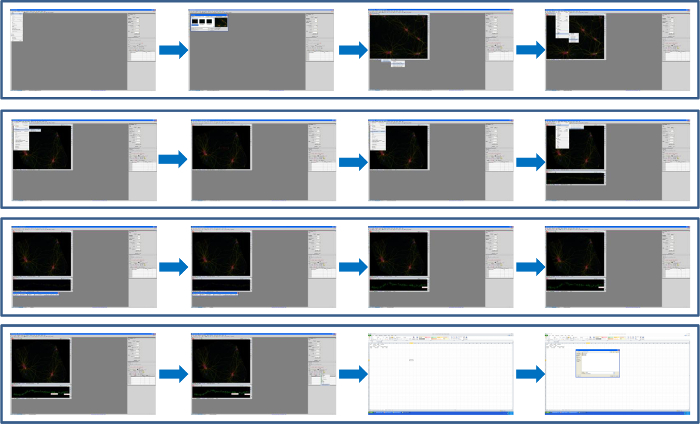
Figure 4. Demonstration of software package: step by step instructions. Please click here to view a larger version of this figure.
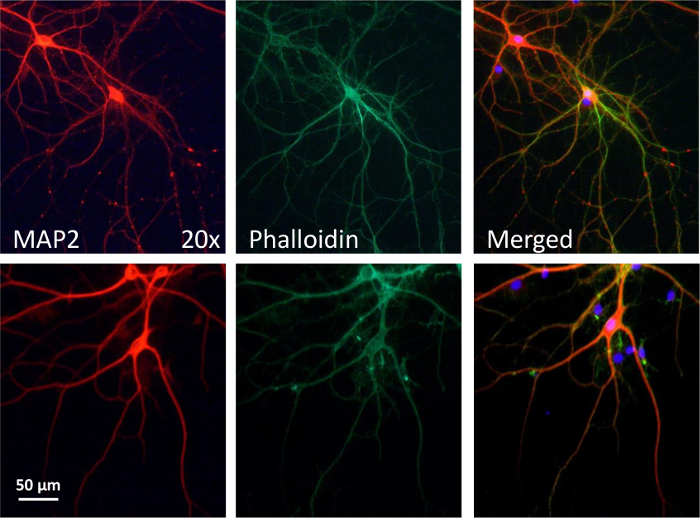
Figure 5. HIV-1 Tat mediated synaptodendritic injury in rat cortical neurons. Cell cultures were co-stained for F-actin and MAP2 after HIV-1 Tat protein treatment (50nM). Upper panels- untreated neurons showing robust F-actin, complex branching patterns, and extensive fine neuronal processes. Lower panels - HIV-1 Tat protein treated neurons with diminished F-actin and decreased dendritic branching. (20X) Please click here to view a larger version of this figure.
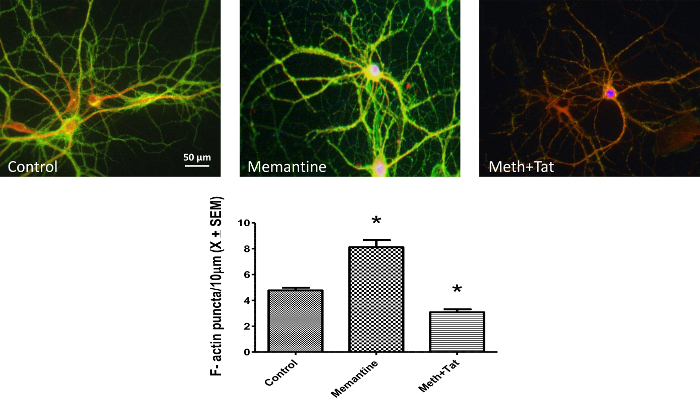
Figure 6. F-actin puncta in rat cortical neurons: different effects produced by Memantine vs. Methamphetamine+Tat treatment. Images (20X) of untreated cultured neurons, neurons treated with Memantine (10 µM), and neurons treated with Methamphetamine (20 µM) +10 nM of Tat (10nM). Memantine treatment increased the F-actin staining, whereas Methamphetamine+HIV-1 Tat treatment decreased F-actin staining and decreased dendritic branching. Memantine treatment significantly increased F-actin puncta density, relative to untreated control cultures. In contrast, Methamphetamine+HIV-1 Tat treatments significantly decreased F-actin puncta density, relative to untreated control cultures. Mean + SEM, * p<0.05. Please click here to view a larger version of this figure.
Discussion
Loading...
$$\rightleftharpoonup{xx}$$
$$\longleftharp{xx}$$,
$$\longrightharp{xx}$$,
In this protocol, we describe culturing rat cortical neurons at low density in 35 mm glass-bottom dishes which allows us to identify dendrites of individual neurons. Next, we use Phalloidin and MAP2 staining to detect dendritic changes. Then, we used specialized software to quantify changes in F-actin puncta.
To determine changes in F-actin puncta the entire neuronal network of an individual neuron must be clearly visible, this allows selection of appropriate second order dendritic segments from a single neuron. Low-density plating is critical in order to both visualize individual neurons as well as to minimize the presence of glial cells. Astrocytes also contain F-actin and without a neuronal marker, could confound the analysis of F-actin positive puncta. Low-density cultures and the use of Neurobasal medium are helpful in decreasing astrocytic proliferation in the cell cultures. However, given the caveat that the F-actin protein is not specific to neurons, specific neuronal protein markers, such as MAP2, should be used together with Phalloidin. Other protein antibodies may also be used in conjunction with Phalloidin, such as TH (tyrosine hydroxylase) for identification of specific neuronal populations in culture.
One general technique for studying synapses and synaptic morphology is immunocytochemistry (ICC). ICC is popular since many antibodies for synaptic proteins are readily available including PSD 95, NMDAR (post-synaptic) as well as synaptophysin, bassoon and synapsin I (pre-synaptic)11. However, some structures cannot be detected by ICC (such as thin filopodia), but a combination of F-actin Phalloidin labeling with antibody detection (or double labeling with two different antibodies) may allow for specific and complex investigation of synaptic subpopulations and differential responses to experimental treatments.
F-actin puncta may be particularly sensitive to experimental treatments. We recently reported that treatment with HIV-1 Tat protein produced a decrease in F-actin puncta (24 hr) prior to any evidence for overt neuronal death (48 hr)10. It is of note that experimental treatments may either increase (memantine) or decrease (methamphetamine+HIV-1 Tat) F-actin puncta. We also found that F-actin puncta loss is a reversible response following specific experimental treatments10. As such, F-actin puncta quantification is a valuable tool to monitor not only acute synaptopathy, but also for studying synaptic recovery and experimental neurorestoration processes.
Disclosures
Loading...
$$\rightleftharpoonup{xx}$$
$$\longleftharp{xx}$$,
$$\longrightharp{xx}$$,
None of the authors have conflicts of interest to declare.
Acknowledgements
Loading...
$$\rightleftharpoonup{xx}$$
$$\longleftharp{xx}$$,
$$\longrightharp{xx}$$,
This work was funded by NIH grants DA013137, DA031604, and HD043680. Partial support was provided by a NIH T32 training grant in Biomedical-Behavioral science.
Materials
| Name | Company | Catalog Number | Comments |
|---|---|---|---|
| 35 mm Glass Bottom Dishes No. 1.5 coverglass | MatTek Corporation | P35G-1.5-20-C | |
| DMEM/F12 medium | Life Technologies | 10565-018 | |
| Trypsin-EDTA | Life Technologies | 15400-054 | |
| Poly-L-Lysine | Sigma | P9155 | |
| Boric acid | Sigma | B0252 | |
| Borax | Sigma | B9876 | |
| GlutaMax | Life Technologies | 35050-061 | 100X |
| Glucose | VWR | 101174Y | |
| HBSS | Sigma | H4641 | 10X |
| Neurobasal medium | Life Technologies | 21103-049 | |
| B-27 supplement | Life Technologies | 17504-044 | 50X |
| Antibiotic-Antimycotic solution | Cellgro | 30004CI | 100X |
| Sodium Bicarbonate | Life Technologies | 25080 | |
| Vannas Scissors | World Precision Instruments | 500086 | |
| Iris Scissors | World Precision Instruments | 500216 | |
| Iris Forceps | World Precision Instruments | 15914 | |
| Dumont #7 Forceps | World Precision Instruments | 14097 | |
| Dumont #5 Forceps | World Precision Instruments | 14095 | |
| ProLong Gold | Life Technologies | P36930 | |
| Paraformaldehyde | Sigma | P6148 | |
| Cover glass | VWR | 631-0137 | |
| AlexaFluor 488 Phalloidin | Life Technologies | A12379 | |
| Normal horse serum | Life Technologies | 26050-070 | |
| Chicken polyclonal anti-MAP2 | abcam | Ab92434 | |
| Alexa Red 594-conjugated goat anti-chicken IgG | Life Technologies | A11042 | |
| NucBlue Live cell stain ReadyProbes Reagent Hoescht 33342 | Life Technologies | R37605 | |
| NIS-Elements software package | Nikon Instruments | ||
| Nikon Eclipse TE2000-E inverted fluorescent computer-controlled microscope | Nikon Instruments | ||
| 0.2 μm Nalgene nylon membrane filter | Fishersci | 151-4020 |
References
Loading...
$$\rightleftharpoonup{xx}$$
$$\longleftharp{xx}$$,
$$\longrightharp{xx}$$,
- The biochemical anatomy of cortical inhibitory synapses. PLoS One. 7, e39572(2012).">Heller, E. A., et al. The biochemical anatomy of cortical inhibitory synapses. PLoS One. 7, e39572(2012).
- Selective clustering of glutamate and gamma-aminobutyric acid receptors opposite terminals releasing the corresponding neurotransmitters. Proc Natl Acad Sci USA. 91, 12373-12377 (1994).">Craig, A. M., Blackstone, C. D., Huganir, R. L., Banker, G. Selective clustering of glutamate and gamma-aminobutyric acid receptors opposite terminals releasing the corresponding neurotransmitters. Proc Natl Acad Sci USA. 91, 12373-12377 (1994).
- A regulatory role for actin in dendritic spine proliferation. Brain Res. 1113, 1-9 (2006).">Johnson, O. L., Ouimet, C. C. A regulatory role for actin in dendritic spine proliferation. Brain Res. 1113, 1-9 (2006).
- Signaling between the actin cytoskeleton and the postsynaptic density of dendritic spines. Hippocampus. 10 (5), 527-541 (2000).">Rao, A., Craig, A. M. Signaling between the actin cytoskeleton and the postsynaptic density of dendritic spines. Hippocampus. 10 (5), 527-541 (2000).
- High actin concentrations in brain dendritic spines and postsynaptic densities. Proc Natl Acad Sci USA. 79, 7590-7594 (1982).">Matus, A., Ackermann, M., Pehling, G., Byers, H. R., Fujiwara, K. High actin concentrations in brain dendritic spines and postsynaptic densities. Proc Natl Acad Sci USA. 79, 7590-7594 (1982).
- Role of actin in anchoring postsynaptic receptors in cultured hippocampal neurons: differential attachment of NMDA versus AMPA receptors. J Neurosci. 18, 2423-2436 (1998).">Allison, D. W., Gelfand, V. I., Spector, I., Craig, A. M. Role of actin in anchoring postsynaptic receptors in cultured hippocampal neurons: differential attachment of NMDA versus AMPA receptors. J Neurosci. 18, 2423-2436 (1998).
- Role of actin cytoskeleton in dendritic spine morphogenesis. Neurochem Int. 51, 92-104 (2007).">Sekino, Y., Kojima, N., Shirao, T. Role of actin cytoskeleton in dendritic spine morphogenesis. Neurochem Int. 51, 92-104 (2007).
- Stages of synapse development defined by dependence on F-actin. J Neurosci. 21 (14), 5169-5181 (2001).">Zhang, W., Benson, D. L. Stages of synapse development defined by dependence on F-actin. J Neurosci. 21 (14), 5169-5181 (2001).
- HIV-1 Tat protein variants: Critical role for the cysteine region in synaptodendritic injury. Exp Neurol. 248, 228-235 (2013).">Bertrand, S. J., Aksenova, M. V., Mactutus, C. F., Booze, R. M. HIV-1 Tat protein variants: Critical role for the cysteine region in synaptodendritic injury. Exp Neurol. 248, 228-235 (2013).
- Synaptodendritic recovery following HIV Tat exposure: neurorestoration by phytoestrogens. J Neurochem. 128 (1), 140-151 (2014).">Bertrand, S. J., Mactutus, C. F., Aksenova, M. V., Espensen-Sturges, T. D., Booze, R. M. Synaptodendritic recovery following HIV Tat exposure: neurorestoration by phytoestrogens. J Neurochem. 128 (1), 140-151 (2014).
- Induction of filopodia by direct local elevation of intracellular calcium ion concentration. J Cell Biol. 145, 1265-1275 (1999).">Lau, P. M., Zucker, R. S., Bentley, D. Induction of filopodia by direct local elevation of intracellular calcium ion concentration. J Cell Biol. 145, 1265-1275 (1999).
Reprints and Permissions
Request permission to reuse the text or figures of this JoVE article
Request Permission