Here, we present a protocol to induce ocular hypertension in the murine eye that results in the loss of retinal ganglion cells as observed in glaucoma. Magnetic microbeads are injected into the anterior chamber and attracted to the iridocorneal angle using a magnet to block the outflow of aqueous humour.
Method Article
A Magnetic Microbead Occlusion Model to Induce Ocular Hypertension-Dependent Glaucoma in Mice
* These authors contributed equally
In This Article
Summary
Abstract
The use of rodent models of glaucoma has been essential to understand the molecular mechanisms that underlie the pathophysiology of this multifactorial neurodegenerative disease. With the advent of numerous transgenic mouse lines, there is increasing interest in inducible murine models of ocular hypertension. Here, we present an occlusion model of glaucoma based on the injection of magnetic microbeads into the anterior chamber of the eye using a modified microneedle with a facetted bevel. The magnetic microbeads are attracted to the iridocorneal angle using a handheld magnet to block the drainage of aqueous humour from the anterior chamber. This disruption in aqueous dynamics results in a steady elevation of intraocular pressure, which subsequently leads to the loss of retinal ganglion cells, as observed in human glaucoma patients. The microbead occlusion model presented in this manuscript is simple compared to other inducible models of glaucoma and also highly effective and reproducible. Importantly, the modifications presented here minimize common issues that often arise in occlusion models. First, the use of a bevelled glass microneedle prevents backflow of microbeads and ensures that minimal damage occurs to the cornea during the injection, thus reducing injury-related effects. Second, the use of magnetic microbeads ensures the ability to attract most beads to the iridocorneal angle, effectively reducing the number of beads floating in the anterior chamber avoiding contact with other structures (e.g., iris, lens). Lastly, the use of a handheld magnet allows flexibility when handling the small mouse eye to efficiently direct the magnetic microbeads and ensure that there is little reflux of the microbeads from the eye when the microneedle is withdrawn. In summary, the microbead occlusion mouse model presented here is a powerful investigative tool to study neurodegenerative changes that occur during the onset and progression of glaucoma.
Introduction
Glaucoma is a progressive and irreversible blinding condition that will affect an estimated 80 million people worldwide by 20201. In glaucoma patients, vision loss is caused by the selective death of retinal ganglion cells (RGCs), the output neurons that transmit visual information from the retina to the brain. Glaucoma is an age-related neurodegenerative disease with many risk factors of which the most common is elevated intraocular pressure (IOP). Indeed, IOP is the only modifiable risk factor in glaucoma and current treatments focus solely on managing eye pressure. However, multiple genetic, cellular, and environmental factors affect the onset and progression of this disease. Therefore, understanding the various mechanisms that ultimately contribute to neuronal death is essential to develop effective treatments for glaucoma.
Animal models of glaucoma are essential to study disease pathophysiology and to identify and test promising therapeutics. The increasing availability of transgenic mouse lines including conditional knockout strains and mice carrying genetically-encoded fluorescent tracers has propelled the need for inducible murine glaucoma models. Several rodent models of glaucoma have been developed over the years (reviewed in2,3). In many of these models, glaucoma is induced by disrupting aqueous humour dynamics, resulting in the elevation of IOP. Occlusion models, in which microbeads or other substances are injected into the anterior chamber of the eye to block aqueous drainage, have gained popularity in recent years partly due to their relative ease to increase IOP4-14.
The microbead occlusion model of glaucoma, first carried out in primates 12, rabbits 8, and rats 4,9,11, was recently adapted for use in mice 5,6,10. In these studies, the intracameral injection of polystyrene microbeads, alone or in combination with a viscoelastic material, resulted in IOP elevation leading to subsequent RGC death 6,10. However, reflux when the needle is withdrawn from the eye and dislodging of microbeads from the iridocorneal angle are common problems that arise during the procedure. To minimize these drawbacks, magnets have been used to attract the magnetic microbeads to the iridocorneal angle of the eye 4,9.
The protocol described here is a modified procedure based on previous studies 9,10 that uses magnetic microbeads and a handheld magnet adapted to the mouse eye (Figure 1). Several important modifications have been introduced in our protocol to ensure effective and reproducible IOP increase in mice. First, the injection of microbeads is done using a carefully prepared glass microneedle with a facetted bevel. The resulting smooth surfaces of the microneedle as well as its sharpened tip ensures that minimal damage is inflicted as it punctures the cornea. The use of this glass microneedle also results in increased control when the microneedle tip enters the anterior chamber, thereby reducing the risk of damaging nearby structures such as the iris and the lens. In addition, the tiny injection lesion facilitates corneal self-repair and reduces unwanted injury-related effects.
Second, the injection of magnetic microbeads and the use of a handheld magnet allow precise control to attract the beads to the iridocorneal angle in the small mouse eye. Magnetic microbeads that are 4.5 µm in diameter were used because this microbead size did not clog the prepared microneedle opening and importantly, once injected, these microbeads effectively blocked the drainage of aqueous humor. This approach not only reduces reflux of the injected microbeads, but also ensures that a maximum number of microbeads accumulates in the target area to effectively block aqueous humour drainage. Furthermore, this strategy also reduces the number of beads floating in the anterior chamber avoiding contact with other structures, such as the iris and the lens, and preventing passage to the posterior chamber. Collectively, these modifications ensure that the microbead injection surgery is performed with relative ease and in a timely manner resulting in a highly reproducible, effective, and sustained induction of ocular hypertension in mice.
Protocol
The following procedure was performed in compliance with the guidelines of the Canadian Council on Animal Care for the Use of Experimental Animals and the Statement for the Use of Animals in Ophthalmic and Visual Research from the Association for Research in Vision and Ophthalmology (ARVO).
1. Preparation of the Microneedle for Anterior Intracameral Injection
- With a puller, generate a microneedle from a borosilicate glass capillary
- Under a microscope, use a sharp blade to carefully create an opening at the tip of the microneedle. The resulting opening should have an elliptical shape with a major and minor axis diameter of approximately 190 µm and 70 µm, respectively. Measure the area of the prepared microneedle opening by first acquiring images with a ruler placed under the microscope followed by quantification using image analysis software.
- In the micropipette bevelling system, place the microneedle at a 20 degree angle relative to the bevelling plate so that the microneedle opening is touching the plate. Bevel for approximately 10 min until the edges are flat and smooth. Add a few drops of distilled water to aid in the process.
- Rotate the microneedle to bevel the two edges surrounding the opening until the tip is sharp.
- Clean all debris and water from the microneedle tip opening using an aerosol duster.
- Carefully examine the finished microneedle under a microscope. Discard microneedles with fractures to minimize the risk of the microneedle breaking during surgery.
- Sterilize the microneedle by rinsing first with ethanol, then with sterile balanced salt solution (BSS).
2. Preparation of the Magnetic Microbead Solution
Note: The magnetic microbeads used in this study are coated with epoxy groups. To prevent any adverse effects, such as clumping of the beads and unwanted molecular interactions, these epoxy groups must first be removed from the microbeads before proceeding with the injection surgery.
- Removal of Epoxy Groups from Magnetic Beads
- Prepare a solution of 0.02 M sodium hydroxide (NaOH, MW 39.997 g/mol) in 10x Tris buffer (MW 121.14 g/mol).
- Gently vortex the stock of magnetic microbead solution (4.5 µm diameter, 4 x 10⁸ beads/ml) until the beads are evenly suspended in solution.
- Quickly pipet 1 ml of magnetic bead solution into 50 ml of 0.02 M NaOH in 10x Tris buffer.
- Rotate for 24 hr at RT to remove the epoxy groups from the beads.
- Collect the beads by securing a magnet to the bottom of the tube. Orient the tube horizontally to ensure that all the beads are attracted to the magnet. Rotate for an additional 4 hr at RT.
- With a micropipette, carefully remove the supernatant without disturbing the pellet of beads.
- Gently vortex the pellet in 50 ml of 10x Tris buffer until the beads are well suspended.
- Repeat steps 2.1.4 to 2.1.6.
- Concentration and Resuspension of Magnetic Microbeads in Sterile Balanced Salt Solution
Note: It is necessary to concentrate the stock of magnetic bead solution in sterile balanced salt solution (BSS) to reach a final concentration of 1.6 x 10⁶ beads/µl so that 2.4 x 10⁶ beads can be injected into the anterior chamber in a final volume of 1.5 µl, which is appropriate for the small mouse eye.
- Wash the beads in 5 ml of ultra-pure laboratory grade water by gently vortexing for 2 min.
- Collect the beads by attracting them to the bottom of the tube with a magnet.
- With a micropipette, carefully remove the water without disturbing the pellet of beads.
- Repeat steps 2.2.1 to 2.2.3 three more times.
- In a laminar flow hood, wash the beads with 500 µl of BSS by pipetting up and down. Perform the remaining steps in this section under sterile conditions in a laminar flow hood.
- Collect the beads by attracting them to the bottom of the tube with a magnet.
- With a micropipette, carefully remove the BSS without disturbing the pellet of beads.
- Repeat steps 2.2.5 to 2.2.7 three more times.
- Resuspend by pipetting the beads up and down in 250 µl of BSS.
- Ensure that the bead solution is well homogenized. Then, quickly aliquot 25 µl of the suspension into sterile 0.5 ml tubes. The final concentration of the stock bead solution is 1.6 x 10⁶ beads/µl.
- Store at 4 °C.
3. Induction of Ocular Hypertension
Note: Section 3 is a two-person operation. In the event that a particular action is to be performed by a specific person, the appropriate person is identified. In general, Person 1 handles the mouse under the microscope while Person 2 is responsible for manipulating the microsyringe pump. The total duration of the surgical procedure should be less than 10 min (steps 3.9 to 3.17).
- Perform procedures in adult C57BL/6 mice. House mice in a standard environment with access to food and water ad libitum. In this paper, use female C57BL/6 mice between 3 and 4.5 months of age. However, this protocol can be adapted to males and mice of different ages, as well as other mouse strains, including transgenic and knockout mice.
- Measure baseline IOP in awake mice prior to anaesthesia and microbead injection using a calibrated rebound tonometer. Apply one drop of proparacaine hydrochloride on the cornea.
- Gently restrain the mouse by holding the skin between the ears. Place the mouse on the benchtop so that the animal is comfortable and the eyes are accessible. Hold the tonometer perpendicular to the corneal surface and take at least three sets of ten consecutive readings per eye to obtain an IOP average. The measuring of IOP in awake mice is preferred to bypass anaesthesia-related effects on IOP. Alternatively, IOP can be measured in anesthetised mice after step 3.4.
- Prepare a stock mouse cocktail anaesthesia mixture composed of 20 mg/ml ketamine, 2 mg/ml xylazine, and 0.4 mg/ml acepromazine.
- Induce anaesthesia in the mouse by intraperitoneal administration of the cocktail mixture (1 µl/g of body weight). The use of an injectable anaesthetic cocktail is preferred over gas anaesthetics (e.g., isoflurane) because it allows flexibility when handling the mouse head as the animal is not connected to an inhalation mask. In addition, the longer recovery period required with an injectable anaesthetic ensures that microbeads settle at the iridocorneal angle without dislodging back into the anterior chamber.
- Administer 0.05 mg per kg of body weight of buprenorphine subcutaneously.
- Treat the eye with a tropicamide eye drop to induce pupil dilation. Due to the small size of the murine anterior chamber, the pupil must be dilated to easily visualize the positioning and advancement of the microneedle during injection.
- Apply topical ointment on the contralateral eye (un-operated) to avoid drying of the cornea during the procedure.
- Attach a clean microneedle to the injection assembly of the microsyringe pump. Replace the microneedle after every operation to avoid cross-animal contamination.
- Person 1: Transfer the anesthetised mouse to the operating platform. Under the microscope, ensure that the pupil is fully dilated and that the ocular muscles are relaxed so that there is no eye movement. The absence of eye movements ensures stability during the injection. Gently wipe the tropicamide eye drop from the eye using absorbent swabs.
- Person 2: Mix the magnetic microbead solution by pipetting up and down.
- Using the microsyringe pump, immediately load the microneedle (prepared in section 1) with 1.5 µl of the homogenized magnetic microbead solution (2.4 x 10⁶ beads). Ensure that air bubbles are absent at the tip of the microneedle. After the microneedle is loaded, carry out steps 3.12 to 3.13 as quickly as possible so that the magnetic microbead solution remains in a homogeneous suspension.
- Position the loaded microneedle at a 45° angle, placed anteriorly relative to the limbus. Person 1: support the eye using plastic forceps. Ensure that the angle between the microneedle and the plastic forceps is approximately 90°.
- Person 2: With the loaded microneedle, gently puncture the cornea so that the tip of the microneedle enters the anterior chamber. Ensure that the loaded microneedle remains at a 45° angle relative to the limbus during the puncture. Avoid any contact with the lens or the iris. Ensure that the microneedle does not enter the posterior chamber. Person 1: continue to support the eye using plastic forceps.
- Person 1: Without moving the mouse head, place the magnet beside the eye, opposite to the microneedle tip, to attract the magnetic beads into the anterior chamber and minimize contact of the beads with the inner surface of the cornea. Person 2: Using the microsyringe pump, inject 1.5 µl of the magnetic bead solution into the anterior chamber. The microbead solution is injected over a period of 15 to 30 sec. Person 1: Continue to hold the magnet opposite to the microneedle tip during the entire duration of the injection.
- Person 2: Once the full volume of beads has been injected, slowly withdraw the microneedle from the eye. Person 1: To avoid reflux of the microbeads, continue to attract the magnetic beads towards the anterior chamber by holding the magnet next to the eye for an additional 30 to 60 sec.
- Person 1: Using the magnet, attract the beads to the iridocorneal angle. Ensure that the beads form an evenly distributed ring around the circumference of the anterior chamber. During this step, avoid attracting beads to the cornea as they have a tendency to stick to the inner surface of the cornea upon contact.
- Treat the operated eye with an antibiotic eye drop to minimize the risk of infection.
- Allow the mouse to recover on a heat pad until fully awake (~3 to 4 hr). Place the mouse so that the operated eye is facing upwards. This positioning will prevent accumulation of the injected beads to the inner surface of the cornea by gravitational pull. In addition, this position will decrease the potential for infection as the operated eye will not be in contact with any bedding and/or other materials that may be present in the cage. In the event that an animal displays any sign of distress, administer additional doses of buprenorphine as needed.
- Allow mice to recover from the procedure for at least 2 days before taking IOP measurements. Measure IOP as described in 3.2. Monitor IOP at least once a week or more frequently, as needed, and at the same time of the day to minimize circadian-related fluctuations.
- For IOP measurements, use the contralateral eye from the operated mouse as an internal control. Alternatively, use measurements from intact, non-operated or sham-operated mice as naïve controls.
4. Assessment of Retinal Ganglion Cell Soma and Axon Survival
- Perfuse mice subjected to ocular hypertension by intracardial injection of 0.1 M phosphate buffer solution (PBS) immediately followed by ice-cold 4% paraformaldehyde (PFA).
- Perfuse intact, non-operated mice as described in 4.1 and use them as uninjured controls. The use of contralateral eyes from operated mice is not recommended to assess RGC survival because changes in contralateral eyes following injury have been reported15,16 and can confound data interpretation. Alternatively, use sham-operated eyes injected with 1.5 µl of BSS as controls.
- Using microscissors, carefully cut the connective tissue around the eye to isolate it from the eye socket. Separate the optic nerve from the eye by cutting it at the level of the optic nerve head.
- Using a 30 G needle, make a hole in the cornea to allow penetration of the fixative solution into the eye. Place the eye in 4% PFA and incubate for 1 hr at 4 °C for additional fixation.
- Place the optic nerve in a solution containing 2% PFA and 2.5% glutaraldehyde in 0.1 M sodium cacodylate (MW: 214 g/mol) and incubate O/N at 4 °C for additional fixation.
5. Quantification of RGC Soma Density on Flat-mounted Retinas
Note: The following procedure is adapted from a protocol by Nadal-Nicolas et al. 17 and outlines the quantification of RGCs using an antibody against the brain-specific homeobox/POU domain protein 3A (Brn3a) on retinal flat-mounts. Alternative methods for labeling RGCs can also be used including immunohistochemistry with an antibody against RNA-binding protein with multiple splicing (RBPMS) or retrograde labelling with Fluorogold or DiI.
- Under a dissecting microscope, remove the anterior part of the eye by making an incision along the entire limbus until the cornea detaches easily. Remove the cornea and lens. Carefully detach the retina from the eye by making cuts along the ora serrata and optic nerve.
- Prepare a retinal flat-mount by making four small equidistant incisions from the periphery of the retina towards the optic nerve to clearly delineate the four retinal quadrants. Using a small brush, gently remove any remaining vitreous from the retina. The removal of as much vitreous humour as possible is crucial for obtaining a clean and strong immunohistochemical signal.
- Carefully transfer the retina to a 48-well flat bottom culture plate containing 0.5% Triton X-100 in PBS so that the retina is free-floating. Make sure the ganglion cell layer is facing upwards.
- Place the culture plate at -70 °C for 15 min. After thawing the retinas, further permeabilize by washing twice in fresh 2% Triton X-100 in PBS.
- Dilute the Brn3a antibody to 0.3 - 0.5 µg/ml with PBS containing 2% Triton X-100 and 2% normal donkey serum. Incubate the retina in the Brn3a primary antibody solution by gently shaking O/N at 4 °C. The retinas should be fully immersed in 150 to 200 µl of solution at all times.
- Dilute the donkey anti-goat IgG secondary antibody to 2 µg/ml with PBS containing 2% Triton X-100 and incubate the retina in this solution for 2 hr at RT with gentle shaking. The retina should be fully immersed in the antibody solution at all times. Cover the culture plate with aluminum foil for the remaining steps to prevent photobleaching.
- Using a brush, carefully transfer the retina to a slide so that the tissue lies as flat as possible. Air dry for 10 min. Mount using anti-fade mounting medium.
- Examine the retinal flat-mounts under a fluorescent microscope. Quantify the number of Brn3a positive RGCs in three non-overlapping areas per retinal quadrant as described.18
6. Quantification of RGC Axons on Optic Nerve Cross Sections
- Collect the optic nerve from step 4.5 and incubate in 2% osmium tetroxide (OsO4, MW 254.23 g/mol) for 2 hr.
Caution: Due to its high toxicity, osmium tetroxide should be handled in a fume hood with appropriate laboratory attire. - Dehydrate the optic nerve by immersing it in increasing concentrations of ethanol (50%, 70%, 90%, 95%, and 100%) for 15 min each.
- Prepare the epoxy resin using the following recipe: 15.72 ml Embed-812, 6.45 ml dodecenyl succinic anhydride, 7.83 ml nadic methyl anhydride, 0.45 ml DMP-30.
- Sequentially incubate the optic nerve in solutions composed of the following ratios of epoxy resin to propylene oxide (MW 58.08 g/mol): 0:1, 1:1, 0.75:0.25, and 1:0. The optic nerve is incubated in each solution at RT for an O/N period.
- Incubate optic nerves embedded in 100% epoxy resin (last step from 6.4) at 60 °C for an additional 48 hr.
- Generate semi-thin optic nerve cross sections (0.75 µm) using a microtome.
- Stain optic nerve cross sections with 1% toluidine blue.
- Quantify the RGC axons in five non-overlapping areas of each optic nerve section as described 19.
Results
The injection of magnetic microbeads into the anterior chamber of adult mice described in this protocol resulted in a robust and reproducible elevation of IOP. One week after the procedure, IOP increased from 10 ± 0.6 mm Hg (mean ± S.E.M.), the average baseline IOP in contralateral eyes, to 19 ± 0.5 mm Hg in hypertensive eyes (Student's t-test; ***p <0.001, n = 12, Table 1, Figure 2). IOP stabilized thereafter and remained elevated at an average of 20 mm Hg for at least 6 weeks, the longest time-point examined in this study. The average peak IOP in microbead-injected eyes at 2, 3, and 6 weeks after surgery was 25 mm Hg. The vast majority of treated mice developed sustained high IOP, therefore this protocol does not require a second injection of microbeads.
To assess the time-course of RGC loss in this model, RGC soma were first quantified by immunostaining with Brn3a, a RGC-specific marker 17. The number of Brn3a-positive cells was quantified on flat-mounted retinas at 1, 2, 3 and 6 weeks after induction of ocular hypertension. Although a significant IOP elevation was detected as early as 1 week after microbead injection, no significant loss of RGC soma was observed within the first 2 weeks of the procedure (Figure 3). Substantial RGC death (22%), however, was evident at 3 weeks (2,430 ± 67 RGCs/mm2, mean ± S.E.M., n = 12) and 6 weeks (2,350 ± 74 RGCs/mm2, n = 10) post-induction of ocular hypertension, compared to intact control eyes from un-operated mice (3,141 ± 49 RGCs/mm2, n = 23) (ANOVA, p <0.001).
Dysfunction and degeneration of RGC axons is a cardinal feature of glaucoma. Therefore, axonal loss was examined at 3 and 6 weeks after microbead injection by quantification of RGC axons in optic nerve cross-sections stained with toluidine blue (Figure 4). A substantial loss of RGC axons (25%) was observed at 3 weeks (28,401 ± 702 axons/nerve, mean ± S.E.M., n = 5) and 6 weeks (29,426 ± 948 axons/ nerve, n = 6) after injection of microbeads compared to intact optic nerves from un-operated eyes (39,467 ± 137 axons/nerve, n = 4) (ANOVA, p <0.001). Collectively, these data demonstrate that injection of magnetic microbeads into the mouse anterior chamber leads to reproducible and sustained IOP elevation that results in RGC soma and axon degeneration.
| Time after OHT surgery | N | Mean IOP (mmHg) ± S.E.M | Peak IOP (mmHg) | ||||
| Contralateral | Glaucoma | Difference | Contralateral | Glaucoma | |||
| 1 week | 12 | 10 ± 0.4 | 19 ± 0.5 | 9 ± 0.6 | 12 ± 0.4 | 22 ± 0.6 | |
| 2 weeks | 13 | 11 ± 0.5 | 20 ± 0.8 | 9 ± 0.5 | 12 ± 0.9 | 25 ± 0.7 | |
| 3 weeks | 10 | 11 ± 0.8 | 20 ± 0.7 | 10 ± 0.9 | 13 ± 0.2 | 25 ± 0.9 | |
| 6 weeks | 12 | 12 ± 0.5 | 20 ± 0.6 | 9 ± 0.7 | 13 ± 0.5 | 24 ± 0.6 | |
Table 1. Elevation of Intraocular Pressure in the Murine Magnetic Microbead Occlusion Model. In awake female C57 BL/6 mice, IOP was measured using a calibrated rebound tonometer. Operated eyes displayed an increase in IOP detected at one week post-surgery that remained elevated for at least six weeks after the procedure.
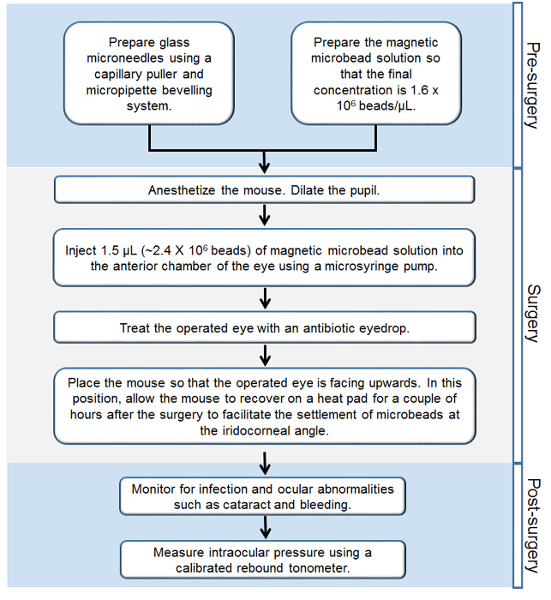
Figure 1. Workflow of the Steps Involved in the Murine Magnetic Microbead Occlusion Model of Glaucoma. Step-by-step outline of all the procedures performed before, during, and after the surgery. Please click here to view a larger version of this figure.

Figure 2. Increase in Intraocular Pressure in the Murine Magnetic Microbead Occlusion Model. In awake female C57 BL/6 mice, IOP was measured using a calibrated rebound tonometer. The IOPs of microbead-injected eyes were significantly elevated at one week post-surgery (ANOVA, p <0.001). The IOPs remained significantly elevated relative to the contralateral eye of injected mice for at least 6 weeks (ANOVA, p <0.001). (Intact: n = 12; 1 week: n = 12, 2 weeks: n = 13, 3 weeks: n = 10, 6 weeks: n = 12). Please click here to view a larger version of this figure.
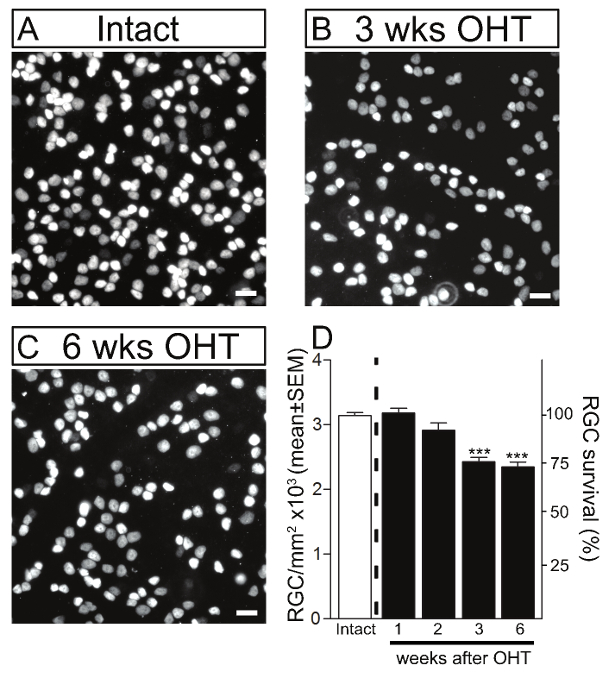
Figure 3. Retinal Ganglion Cell Death in the Murine Magnetic Microbead Occlusion Model. RGCs were visualized by immunostaining of flat-mounted retinas using Brn3a in intact control retinas (A) and glaucomatous retinas at 3 and 6 weeks after microbead injection to induce ocular hypertension (OHT) (B, C). Scale bars: 20 µm. (D) Quantitative analysis confirmed that microbead injection resulted in significant RGC soma loss at 3 and 6 weeks after the procedure compared to control eyes. The density of RGC soma in intact, non-glaucomatous C57/BL6 mice is shown as reference (white bars, 100% survival). Values are expressed as the mean ± S.E.M. (Intact: n = 23; 1 week: n = 6, 2 weeks: n = 6, 3 weeks: n = 12, 6 weeks: n = 10, ANOVA, *** p <0.001). Please click here to view a larger version of this figure.

Figure 4. Axonal Degeneration in the Murine Magnetic Microbead Occlusion Model. RGC axons were visualized by staining of optic nerve cross-sections with toluidine blue in intact control (A) and glaucomatous retinas at 3 and 6 weeks after microbead injection to induce ocular hypertension (OHT) (B, C). Scale bars: 10 µm. (D) Quantitative analysis confirmed that microbead injection resulted in significant RGC axon loss at 3 and 6 weeks after the procedure compared to control eyes. The density of RGC axons in intact, non-glaucomatous C57/BL6 mice is shown as reference (white bars, 100% survival). Values are expressed as the mean ± S.E.M. (Intact: n = 4; 3 weeks: n = 5, 6 weeks: n = 6, ANOVA, *** p <0.001). Please click here to view a larger version of this figure.
Discussion
The video technique presented here provides detailed step-by-step instructions on how to perform intracameral injection of magnetic microbeads to effectively and reproducibly induce IOP elevation in mice. This procedure results in sustained IOP increase that does not require additional injections and promotes detectable RGC soma and axon loss within the first 3 weeks of ocular hypertension induction.Elevated IOP is a major risk factor for developing glaucoma in humans. Therefore, this is a valuable murine ocular hypertension-dependent glaucoma model that has potential for a wide range of applications.
A common drawback associated with the injection of microbeads into the anterior chamber relates to bead reflux through the injection site when the needle is withdrawn, which often results in only partial obstruction of aqueous outflow and increased variability. To address this issue, several important modifications were implemented. First, the careful preparation of a clean, sharp glass microneedle with a facetted bevel is essential for the successful injection of the microbeads. A properly prepared microneedle enables controlled and smooth penetration of the cornea with minimal application of pressure to the delicate ocular surface. The small corneal puncture prevents backflow of microbeads. In addition, the fine microneedle reduces the risk of damaging nearby structures such as the iris and the lens, which could result in non-disease related inflammation. Secondly, the application of a handheld magnet to strategic ocular areas during and after the injection is another critical aspect of this technique. During the injection, the magnet is used to draw the magnetic microbeads to the anterior chamber preventing reflux of the microbeads when the microneedle is withdrawn. After the injection, the magnet is then used to direct the microbeads to the iridocorneal angle to block aqueous humour outflow.
Another problem often encountered in microbead occlusion models is that repeated bead injections are often necessary to achieve sustained IOP elevation 10,11. This might be the result of microbeads dislodging from the iridocorneal angle with time. The combination of a handheld magnet, as described above, and the positioning of the mouse post-operatively greatly improves the outcome. The use of injectable anaesthetics, which allow flexibility to move the head during the procedure and require a longer post-operative recovery period, is favoured. Placement of the mouse with the operated eye facing upwards for a couple of hours after the surgery contributes to the settlement of microbeads at the iridocorneal angle and decreases the risk of dislodging back into the anterior chamber.
Ensuring that the number of injected beads is relatively consistent is another critical step to minimize inter-animal variations. Since the microbeads settle at the bottom of the tube, it is necessary to fully homogenize the microbead solution and withdraw the appropriate volume into the microneedle in a timely manner. Injection of fewer beads into the anterior chamber could result in incomplete blockage of the aqueous humour drainage structures, which is likely to result in poor or variable IOP elevation. Of note, although the ultimate purpose of the microbead injection is to elevate IOP, caution should be taken when IOP measurements from awake mice are higher than the peak values reported in this study (~25 mmHg). Extremely high IOPs increase the risk of ischemic damage and may also cause pain to the animal. The elevation of IOP should be considered as one of many factors to assess the success of the surgery. As such, the outcome of the procedure should be gauged based on several parameters including IOP elevation, RGC soma death, and axon loss.
Although the protocol described here results in most microbeads successfully settling at the angle, a potential limitation of this model is that those beads that remain floating in the anterior chamber might interfere with live retinal imaging through the cornea, as well as electrophysiological or behavioral assays which require effective passage of light. Another important aspect to consider when utilizing this microbead occlusion model is that the extent of IOP elevation and subsequent RGC degeneration varies with the age and genetic background of the operated mouse [4]. Therefore, the extent of IOP elevation and the timeline of RGC degeneration will need to be determined for each specific transgenic mouse line and/or age range.
A feature of this model is that elevated IOP results in the gradual loss of RGC death during the first three weeks after microbead injection, and significant RGC death is detected at 3 weeks after the procedure. Hence, this model enables the examination of early and/or subtle changes that occur in this disease, prior to overt RGC soma and axon loss. A significant increase in RGC death was not observed between 3 and 6 weeks after induction of ocular hypertension. In fact, RGC soma and axon loss remained stable at ~22 - 25% between 3 and 6 weeks in spite of successful and sustained IOP elevation at these time points. A longer duration of sustained IOP may be required for additional RGC loss to occur in C57BL/6 mice, which appear to be more resistant to RGC damage compared to other mouse strains.5 Additional modifications to the protocol presented here, including adjustment of bead size and additional injections, might be required to study RGC loss at later time points. Therefore, our protocol is ideal for studies focused on early pathophysiological changes that correlate with modest RGC neurodegeneration which are relevant to onset and early progression in human glaucoma.
Disclosures
The authors declare that they have no competing financial interests.
Acknowledgements
The authors wish to thank Drs. David Calkins (Vanderbilt University) and James Morgan (Cardiff University) for sharing their expertise and for helpful advice towards developing this procedure. This study was supported by grants from the Canadian Institutes of Health Research (A.D.P.). Y.A.I. and N.B. are the recipients of postdoctoral fellowships from the Fonds de recherche du Québec-Santé (FRQS). N.B. was awarded a H.H. Jasper scholarship from the Groupe de Recherche sur le Système Nerveux Central (GRSNC). A.D.P. is a Chercheur Boursier National FRQS.
Materials
| Name | Company | Catalog Number | Comments |
|---|---|---|---|
| Puller | Narishige | PC-10 | |
| Thin Wall Glass Capillaries | World Precision Instruments | TW150F-4 | Capillary has an outer diameter of 1.5 mm and inner diameter of 1.12 mm |
| Stereo Microscope | Zeiss | MZ9.5 | Zoom factor range of 2.5 to 6.0. Microscope used for needle-making and the micro-bead injection surgery. |
| Footswitch | Linemaster | T-91-SE | |
| Stainless Steel Blade | Feather | No. 11 | |
| Microelectrode Beveler | Science Products | BV-10 | |
| Aerosol Duster | Fisher | 23-022-523 | |
| Sodium Hydroxide | Fisher Scientific | BP359-500 | |
| Tris Base | Fisher Scientific | BP152-1 | |
| Vortex | Fisher Scientific | 12-812 | |
| Dynabeads M-450 Epoxy | Life Technologies | 14011 | Magnetic beads are 4.5 µm in diameter. Stock solution is at a concentration of 4 x 10⁸ beads/ml. Store at 4°C. |
| Mini-Tube Rotators | Fisher Scientific | 05-450-127 | |
| 3 Handheld Magnets | Geomag | 0.45 Tesla. Magnet used for microbead preparation and microbead injection surgery. | |
| 25 ml serological pipet | Costar | 4489 | |
| Pipet | Drummond | 4-000-101 | |
| Biological Containment Hood | Biostad | 377355 | |
| Balanced salt solution (BSS) | Alcon | 0065-0800-25 | |
| P1,000 Micropipet | Gilson | F123602 | |
| Microtube 1.5 ml | Sarstedt | 72.690 | |
| P200 Micropipet | Gilson | F123601 | |
| 0.2 ml PCR tube | Sarstedt | 72737.002 | |
| Ketamine | Controlled substance | ||
| Xylazine | Bayer Healthcare | ||
| Acepromazine | Vetoquinol | ||
| U-100 Insulin Syringe | Becton Dickinson and Company | 329461 | |
| Balance | Ohaus | CS 200 | |
| Buprenorphine | Controlled substance | ||
| Tropicamide ophthalmic solution | Alcon | 0998-0355-15 | 1% Mydriacyl |
| Manual Microsyringe Pump with Digital Display | World Precision Instruments | DMP | |
| Manual Micromanipulator | World Precision Instruments | M3301R | |
| Platform | Fisher Scientific | 14-673-52 | 8 x 8 inch |
| Absorbent swabs | Kettenbach | 30601 | |
| P20 Micropipet | Gilson | F123600 | |
| Plastic forcep | Euroband | 1001 | Ensure forcep is plastic and has a flat surface to avoid damaging the eye |
| Fluoroquinolone ophthalmic solution | Alcon | Vigamox | |
| Heating pad | Sunbeam | E12107-834 | |
| Tonometer | iCare | TV02 | TONOLAB rebound tonometer |
| Paraformaldehyde, Para | Fisher Scientific | T353-500 | |
| Dissection tools | |||
| Small brush | |||
| Glutaraldehyde solution | Sigma-Aldrich | G7651 | |
| Sodium Cacodylate, tryhydrate | Canemco and Marivec | 124-65-2 | |
| Brn-3a antibody (C-20) | Santa Cruz Biotechnology | sc-31984 | |
| Tissue Culture Plate, 48 well | Falcon | 353078 | |
| Triton X-100 | Fisher Scientific | BP151-500 | |
| Donkey Serum | Sigma-Aldrich | D9663 | |
| Donkey anti-Goat IgG (H+L) Secondary Antibody, Alexa Fluor 594 conjugate | Life Technologies | A-11058 | |
| Aluminum foil | |||
| Microscope Slides | Fisher Scientific | 12-550-15 | |
| Slow fade Gold antifade reagent | Life Technologies | S36936 | |
| Cover Glass | Fisher Scientific | 12-548-5E | |
| Osmium tetroxide 2% aqueous solution | Electron Microscopy Sciences | 3294949 | |
| Embed-812 | Electron Microscopy Sciences | 14900 | |
| Dodecenyl succinic anhydride | Electron Microscopy Sciences | 13710 | |
| Nadic methyl anhydride | Electron Microscopy Sciences | 19000 | |
| DMP-30 | Electron Microscopy Sciences | 13600 | |
| Propylene oxide | Sigma-Aldrich | 110205-1L | |
| Embedding mold-Dykstra | Electron Microscopy Sciences | 70907 | |
| Porter-Blum ultra-microtome | Sorvall | MT-2 | |
| Toluidine blue O (Certified Biological Stain) | Fisher-Scientific | T161-25 |
References
- Quigley, H. A., Broman, A. T. The number of people with glaucoma worldwide in 2010 and 2020. Br J Ophthalmol. 90, 262-267 (2006).
- Bouhenni, R. A., Dunmire, J., Sewell, A., Edward, D. P. Animal models of glaucoma. J Biomed Biotechnol. 2012, 692609(2012).
- Morrison, J. C., Cepurna Ying Guo, W. O., Johnson, E. C. Pathophysiology of human glaucomatous optic nerve damage: insights from rodent models of glaucoma. Exp Eye Res. 93, 156-164 (2011).
- Bunker, S., et al. Experimental glaucoma induced by ocular injection of magnetic microspheres. J Vis Exp. , (2015).
- Cone, F. E., Gelman, S. E., Son, J. L., Pease, M. E., Quigley, H. A. Differential susceptibility to experimental glaucoma among 3 mouse strains using bead and viscoelastic injection. Exp Eye Res. 91, 415-424 (2010).
- Cone, F. E., et al. The effects of anesthesia, mouse strain and age on intraocular pressure and an improved murine model of experimental glaucoma. Exp Eye Res. 99, 27-35 (2012).
- El-Danaf, R. N., Huberman, A. D. Characteristic patterns of dendritic remodeling in early-stage glaucoma: evidence from genetically identified retinal ganglion cell types. Neuroscience. 35, 2329-2343 (2015).
- Ngumah, Q. C., Buchthal, S. D., Dacheux, R. F. Longitudinal non-invasive proton NMR spectroscopy measurement of vitreous lactate in a rabbit model of ocular hypertension. Exp Eye Res. 83, 390-400 (2006).
- Samsel, P. A., Kisiswa, L., Erichsen, J. T., Cross, S. D., Morgan, J. E. A novel method for the induction of experimental glaucoma using magnetic microspheres. Invest Ophthalmol Vis Sci. 52, 1671-1675 (2011).
- Sappington, R. M., Carlson, B. J., Crish, S. D., Calkins, D. J. The microbead occlusion model: a paradigm for induced ocular hypertension in rats and mice. Invest Ophthalmol Vis Sci. 51, 207-216 (2010).
- Urcola, J. H., Hernandez, M., Vecino, E. Three experimental glaucoma models in rats: comparison of the effects of intraocular pressure elevation on retinal ganglion cell size and death. Exp Eye Res. 83, 429-437 (2006).
- Weber, A. J., Zelenak, D. Experimental glaucoma in the primate induced by latex microspheres. J neuroscience meth. 111, 39-48 (2001).
- Ho, L. C., et al. In vivo assessment of aqueous humor dynamics upon chronic ocular hypertension and hypotensive drug treatment using gadolinium-enhanced MRI. Invest Ophthalmol Vis Sci. 55, 3747-3757 (2014).
- Yang, Q., et al. Microbead-induced ocular hypertensive mouse model for screening and testing of aqueous production suppressants for glaucoma. Invest Ophthalmol Vis Sci. 53, 3733-3741 (2012).
- Gallego, B. I., et al. IOP induces upregulation of GFAP and MHC-II and microglia reactivity in mice retina contralateral to experimental glaucoma. J neuroinflammation. 9, 92(2012).
- Rojas, B., et al. Microglia in mouse retina contralateral to experimental glaucoma exhibit multiple signs of activation in all retinal layers. J neuroinflammation. 11, 133(2014).
- Nadal-Nicolas, F. M., et al. Brn3a as a marker of retinal ganglion cells: qualitative and quantitative time course studies in naive and optic nerve-injured retinas. Invest Ophthalmol Vis Sci. 50, 3860-3868 (2009).
- Morquette, B., et al. REDD2-mediated inhibition of mTOR promotes dendrite retraction induced by axonal injury. Cell Death Differ. 22, 612-625 (2015).
- Almasieh, M., Zhou, Y., Kelly, M. E., Casanova, C., Di Polo, A. Structural and functional neuroprotection in glaucoma: role of galantamine-mediated activation of muscarinic acetylcholine receptors. Cell Death Dis. 1, 27(2010).
Reprints and Permissions
