Mice produce a complex multisyllabic repertoire of ultrasonic vocalizations (USVs). These USVs are widely used as readouts for neuropsychiatric disorders. This protocol describes some of the practices we learned and developed to consistently induce, collect, and analyze the acoustic features and syntax of mouse songs.
Method Article
Eliciting and Analyzing Male Mouse Ultrasonic Vocalization (USV) Songs
In This Article
Summary
Abstract
Mice produce ultrasonic vocalizations (USVs) in a variety of social contexts throughout development and adulthood. These USVs are used for mother-pup retrieval1, juvenile interactions2, opposite and same sex interactions3,4,5, and territorial interactions6. For decades, the USVs have been used by investigators as proxies to study neuropsychiatric and developmental or behavioral disorders7,8,9, and more recently to understand mechanisms and evolution of vocal communication among vertebrates10. Within the sexual interactions, adult male mice produce USV songs, which have some features similar to courtship songs of songbirds11. The use of such multisyllabic repertoires can increase potential flexibility and information they carry, as they can be varied in how elements are organized and recombined, namely syntax. In this protocol a reliable method to elicit USV songs from male mice in various social contexts, such as exposure to fresh female urine, anesthetized animals, and estrus females is described. This includes conditions to induce a large amount of syllables from the mice. We reduce recording of ambient noises with inexpensive sound chambers, and present a quantification method to automatically detect, classify and analyze the USVs. The latter includes evaluation of call-rate, vocal repertoire, acoustic parameters, and syntax. Various approaches and insight on using playbacks to study an animal's preference for specific song types are described. These methods were used to describe acoustic and syntax changes across different contexts in male mice, and song preferences in female mice.
Introduction
Relative to humans, mice produce both low and high frequency vocalizations, the later known as ultrasonic vocalizations (USVs) above our hearing range. The USVs are produced in a variety of contexts, including from mother-pup retrieval, juvenile interactions, to opposite or same sex adult interactions4,12. These USVs are composed of a diverse multisyllabic repertoire which can be categorized manually9 or automatically10,11. The role of these USVs in communication has been under increasing investigation in recent years. These include using the USVs as readouts of mouse models of neuropsychiatric, developmental or behavioral disorders7,8, and internal motivational/emotional states13. The USVs are thought to convey reliable information on the emitter's state that is useful for the receiver14,15.
In 2005, Holy and Guo 11, advanced the idea that adult male mice USVs were organized as a succession of multisyllabic call elements or syllables similar to songbirds. In many species, a multisyllabic repertoire allows the emitter to combine and order syllables in different ways to increase the potential information carried by the song. Variation in this syntax is believed to have an ethological relevance for sexual behavior and mate preferences16,17. Subsequent studies showed that male mice were able to change the relative composition of syllable types they produce before, during, and after the presence of a female5,18. That is, the adult male mice use their USVs for courtship behavior, either to attract or maintain close contact with a female, or to facilitate mating19,20,21. They are also emitted in male-male interactions, probably to convey social information during interactions4. To capture these changes in repertoires, scientists usually measure the spectral features (acoustic parameters, such as amplitude, frequencies, etc.), number of USVs syllables or calls, and latency to the first USV. However, few actually look at the sequence dynamics of these USVs in detail22. Recently our group developed a novel method to measure dynamic changes in the USV syllable sequences23. We showed that syllable order within a song about (namely syntax) is not random, that it changes depending on social context, and that the listening animals detect these changes as ethologically relevant.
We note that many investigators studying animal communication do not attach to the term 'syntax' the same exact meaning as syntax used in human speech. For animal communication studies, we simply mean an ordered, non-random, sequence of sounds with some rules. For humans, in addition, specific sequences are known to have specific meanings. We do not know if this is the case for mice.
In this paper and associated video, we aim to provide reliable protocols to record male mice's courtship USVs across various contexts, and perform playbacks. The use of three sequentially used software for: 1) automated recordings; 2) syllable detection and coding; and 3) in-depth analysis of the syllable features and syntax is demonstrated (Figure 1). This allows us to learn more about male mice USV structure and function. We believe that such methods ease data analyses and may open new horizons in characterizing normal and abnormal vocal communication in mouse models of communication and neuropsychiatric disorders, respectively.
Protocol
Ethics statement: All experimental protocols were approved by the Duke University Institutional Animal Care and Use Committee (IACUC) under the protocol #A095-14-04. Note: See Table 1 in "Materials and Equipment" section for details of software used.
1. Stimulating and Recording Mouse USVs
- Preparation of the males before the recording sessions
NOTE: The representative results were obtained using B6D2F1/J young adult male mice (7 - 8 weeks old). This protocol can be adapted for any strain.- Set the light cycle of the animal room on a 12-h light/dark cycle, unless otherwise required. Follow standard housing rules of 4 to 5 males per cage unless otherwise required or needed. Three days before recording, expose males individually to a sexually mature and receptive female (up to 3 males with one female per cage) of the same strain overnight.
- The next day remove the female from the male's cage and house the males without the females for at least two days before the first recording session to increase the social motivation to sing (based on our trial and error anecdotal analyses).
- Preparation of the recording boxes
- Use a beach cooler (internal dimensions are L 27 x W 23 x H 47 cm) to act as a sound attenuation box studio (Figure 2A). Drill a small hole on top of the box to let the microphone's wire run in.
NOTE: Recording the animals in a sound attenuated and visually isolated environment is preferable, in order to record dozens of mice at once without them hearing or seeing each other, prevent recording contaminating ambient room equipment noise and people in the room, and to obtain clean sound recordings of the mice (Figure 2B). We have not noted sound echos or distortions to the sound when comparing vocalizations of the same mouse inside versus outside of the sound attenuation chamber (Figure 2C); rather, there the sounds may be louder and have fewer harmonics inside the chamber. - Connect the microphone to the wire, the wire to the sound card, and the sound card to the computer to work with a sound recording software (e.g. Software A in Figure 1 and Table 1). An adequate sound recording software is necessary, such as software A that generates .wav sound files.
- Place an empty cage (58 x 33 x 40 cm) inside the soundproof box, and adjust the microphone's height so that the membrane of the microphone is 35 - 40 cm above the bottom of the cage, and that the microphone is centered above the cage (see Figure 2A).
- Use a beach cooler (internal dimensions are L 27 x W 23 x H 47 cm) to act as a sound attenuation box studio (Figure 2A). Drill a small hole on top of the box to let the microphone's wire run in.
- Configuration of recording software A (Table 1) for continuous recording
- Double click and open software A. Click and open the "configuration" menu and select the Device named, sampling rate (250,000 Hz), Format (16 bit).
- Select the key "Trigger" option and check "Toggle".
NOTE: This setting allows starting of the recording by pressing a key (F1, F2, etc.) while placing the stimulus in the mouse's cage. - Enter the mouse's ID under the "Name" parameter.
- Set the maximum file size to the desired minutes of recording (we usually set to 5 min).
NOTE: The longer the minutes the greater amount of computer storage memory needed. If continuous mode is not set, the software cuts off song bouts in the beginning or end of a sequence based on set parameters, and therefore one cannot reliably quantify sequences.
- Record USVs using the different stimuli. Note: Each stimulus can be used independently depending on the user's experimental needs.
- Gently lift the animal to be recorded by the tail, and place it in a cage without bedding (to prevent movement noise on the bedding) inside the soundproof box, and put the cage open-wired metal lid on top of it, with the lid facing up.
- Close the sound attenuated box and let the animal habituate to it for 15 min. Carry out the stimuli preparation (1.4) at this moment.
- Stimuli preparation
- Preparation of fresh urine (UR) samples as a stimulus
- Obtain urine samples at a maximum of 5 minutes before the recording session to ensure maximum effect in inducing song from the males. NOTE: Urine that has been sitting around longer, and especially for hours or overnight, is not as effective24,25, which we have empirically verified23.
- Pick a female or male (depending on the sex of the stimulus to be used) in one cage, grab the skin behind the neck and restrain the animal in one hand as for a drug injection procedure with the belly exposed.
- With a pair of tweezers, grab a cotton tip (3 - 4 mm long x 2 mm wide). Gently rub and push on the animal's bladder to extract one drop of fresh urine. Wipe the female's vagina or the male's penis to collect the entire drop on the cotton tip.
- Then, select another cage. And repeat the same procedure with another female or male but with the same cotton tip previously used.
NOTE: This procedure makes sure to mix the urine of at least two females or males from two independent cages on the same cotton tip to ensure against any estrus or other individual effects as it's known that estrus cycle could influence the singing behavior18,26. - Place the cotton tip to be used in a clean glass or plastic petri dish.
NOTE: Since the cotton tip with urine will need to be used within the next 5 min, there is no need to cover it to prevent evaporation.
- Preparation of the live female (FE) stimulus as a stimulus
- Select one or two new cages of sexually mature females. Identify females in the pro-estrus or estrus stage by visual inspection (wide vagina opening and pink surround as shown in27,28). Separate them in a different cage until use.
- Preparation of the anesthetized animals females (AF) or males (AM) as a stimulus
- For the AF, select a female from the pool above (either in pro-estrus or estrus).For the AM, select a male from a cage of adult male mice.
- Anesthetize the female or male with an intraperitoneal injection of a solution of Ketamine/Xylazine (100 and 10 mg/kg respectively).
- Use eye ointment to prevent dehydration of the eyes while the animal is anesthetized. Check proper anesthesia by testing the paw retraction reflex when pinched. Place the anesthetized animal in a clean cage on a paper towel, with the cage on the heat pad set on "minimum heat" to ensure control of body temperature.
- Re-use the same animals up to 2 to 3 times for different recording sessions if needed before they wake up (usually around 45 min). Put them back on the heat pad after each recording session.
- Control the respiratory rate by visual inspection (~ 60 - 80 breaths per min) and body temperature by touching the animal every 5 min (should be warm to touch).
- When ready to record, click on the "Record" button of software A.
NOTE: The recordings won't start unless the user clicks the key button associated with each channel; monitor the live audio feed from the cages on the computer screen to make sure the animals sing and the recordings are properly being obtained. - Simultaneously hit the associated key button of the desired box(es) to be recorded (i.e. F1 for box 1), and introduce the desired stimulus.
- Present one of the stimuli as follows. Place the cotton tip with fresh urine samples inside the cage, or place the live female inside the cage, or place one of the anesthetized- animals (AF or AM) on top of the cage's metal lid.
- Quietly close the recording box, and let the recording go for the preset number of minutes (e.g. 5 min as described in section 1.3).
- After recording, click the stop square red button to stop the recording.
- If an anesthetized animal was used as a stimulus, open the soundproof recording box, take the anesthetized animal from the cage's metal lid and put it back on the heating pad before the next recording session, or if no longer using the animal as a stimulus check it every 15 min until it has regained sufficient consciousness to maintain sternal recumbency.
- Open the cage and remove the conscious test animal, and place it back to its home cage. Clean the test cage with 70% alcohol and distilled water.
- Preparation of fresh urine (UR) samples as a stimulus
2. Processing .wav Files and Syllable Coding Using Mouse Song Analyzer v1.3
- Open coding software B (Figure 1, Table 1) and put the folder containing the Software Script C of "Mouse Song Analyzer" (Figure 1, Table 1) in software B's path by clicking on "set path" and add the folder on software B. Then close software B to save.
- Configure the combined software B+C's syllable identification settings. NOTE: The software script C code automatically creates a new folder called "sonograms" with files in .sng format in the same folder were the .wav files are located. It is usually better to put all the .wav files from the same recording session generated using software A in the same folder.
- Open software B configured with C.
NOTE: This version of software B is entirely compatible with the software script C. It cannot be guaranteed that any later versions will accept all the functions included in the current code. - Navigate to the folder of interest containing the recording .wav files to be analyzed using the "current folder" window.
- In the "command window", enter the "whis_gui" command.
- In the new whis-gui window, observe several sub-window sections with different parameters (Figure 3), including "Sonogram Parameters", "Whistle Options", and all others. Adjust the parameters for detecting USVs. Use the following parameter settings for detecting USVs syllables from laboratory mice (e.g. B6D2F1/J and C57BL/6J mouse strains used in our studies):
- In the Sonogram Parameters section, adjust the Min Frequency to 15,000 Hz, the Max Frequency to 125,000 Hz, the sampling frequency (Number of frequency) to 256 kHz, and the Threshold to 0.3.
- In the Whistle Options section, adjust the Purity Threshold to 0.075, the Min Duration of the syllable to 3 ms, the Min Frequency sweep to 20,000 Hz, and the Filter Duration to 3 ms.
- In the other sections, adjust the Min Note Duration to 3 ms, and the Min Note Count to 1.
- For syllable categorization protocol, select boxes in the middle section of the whis_gui window:
The default categorization is based on Holy and Guo11 and Arriaga et al.10, which codes syllable by the number of pitch jumps and the direction of the jump: S for simple continuous syllable; D for one down pitch jump; U for one up pitch jump; DD for two sequential down jumps; DU for one down and one up jump; etc. This will be default if the user does not select anything. The user has the option to run the analysis on certain syllable types by selecting each of the representative boxes.
To choose to syllable categorization as described by Scattoni, et al.9, additionally select Split s category, which separates this type into more sub-categories based on syllable shape.
Select Harmonics if the user wants to further sort syllables into those with and without harmonics.
- Open software B configured with C.
- Classify the syllables in the .wav files of interest
- Select all the .wav files from one recording session in the upper left section of the whis_gui window.
- Click "Get sonograms" in the middle of the whis_gui window (Figure 3). A new folder containing the sonograms will be created, with .sng file format.Select all the sonograms (.sng files) in upper left corner of whis-gui window.Enter "Animal ID" and "Session ID" in the boxes below the sonogram file window. Then click process sonograms.
- Observe three file types in the sonogram folder: "Animal ID-Session ID -Notes.csv" (contains information on the notes extracted from the syllables), "Animal ID-Session ID -Syllables.csv", (contains values of all the classified syllables, including their spectral features and the total number of syllables detected in the sonograms), "Animal ID-Session ID -Traces.mat", (contains graphical representations of all the syllables).
NOTE: The "Animal ID-Session ID -Syllables" file sometimes contain a small percent (2 - 16%) of unclassified USV syllables that are more complex than those selected, or that have two animal's syllables overlapping each other23. These can be examined separately from the trace file if necessary.
- Observe three file types in the sonogram folder: "Animal ID-Session ID -Notes.csv" (contains information on the notes extracted from the syllables), "Animal ID-Session ID -Syllables.csv", (contains values of all the classified syllables, including their spectral features and the total number of syllables detected in the sonograms), "Animal ID-Session ID -Traces.mat", (contains graphical representations of all the syllables).
3. Quantification of Syllable Acoustic Structure and Syntax
NOTE: Instructions for the steps to take for initial syntax analyses are included in the "READ ME!" spreadsheet of the "Song Analysis Guide v1.1.xlsx" file, our custom designed spreadsheet calculator E (Figure 1, Table 1).
- Open the software script C file output "Animal ID-Session ID -Syllables.csv" obtained in the section above with spreadsheet software D (Figure 1, Table 1). It contains the total number of syllables detected in all the sonograms, and all their spectral features.
- If not converted yet, within the spreadsheet software D convert this .csv file to column separation in software D in order to put each value into individual columns.
- Open the "Song Analysis Guide v1.1.xlsx" file also in software D. Then click on the template spreadsheet, and copy and paste the "Animal ID-Session ID -Syllables.csv" file data into this sheet as recommended in the Template sheet instructions. Remove rows with the 'Unclassified' category of syllables.
- After removing the 'Unclassified' rows, first copy and recalculate ISI (inter syllable interval) data in column O into column E. Second, copy all data from column A to N into to the 'Data' spreadsheet.
- In the Data spreadsheet enter the animal IDs (column AF) and recording length (in minutes; column AC).
NOTE: The animal IDs have to match the one entered in the recording set up. The file will detect the characters entered and compare it to the name of the .wav files. - Determine the ISI cutoff to define a sequence by using the spreadsheet labeled "Density ISI", the 'ISI plot' result.
NOTE: In our past study23, we set the cutoff at two standard deviations from the center of the last peak. It consisted of long intervals (LI) of more than 250 ms, which separated different song bouts within a session of singing. - View the main results in the 'Features' spreadsheet (grouping all the spectral features measured from each animal).
NOTE: If the user used the default syllable category setting in software script C described in section 2.8.9, the syllables are then further classified into 4 categories as described above and in Chabout, et al. 23: 1) simple syllable without any pitch jumps, « s » ; 2) two note syllables separated by a single upward (« u ») jump; 3) two note syllables separated by a single downward jump (« d »); and 4) more complex syllables with two or more pitch jumps between notes (« m »). - For syntax values, click on the "Global Probabilities" spreadsheet which calculates probabilities of each pair of syllable transition types regardless of starting syllables, using the following equation 23.
P (Occurrence of a transition type) = Total number of occurrences of a transition type / Total number of transitions of all types - Click on the 'Conditional probabilities' spreadsheet to calculate the conditional probabilities for each transition type relative to starting syllables, which uses the following equation:
P (occurrence of a transition type given the starting syllable) = Total number of occurrences of a transition type / Total number of occurrences of all transition types with the same starting syllable - To test whether and which of the above transition probabilities differ from non-random, using a first order Markov model, following the approach in23, to use custom software F (e.g. Syntax decorder in R studio; Figure 1, Table 1) with the following R scripts: Tests_For_Differences_In_Dynamics_Between_Contexts.R for within groups in different conditions; or Tests_For_Differences_In_Dynamics_Between_Genotypes.R for between groups in the same conditions.
- Perform a Chi-square test, or other test of your preference, to test for statistical differences in the transition probabilities of the same animal across different context (pair-wise), following the approach in23.
NOTE: More details about the statistical model used to compare syntax among groups are found in23. Researchers can use other approaches to analyze the global or conditional transition probabilities that they or others developed. - To graphically display the sequences as syntax diagrams enter the values into a network graphing software G (see Figure 1, Table 1), with nodes designating different syllable categories, and arrow color and/or thickness pixel representing ranges of probability values between syllables.
NOTE: For clarity, for the global probability graphs, we only show transitions higher than 0.005 (higher than 0.5% of chance occurrence). For the conditional probabilities, we use a threshold of 0.05 because each probability in the "global model" is lower considering that we divide by the total number of syllables and not only by one specific syllable type.
4. Song Editing and Testing Preference for a Type of Song
NOTE: Playbacks of USVs can be used to experimentally test an animal's behavioral response, including preference for a specific song type. Because female preferences might change depending on the estrus state, for females make sure they are in the same estrus state before testing as follows:
- Prepare females with sexual experience several days before the playback experiment
- Expose sexually mature females (> 7 weeks) to a male for 3 days before the experiments to trigger estrus (Whitten 28 effect), by placing them in a separation cage (clear solid plastic with drilled holes in it) allowing the female to see and smell the male but preventing sexual intercourse.
- Monitor the estrus cycle, and when pro-estrus or estrus is evident (vaginal opening and pink surround as shown in27), put females back together in their own cage. They are ready to be tested the next day.
- Prepare the song files for playback
- Use the copy and paste functions in a sound processing software H (e.g. SASLap Pro; Figure 1, Table 1) to create two edited .wav files with the desired conditions to be used for stimuli. To guard against amount of vocalizations as a variable, make sure the two sound files contain the same number of syllables and length of sequences (song bouts) from the same or different males/females from the desired contexts (e.g. UR).
- Open the first file containing song from condition 1 in software H. Then go to File > Specials > Add channel(s) from file, and select the second sound file to test from condition 2. This creates 2 channels, one for each condition.
- Adjust the volume visually if needed to make sure the volumes of the two files match each other, by going to Edit > Volume.
- Then go to Edit > Format > Sampling Frequency Conversion, and select convert from 250,000 Hz to 1,000,000 Hz to transform the .wav files from a sampling frequency of 256 kHz to 1 MHz. This step is necessary for the playback device to read the .wav files.
- Save these new files as the test files to be played back. Make sure to identify which song is in which channel (1 or 2). For clarity purposes name it "file name.wav".
- Go to Exit > Format > Swap Channels and swap the two channels. Save the swapped versions using a different name. NOTE: This will be the opposite copy with the channels inverted, named later 'file name_swapped.wav'.
- Prepare the playback apparatus
- Clean the playback apparatus "Y-maze" with 70% alcohol followed by distilled water. Dry it with paper towels. Our Y-maze is a homemade opaque solid black plastic apparatus, with arms of 30 cm long, and two drilled holes on the extreme ends of the maze to allow the ultrasound speaker to fit at floor level of the arms (Figure 4A).
- Make sure the speakers are in their proper positions and connected to the sound card, and the card is connected to the computer.
- Open software A, select Play > Device and select the playback sound card device. Select "use file header rate". Go to Play > Playlist and load the file of interest containing the two channels (i.e. "file.wav"). Select "loop mode". Set up the video recorder above the maze to cover the entire maze.
- Perform the playback experiment
- Place the test female in the maze for a 10-minute habituation period. After 10 minutes, if the female is not in the starting arm then gently push the female back to the starting arm, and close the plastic separation window.
- Select the prepared file ("file.wav") to playback and play it. Start the video recording, and make sure to identify which channel is positioned on which Y-maze's arm (i.e.: UR in the left, or FE in the right arm) with a paper note in the video recording field of view.
- Allow the female to hear the songs in loop mode and explore the maze during a desired number of minutes (i.e. 5 min): this is one session. Return the female back into the starting arm. Allow her to rest for 1 min while preparing the next session. Remove any urine traces and excrement with distilled water.
- Load the "file_swapped.wav" file". Switch the location of the paper notes for the video recording. Move the left one to the right side and vice-versa. After 1 min, play the file. Free the female for the second session.
- Repeat steps 4.4.3 to 4.4.4 for a total of 4 sessions x 5 minutes to control for detecting potential side bias during the test. Stop the video recording at the end of all sessions by clicking the red stop button. Clean the maze with 70% alcohol and distilled water between females.
- Repeat all the steps with different song exemplars a week later with the same females to obtain sufficient results to test reliability of the findings.
- Later observe the videos, and use the timer on the video and a stopwatch to measure the time spent by the females in each arm for each session. Analyze the resultant data statistically for possible song preferences.
Results
In present protocol, changes in vocal behavior and syntax of male B6D2F1/J mice were characterized. Generally, using this protocol we were able to record, on average per male per 5 min session, 675 ± 98.5 classified syllables in response to female UR, 615.6 ± 72 in FE, 450 ± 134 in AF, 75.6 ± 38.9 in AM and 0.2 ± 0.1 in male UR (n = 12 males). The rates were ~ 130 syllables/min for female UR, ~ 120 syllables/min for FE, or ~ 100 syllables/min for AF contexts (Figure 5A). Males produce a much larger amount of syllables in response to freshly collected urine relative to overnight collected urine10,23. Males also sing considerably less in presence of an anesthetized male or fresh male urine Figure 5A). Males also change their repertoire across context23. For example, B6D2F1/J males significantly increase production of multiple pitch jump "m" category syllables in the female urine condition (Figure 5B). They also change acoustic features of individual syllables across context. For example, B6D2F1/J males sing syllables at a higher amplitude and bandwidth in the female urine context, and higher spectral purity in the awake female context compared to the others (Figure 6)23.
This protocol also provides a means for measuring dynamic features of sequence and thus syntax changes. Using an adapted method from Ey, et al. 22, we use the ISI to define the gaps between sequences (Figure 7A)23, and then use the gaps to distinguish and analyze temporal patterns of syllable sequences. We showed longer sequence lengths are produced in the awake female context (Figure 7B)23. This technique allows us to calculate the ratio of complex sequences (composed by at least 2 occurrences of the "m" syllable type) versus simple sequences (composed of one or no "m" type, and thus mostly by "s" type). We found that with B6D2F1/J males the female urine context triggered a higher ratio compared to the others (Figure 7C)23, indicating they produced more complex syllables in the female urine condition, but also that such syllables are distributed over more sequences.
We are also able to calculate the conditional transition probabilities from one syllable type to another (24 transition types total including the transitions from and to the "silence" state)23. We found that in different contexts, the mice's choice of transition types for given starting syllables differs, and that there is more syntax diversity in the female urine condition (Figure 8)23. These observations are consistent with previous reports that show that males can change the acoustic features or repertoire composition of their vocalizations in response to different stimuli and experiences4,5,24.
Finally, the present protocol provides guidance to test female preferences with playbacks. We found that B6D2F1/J females prefer more complex songs (containing 2 or more "m" syllables) relative to simple songs23. Most females chose to stay more often on the side of the Y-maze that played the complex songs (Figure 4B).
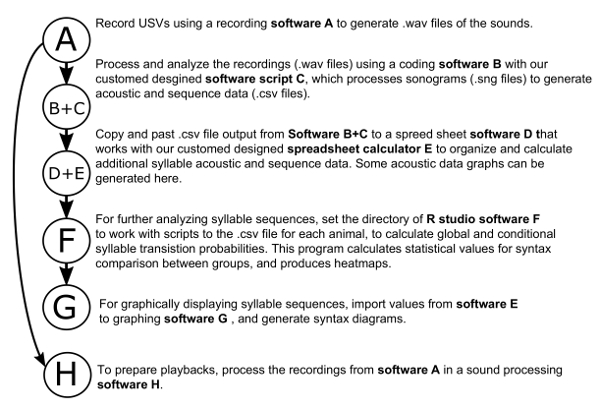
Figure 1: Flow Chart of Software Use and Analyses. Each program and associated code is given a letter name to help explain their identity and use in the main text. In ( ) are the specific programs we use in our protocol. Please click here to view a larger version of this figure.
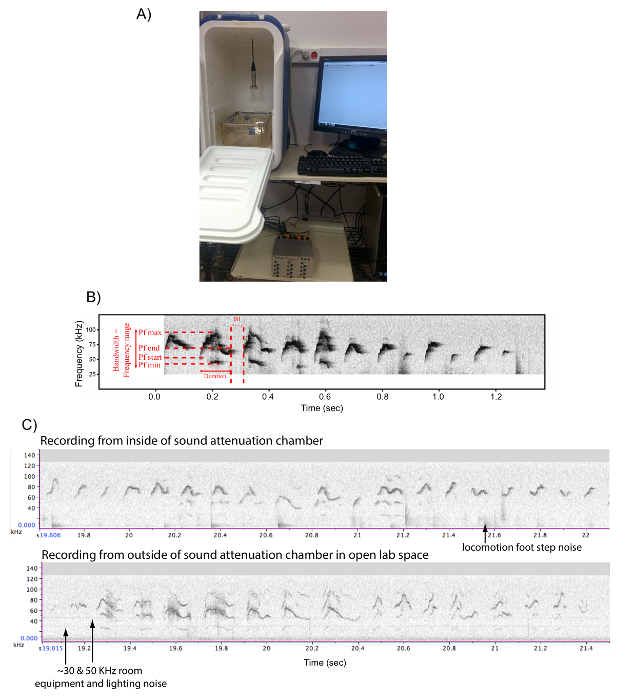
Figure 2: Set up for Recording Male Mice Songs. (A) Picture of a sound attenuation recording box and set up to record USV vocalizations. (B) Example sonogram of a recording made with Software A (Table 1), including detailed spectral features calculated by "Mouse Song Analyzer v1.3": duration, inter-syllable interval (ISI), peak frequency min (Pf min), peak frequency max (Pf max), peak frequency start (Pf start), peak frequency end (Pf end), and bandwidth. (C) Sonograms of another male singing to a live female, inside the sound attenuation box and outside of the box on the lab bench in the same room. Our anecdotal observations indicate that the recordings in the box of the same animal show larger volume (stronger intensity) and less harmonics, but no evidence of echoes in the box without sound foam. Please click here to view a larger version of this figure.
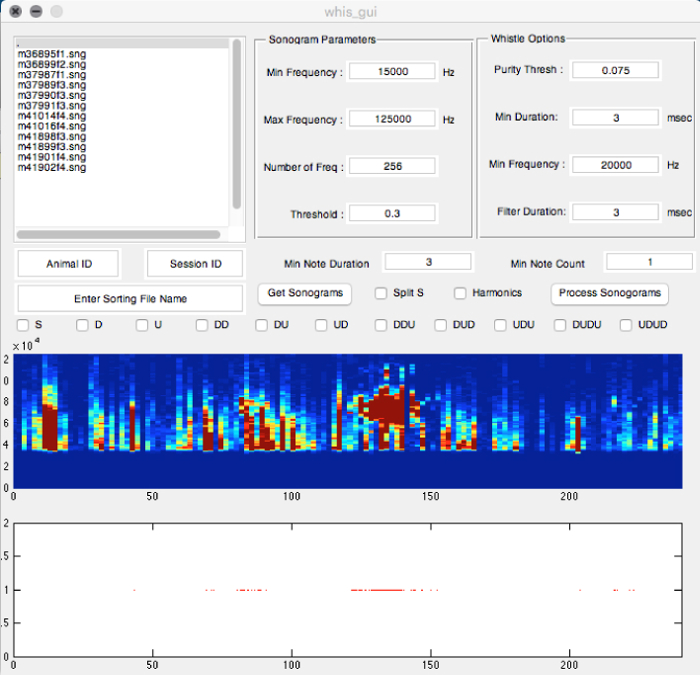
Figure 3: Screenshot of the "Mouse Song Analyzer v1.3" whis_gui Window Showing the Different Options Available for Analyses. The parameters shown are ones used to record male USVs in the figures and data analyses presented (except min note duration was 3 ms). Please click here to view a larger version of this figure.
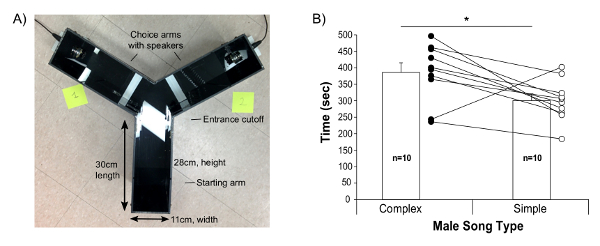
Figure 4: Female Choices Between Playbacks of Complex and Simple Songs. (A) Picture of the Y-maze apparatus used and dimension measurements. (B) Time spent by the females in each arm, playing either from a complex (female urine elicited) or more simple (awake female elicited) song from the same male. Data are presented for n = 10 B6D2F1J female mice as mean ± SE, with individual values also shown; 9 of the 10 females showed a preference for the more complex syllable/sequence song. * p < 0.05 paired student t-test. Figure modified from Chabout, et al. 23 with permission. Please click here to view a larger version of this figure.
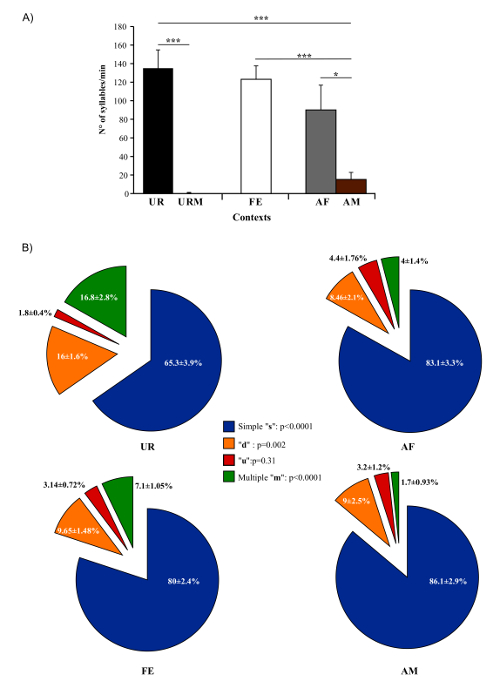
Figure 5: Number of Syllables Emitted and Repertoire Across Conditions. (A) Syllable production rate of males in different contexts. (B) Repertoire compositions of males when in the presence of female urine (UR), anesthetized female (AF), awake female (FE), and anesthetized male (AM) contexts. Data are presented as mean ± SEM. * p<0.03; ** p<0.005; *** p<0.0001 for post-hoc paired student t-test after Benjamini and Hochberg correction (n = 12 males). Figure from Chabout, et al. 23 with permission. Please click here to view a larger version of this figure.
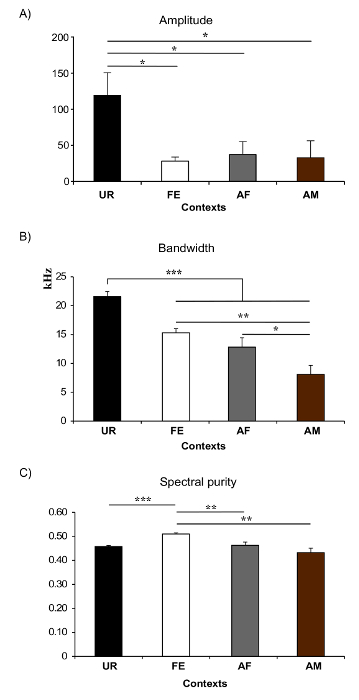
Figure 6: Examples of Spectral Features in Different Context. (A) Amplitude. * p< 0.025 for post-hoc paired student t-test after correction. (B) Frequency range or Bandwidth. *: p < 0.041; **: p < 0.005; ***: p < 0.0001 after correction. (C) Spectral purity of the syllables. * p: < 0.025; **: p < 0.005; ***: p < 0.0001 after correction. Abbreviations: female urine (UR), anesthetized female (AF), awake female (FE), and anesthetized male (AM). Figures modified from Chabout, et al. 23 with permission. Please click here to view a larger version of this figure.
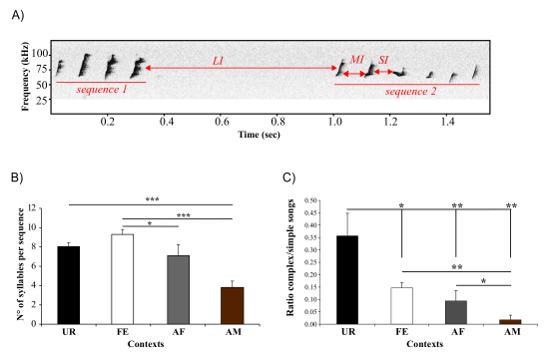
Figure 7: Sequence Measurements. (A) Usage of the ISI to separate the sequence. Short ISI (SI) and medium ISI (MI) are used to separate syllables within a sequence, and long ISI over 250 ms (LI) separate two sequences. (B) Length of the sequences, measured as number of syllables per sequence, produced by males in different contexts. *: p < 0.025; ** p < 0.005; *** p < 0.0001 after correction. (C) Ratio of complex songs over simple songs produced by males in different contexts. * p < 0.041; ** p < 0.005; *** p < 0.0001 after correction. Data are presented as mean ± SEM (n = 12 males). Figure from Chabout, et al. 23 with permission. Please click here to view a larger version of this figure.
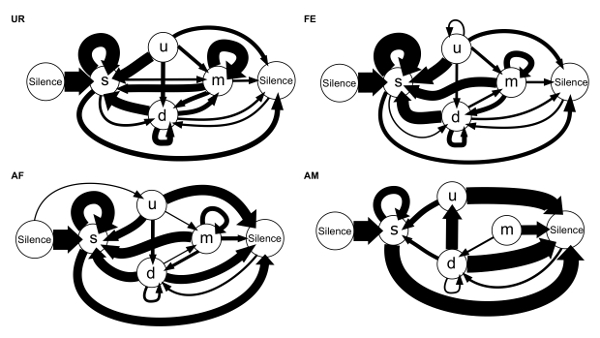
Figure 8: Syllable Syntax Diagrams of Sequences Based on Conditional Probabilities for Each Contexts. Arrow thickness is proportional to the conditional probability occurrence of a transition type in each context averaged from n = 12 males: P (occurrence of a transition given the starting syllable). For clarity, rare transitions below a probability of 0.05 are not shown. Figure from Chabout, et al. 23 with permission. Please click here to view a larger version of this figure.
Discussion
This protocol provides approaches to collect, quantify, and study male mice courtship vocalizations in the laboratory across a variety of mostly female-related stimuli. As presented previously in Chabout, et al. 23and in the representative results, the use of this method allowed us to discover context-dependent vocalizations and syntax that matter for the receiving females. The standardization of these stimuli will provide the collection of a reliable number of USVs and allow detailed analyses of the male's courtship songs and repertoires.
When a live female is present with the male, the protocol does not allow us to clearly identify the emitter of the vocalizations. However, previous studies showed that the majority of the vocalizations emitted in such context were by the male26,29. Most of the studies using a conspecific (male or female) as a stimulus for the males believe that the amount of female's vocalizations in these contexts is negligible4,5,22,30. However a recent paper used triangulation to localize the vocalization's of the emitter in group housed conditions31, and showed that within a dyad, the female contributes to ~10% of the USVs. In the present protocol the use of the anesthetized female allows the user to study the male vocalizations in the presence of a female without her vocalizing. In contrast to expectations of this recent study31, we found no difference in the number of syllables emitted between the FE and AF conditions23. It is possible that live females did not significantly contribute to the recordings or that the males vocalized less in the presence of live females versus anaesthetized females. Nevertheless, we believe that future experiments should consider the use of this triangulation method to assess the potential effect of the female contribution.
There are other software available that can do some the steps we have outlined, although we do not believe in a manner sufficient for the questions we asked using a combination of three programs: Software A, Mouse Song Analyzer software script C using software B, the syntax analysis software using a custom spreadsheet software D+E calculations, and syntax decorder using R. For example, a recent paper proposed a software named VoICE that allows the user to extract acoustic variables automatically from the sonograms or directly on units that had been manually selected by the user32. But, the automated or semi-automated sequence analyses are not as detailed as our approach. Some commercial software can automatically analyze the acoustic features, but do not provide an automatic classification of the syllables; the user has to sort the different syllables afterwards. Grimsley, Gadziola, et al. 33 developed a Table-based virtual mouse vocal organ program that clusters syllables based on shared acoustic features, but does not provide automatic detection of the syllables. Their program34 is unique in that it creates novel sequences from recorded songs using Markov models, and thus has more advanced features than simple editing.
Most prior communication studies on mice have focused on the emitter's side35,36. Few studies have explored the receiver's side30,37,38. Playback and discrimination protocols provide a simple test to study the receiver's side, such as the one also recently described by Asaba, Kato, et al. 39. In that study, the authors used a two-choice test box separated with acoustic foam instead of the Y-maze box described here. Both choice setups have advantages and disadvantages. First, the Y-maze doesn't isolate the sound from one arm to the other, but the two-choice box does. However, by using the Y-maze design, the animal can quickly evaluate the two songs that are played simultaneously, and move towards the preferred one. Nevertheless, playback experiments in general help experimenters determine the meaning and thus functions of the vocalizations generated for conspecific animals. In conclusion, after mastering the techniques of this protocol and analyses, readers should be able to address many questions that influence the context, genetics, and neurobiology of mouse USVs.
Using B6D2F1/J mice, the female associated stimuli almost always trigger USVs from the males we have tested in our lab. It is critical to collect enough syllables (> 100 in 5 min) to be able to obtain strong statistically analysis. For troubleshooting, if no USVs are recorded (or not enough), check the configuration to make sure sounds are recorded. Do a live inspection of what is happening in the cage during recording by looking at the real-time sonogram on the computer screen after the introduction of the stimulus. Otherwise try to re-expose the male to a sexually mature/receptive female overnight and then house them alone for several days or up to a week before recording again. Based on anecdotal observations, we find that some males sing a lot on one day (for almost the full 5 min), and not much the next day, and then again another day. We do not know the reason why such within subject variability occurs, but we surmise it is probably a motivational or seasonal for the males, and the estrus state for female urine. If no USVs are recorded, try to record the animal on multiple days to pick up these variable effects. Unlike in songbirds, we have not noted overt differences in amount of singing based on time of day. We find that the males do not sing much (< 100 syllables in 5 min) before they are 7 weeks old.
The detection methods presented here can extract thousands of syllables and all the acoustic parameters in a few minutes. But as any automatic detection method, it is very sensitive to background noise. Using Mouse Song Analyzer detection software with noisy recordings (for example from animals recorded with bedding) may require adjustment of the detection "threshold" to allow more flexibility. However, this will also increase the number of false positive syllables and the automatic detection might fail. Under such circumstances, manual coding can be used.
As stated earlier, the number, repertories, and latency of vocalizations are widely variable depending on the strain, thus one may have to change parameters (recording length, stimulus, automated syllable detection, etc.) for some strains to ensure optimal recordings for statistical analyses.
Disclosures
The authors have nothing to disclose.
Acknowledgements
This work was supported by the Howard Hughes Medical Institute funds to EDJ. We thank Pr. Sylvie Granon (NeuroPSI - University Paris south XI - FRANCE) for lending us the speaker hardware. We also thank members of the Jarvis Lab for their support, discussions, corrections and comments on this work, especially Joshua Jones Macopson for help with figures and testing. We thank Dr. Gustavo Arriaga for help with the Mouse Song Analyzer software, upgrading it for us to V1.3, and other aspects of this protocol. v1.0 of the software was developed by Holy and Guo, and v1.1 and v1.3 by Arriaga.
Materials
| Name | Company | Catalog Number | Comments |
|---|---|---|---|
| Sound proof beach cooler | See Gus paper has more info on specific kind | Inside dimensions (L 27 x W 23 x H 47 cm): | |
| Condenser ultrasound microphone CM16/CMPA | Avisoft Bioacoustics, Berlin, Germany | #40011 | Includes extension cable |
| Ultrasound Gate 1216H sound card | Avisoft Bioacoustics, Berlin, Germany | #34175 | 12 channel sound card |
| Ultrasound Gate Player 216H | Avisoft Bioacoustics, Berlin, Germany | #70117 | 2 channels playback player |
| Ultrasonic Electrostatic Speaker ESS polaroid | Avisoft Bioacoustics, Berlin, Germany | #60103 | 2 playback speakers |
| Test cage | Ace | #PC75J | 30 x 8 x 13 cm height; plexiglas |
| plexiglas separation | home made | - | 4 x 13 cm plexiglas with 1 cm holes |
| Video camera | Logitech | C920 | logitech HD Pro webcam C920 |
| Heat pad | Sunbeam | 722-810-000 | |
| Y-maze | Home made | - | Inside dimensions (L 30 x W 11 x H 29 cm): |
| Tweezers | |||
| Software | |||
| Avisoft Recorder (Software A) | Avisoft Bioacoustics, Berlin, Germany | #10101, #10111, #10102, #10112 | http://www.avisoft.com |
| MATLAB R2013a (Software B) | MathWorks | - | MATLAB R2013a (8.1.0.604) |
| Mouse Song Analyzer v1.3 (Software C) | Custom designed by Holy, Guo, Arriaga, & Jarvis; Runs with software B | http://jarvislab.net/wp-content/uploads/2014/12/Mouse_Song_Analyzer_ v1.3-2015-03-23.zip | |
| Microsoft Office Excel 2013 (Software D) | Microsoft | - | Microsoft Office Excel |
| Song Analysis Guide v1.1 (Software E) | Custom designed by Chabout & Jarvis. Excel calculator sheets, runs with software D | http://jarvislab.net/wp-content/uploads/2014/12/Song-analysis_Guided.xlsx | |
| Syntax decorder v1.1 (Software F) | Custom designed by Sakar, Chabout, Dunson, Jarvis - in R studio | https://www.rstudio.com/products/rstudio/download/ | |
| Graphiz (Software G) | AT&T Research and others | http://www.graphviz.org | |
| Avisoft SASLab (Software H) | Avisoft Bioacoustics, Berlin, Germany | #10101, #10111, #10102, #10112 | http://www.avisoft.com |
| Reagents | |||
| Xylazine (20 mg/mL) | Anased | - | |
| Ketamine HCl (100 mg/mL) | Henry Schein | #045822 | |
| distilled water | |||
| Eye ointment | Puralube Vet Ointment | NDC 17033-211-38 | |
| Cotton tips | |||
| Petri dish |
References
- Amato, F. R., Scalera, E., Sarli, C., Moles, A. Pups call, mothers rush: does maternal responsiveness affect the amount of ultrasonic vocalizations in mouse pups. Behav. Genet. 35, 103-112 (2005).
- Panksepp, J. B., et al. Affiliative behavior, ultrasonic communication and social reward are influenced by genetic variation in adolescent mice. PloS ONE. 2, e351(2007).
- Moles, A., Costantini, F., Garbugino, L., Zanettini, C., D'Amato, F. R. Ultrasonic vocalizations emitted during dyadic interactions in female mice: a possible index of sociability. Behav. Brain Res. 182, 223-230 (2007).
- Chabout, J., et al. Adult male mice emit context-specific ultrasonic vocalizations that are modulated by prior isolation or group rearing environment. PloS ONE. 7, e29401(2012).
- Yang, M., Loureiro, D., Kalikhman, D., Crawley, J. N. Male mice emit distinct ultrasonic vocalizations when the female leaves the social interaction arena. Front. Behav. Neurosci. 7, (2013).
- Petric, R., Kalcounis-Rueppell, M. C. Female and male adult brush mice (Peromyscus boylii) use ultrasonic vocalizations in the wild. Behaviour. 150, 1747-1766 (2013).
- Bishop, S. L., Lahvis, G. P. The autism diagnosis in translation: shared affect in children and mouse models of ASD. Autism Res. 4, 317-335 (2011).
- Lahvis, G. P., Alleva, E., Scattoni, M. L. Translating mouse vocalizations: prosody and frequency modulation. Genes Brain & Behav. 10, 4-16 (2011).
- Scattoni, M. L., Gandhy, S. U., Ricceri, L., Crawley, J. N. Unusual repertoire of vocalizations in the BTBR T+tf/J mouse model of autism. PloS ONE. 3, (2008).
- Arriaga, G., Zhou, E. P., Jarvis, E. D. Of mice, birds, and men: the mouse ultrasonic song system has some features similar to humans and song-learning birds. PloS ONE. 7, (2012).
- Holy, T. E., Guo, Z. Ultrasonic songs of male mice. PLoS Biol. 3, 2177-2186 (2005).
- Portfors, C. V. Types and functions of ultrasonic vocalizations in laboratory rats and mice. J. Amer. Assoc. Lab. Anim. Science: JAALAS. 46, 28-28 (2007).
- Wohr, M., Schwarting, R. K. Affective communication in rodents: ultrasonic vocalizations as a tool for research on emotion and motivation. Cell Tissue Res. , 81-97 (2013).
- Pasch, B., George, A. S., Campbell, P., Phelps, S. M. Androgen-dependent male vocal performance influences female preference in Neotropical singing mice. Animal Behav. 82, 177-183 (2011).
- Asaba, A., Hattori, T., Mogi, K., Kikusui, T. Sexual attractiveness of male chemicals and vocalizations in mice. Front. Neurosci. 8, (2014).
- Balaban, E. Bird song syntax: learned intraspecific variation is meaningful. Proc. Natl. Acad. Sci. USA. 85, 3657-3660 (1988).
- Byers, B. E., Kroodsma, D. E. Female mate choice and songbird song repertoires. Animal Behav. 77, 13-22 (2009).
- Hanson, J. L., Hurley, L. M. Female presence and estrous state influence mouse ultrasonic courtship vocalizations. PloS ONE. 7, (2012).
- Pomerantz, S. M., Nunez, A. A., Bean, N. J. Female behavior is affected by male ultrasonic vocalizations in house mice. Physiol. & Behav. 31, 91-96 (1983).
- White, N. R., Prasad, M., Barfield, R. J., Nyby, J. G. 40- and 70-kHz Vocalizations of Mice (Mus musculus) during Copulation. Physiol. & Behav. 63, 467-473 (1998).
- Hammerschmidt, K., Radyushkin, K., Ehrenreich, H., Fischer, J. Female mice respond to male ultrasonic 'songs' with approach behaviour. Biology Letters. 5, 589-592 (2009).
- Ey, E., et al. The Autism ProSAP1/Shank2 mouse model displays quantitative and structural abnormalities in ultrasonic vocalisations. Behav. Brain Res. 256, 677-689 (2013).
- Chabout, J., Sarkar, A., Dunson, D. B., Jarvis, E. D. Male mice song syntax depends on social contexts and influences female preferences. Front. Behav. Neurosci. 9. 76, (2015).
- Hoffmann, F., Musolf, K., Penn, D. J. Freezing urine reduces its efficacy for eliciting ultrasonic vocalizations from male mice. Physiol. & Behav. 96, 602-605 (2009).
- Roullet, F. I., Wohr, M., Crawley, J. N. Female urine-induced male mice ultrasonic vocalizations, but not scent-marking, is modulated by social experience. Behav. Brain Res. 216, 19-28 (2011).
- Barthelemy, M., Gourbal, B. E., Gabrion, C., Petit, G. Influence of the female sexual cycle on BALB/c mouse calling behaviour during mating. Die Naturwissenschaften. 91, 135-138 (2004).
- Byers, S. L., Wiles, M. V., Dunn, S. L., Taft, R. A. Mouse estrous cycle identification tool and images. PloS ONE. 7, (2012).
- Whitten, W. K. Modification of the oestrous cycle of the mouse by external stimuli associated with the male. J. Endocrinol. 13, 399-404 (1956).
- Whitney, G., Coble, J. R., Stockton, M. D., Tilson, E. F. ULTRASONIC EMISSIONS: DO THEY FACILITATE COURTSHIP OF MICE. J. Comp. Physiolog. Psych. 84, 445-452 (1973).
- Asaba, A., et al. Developmental social environment imprints female preference for male song in mice. PloS ONE. 9, 87186(2014).
- Neunuebel, J. P., Taylor, A. L., Arthur, B. J., Egnor, S. E. Female mice ultrasonically interact with males during courtship displays. eLife. 4, (2015).
- Burkett, Z. D., Day, N. F., Penagarikano, O., Geschwind, D. H., White, S. A. VoICE: A semi-automated pipeline for standardizing vocal analysis across models. Scientific Reports. 5, 10237(2015).
- Grimsley, J. M., Gadziola, M. A., Wenstrup, J. J. Automated classification of mouse pup isolation syllables: from cluster analysis to an Excel-based "mouse pup syllable classification calculator". Front. Behav. Neurosci. 6, (2012).
- Grimsley, J. M. S., Monaghan, J. J. M., Wenstrup, J. J. Development of social vocalizations in mice. PloS ONE. 6, (2011).
- Portfors, C. V., Perkel, D. J. The role of ultrasonic vocalizations in mouse communication. Curr. Opin. Neurobiol. 28, 115-120 (2014).
- Merten, S., Hoier, S., Pfeifle, C., Tautz, D. A role for ultrasonic vocalisation in social communication and divergence of natural populations of the house mouse (Mus musculus domesticus). PloS ONE. 9, 97244(2014).
- Neilans, E. G., Holfoth, D. P., Radziwon, K. E., Portfors, C. V., Dent, M. L. Discrimination of ultrasonic vocalizations by CBA/CaJ mice (Mus musculus) is related to spectrotemporal dissimilarity of vocalizations. PloS ONE. 9, 85405(2014).
- Holfoth, D. P., Neilans, E. G., Dent, M. L. Discrimination of partial from whole ultrasonic vocalizations using a go/no-go task in mice. J. Acoust. Soc. Am. 136, 3401(2014).
- Asaba, A., Kato, M., Koshida, N., Kikusui, T. Determining Ultrasonic Vocalization Preferences in Mice using a Two-choice Playback. J Vis Exp. , (2015).
Reprints and Permissions
