Persons infected with HIV are often frail, depressed and live a sedentary lifestyle for which conventional exercise is too taxing. Here, we present an exercise protocol that ameliorates aspects of frailty in HIV-infected persons. An exergame integrating cognitive control was developed using biosensors that measured balance, weight-shifting and obstacle crossing.
Method Article
Exergaming in Older People Living with HIV Improves Balance, Mobility and Ameliorates Some Aspects of Frailty
In This Article
Summary
Abstract
Approximately 1.2 million people in the United States live with HIV infection. Medical advancements have increased the life expectancy and this cohort is aging. HIV-positive individuals have a high incidence of frailty (~20%) characterized by depression and sedentary behavior. Exercise would be healthy, but due to the frail status of many HIV-positive individuals, conventional exercise is too taxing. The aim of this study was to evaluate the effectiveness and acceptability of a novel game-based training program (exergame) in ameliorating some aspects of frailty in HIV-infected individuals. Ten older people living with HIV were enrolled in an exergame intervention. Patients performed balance exercises such as weight shifting, ankle reaching, and obstacle crossing. Real-time visual/audio lower-extremity joint motion feedback was provided using wearable sensors to assist feedback and encourage subjects to accurately execute each exercise task. Patients trained twice a week for 45 min for 6 weeks. Changes in balance, gait, psychosocial parameters and quality of life parameters were assessed at the beginning, midterm and at conclusion of the training program. Ten patients completed the study and their results analyzed. The mean age was 57.2 ± 9.2 years. The participants showed a significant reduction in center of mass sway (78.2%, p = .045) during the semi-tandem balance stance with eyes closed and showed a significant increase in gait speed during a dual task motor-cognitive assessment (9.3%, p = .048) with an increase in stride velocity of over 0.1 m/sec. A significant reduction in reported pain occurred (43.5%, p = .041). Preliminary results of this exergame intervention show promise in improving balance and mobility while requiring older people living with HIV to be more active. The exergame can be continued at home and may have long term as well as short-term benefits for ameliorating frailty associated with HIV infection.
Introduction
The implementation of effective antiretroviral therapy (ART) for human immunodeficiency virus (HIV) infection has resulted in infected persons living to an older age.1 The mean age of HIV-infected patients is increasing2 and it is predicted that 73% of individuals infected with HIV will be aged 50 years or older by 2030.3 Persons aging with HIV infection may have "accelerated aging" with an earlier than expected occurrence of many diseases of aging including frailty and high risk of falling.4-8 Similarly, persons with HIV infection have a high prevalence of comorbidities including cognitive decline, peripheral sensory damage (i.e., neuropathy) and pain leading to physical impairments and elevated fall risk.9 Approximately 75% of HIV-infected persons receive at least one prescription medication in addition to ART including some prescriptions associated with high-fall risk (cardiovascular and psychoactive medications).10 HIV infection is associated with neuropathy, which is highly prevalent among older adults with HIV.11 In addition, HIV could lead to cognitive decline and thus impact the mobility and risk of falling leading to loss of independence and poor quality of life.12
A few studies demonstrate the benefits of exercise in patients with HIV, e.g., improving balance, pain perception, perception of life satisfaction, reducing functional limitations, and improving the quality of life.13-18 However, conventional exercise may not be appropriate for many older HIV adults due to risk of fall, lost joint perception, reduced joint mobility and overall frail status. These features may limit exercise performance particularly in those suffering from neuropathy.19,20 HIV infection can be associated with loss of lean body mass which may be related to difficulty in exercising, poor nutrition, widespread pain, metabolic disturbances, and lipid abnormalities,21 all contributing to an inability to participate in conventional exercise.15 In addition, with a 20% incidence of frailty6,7 many exercises will not be appropriate for the frail, older adult. Thus, several factors need to be considered during development and implementation of exercise for older HIV adults including compensation for lost joint perception, improving motor-cognitive performance, controlling the intensity of training to avoid overtaxing and finally, personalization of exercise by adapting exercises in their intensity and timing to account for physical limitations. Exergaming and virtual-reality techniques have been evaluated for training of motor control in the elderly22-24 with benefits including concordance of visual and proprioceptive information, salient feedback from joint movement as well as activation of motor related areas in the brain.24-26
In this study we evaluated the effectiveness and acceptability of tailored sensor-based interactive exercises of the lower extremities with real-time feedback and their effect on improving postural stability and activities of daily living in HIV-infected older adults. The exercise training specifically focused on ankle joint and lower extremity range of motion with both cognitive and motor components. We hypothesize that exercise training through an interactive interface with real-time visual joint movement during exercise will not only improve postural stability, but may ameliorate features of frailty, if not frailty itself.
Protocol
The study was approved by the Institutional Review Board of the University of Arizona. Participants provide their signed consent to participate.
1. Recruit HIV-infected Participants
- Recruit HIV patients attending the Petersen clinic at Banner-University Medical Center Tucson Campus >50 years of age, able to walk without assistance for at least 15 feet and committed to attending training appointments for 30-60 min, twice a week, for six weeks.
- Screen the recruits for depression with the Center for Epidemiological Studies Depression (CES-D) 27 questionnaire. (This is to gather a cohort representative of the more depressed HIV population subset.) If moderately or severely depressed (a score of >16 on the CES-D) ask the person to participate in the study.
2. Assess the Frailty Status of the Participants by the method of Fried et al.28 with slight modifications for the HIV population29
- Measure subjects for (1) Shrinking or unintentional weight loss; (2) Slowness or decreased gait speed; (3) Weakness as measured by grip strength; (4) Low physical activity level by calorie count; (5) and Exhaustion or depression by answering the CES-D questionnaire.27
- Collect demographic data pre-intervention along with questionnaires assessing fear of falling (FES-I: Short-Falls Efficacy Scale - International),30 and quality of life (Short-Form Health Survey, SF-1231), fall history, pain assessment using Visual Analogue Scale, activities of daily living (Barthel Index of Activities of Daily Living32).
3. Begin Training Intervention
- Conduct Training Exercises for 3 -60 min Over a 6-week Period as Shown in Table 1.
- Have subjects perform all of the exercises and increase the difficulty of the exercises.
- Attach 5 inertial sensors to the subject's body that allow estimation of joint 3D angles in real-time33 and provide tri-axial accelerometer, gyroscopic and magnetometer data along with quaternion parameters.34,35 Attach sensors at the shanks, thighs and lower back using self- adhering straps.
- At Baseline, Measure the Subject's Balance and Gait. Also Measure Balance and Gait at the midpoint and Last Session.
- Measure balance as Center of Mass (CoM) sway provided by feedback from the biosensors.
- Have the subject stand for 30 sec with feet in a double stance- first eyes open then repeated with eyes closed; followed by feet in semi-tandem stance – eyes open and then closed.
- Observe the biosensor data and ask the subject to maintain eyesight straightforward at the wall during measurements.
- Collect balance measurements using the sensors placed at the ankles and the waist.35,36 Main balance outcomes included changes in CoM sway in anterior-posterior and medial-lateral direction measured with eyes open and eyes closed.
- Evaluate gait by having the subject perform a walk of 10 m. The trainer can observe the biosensor data but the subject cannot.
- Collect gait measurements for single task (a normal 10 m walk), dual task (10 m walk while performing cognitive task (counting backwards from a given number by 1) and fast walk (a fast-paced 10 m walk).
- Assess main gait outcomes for gait speed and variability as collected by sensors at the ankles and thighs.37,38
- At the baseline and follow-up sessions, give the subject a shirt to wear for 48 hr with a monitor39,40 to gather normal physical activity data.
Note: The exercises above improve balance in patients with peripheral neuropathy.24,41
- Measure balance as Center of Mass (CoM) sway provided by feedback from the biosensors.
- In sessions 1-12, perform an ankle reaching task (Figure 1).
- Explain the exercise and then have the subject perform the ankle reaching task, which requires forward/backward/sideward/diagonal leaning and partial weight transfer of the subject while standing in front of the computer screen.
Note: Data from shank-mounted sensors provide real-time visual feedback about 2D ankle trajectory. Rotations of the ankle joints are translated to a linear cursor on the computer screen (Figure 1). There are two circles on the screen, one is the starting circle and the other is the target circle (they are separated on the computer screen, one on the bottom and one on the top). - Have the subject move the cursor (a dot on the screen which represents the subject) from the middle of the starting circle to the middle of the target circle. The cursor's position on the screen is determined by the biosensors so that by moving the ankle the cursor will move on the screen.
- Have the subject navigate the cursor from a start circle to a target circle by ankle joint rotation while standing with feet rooted in place. To move the cursor forward/backward, have the participant move the hip in the anterior-posterior direction to generate ankle dorsi-flexion or plantar-flexion. Medial-lateral hip movement navigates the cursor sideways. A task repetition in the opposite direction completes one cycle.
- Have the subject navigate rapidly (<1 sec) and accurately (in middle of the circle) from one circle to another. Corroborate correct execution by a visual cue (exploding of the target) and auditory cue (explosive sound) feedback. Use these cues as incentives for the subject to remain engaged in the exercise and perceive the improvement during the course of exercise.
- Transmit motor-error due to inaccuracy of navigating to and stopping at the center of the target circle in a timely manner to the subject via an audio-visual feedback at the end of the execution of each trial. A visual cue of a green circle in combination with an absence of noise is indicative of the correct action performed too slowly. Whereas a visual cue of a blue circle in combination with an absence of noise is indicative of the correct action performed faster than expected by the program.
- For each session, perform 9 blocks with 20 cycles of ankle reaching.
- Perform blocks 1 + 4 + 7 in the anterior-posterior direction.
- Perform block 2 + 5 + 8 in a combined anterior-posterior and medial-lateral direction for a diagonal movement.
- Perform block 3 + 6 + 9 with a visuomotor rotation task42 to increase the motor and cognitive challenge. In this task, rotate the trajectory of the cursor by 20o. The subject observes this change in trajectory during the exercise and adjusts ankle coordination to navigate the cursor towards the target circle. Visuomotor rotation improves postural adaptation and postural calibration.37
- Have participants rest between blocks to avoid fatigue (30 to 60 sec).
- In sessions 9-12, implement a more difficult ankle reaching exercise, the motor-cognitive ankle reaching exercise.
- In these exercises, present 5 circles on the screen and label with either numbers or letters along with an origin "home" circle. Give the command to move the cursor from circle to circle in some order. For example, ask the subject to move the cursor from circle 1 to "home" to 2 to "home" to 3 and so on or some variation of this order requiring the subject to memorize the order of circles to move the cursor to.
Note: This task is designed to enhance coordination between ankle, knee, and hip joints during weight shifting tasks.24,41
- In these exercises, present 5 circles on the screen and label with either numbers or letters along with an origin "home" circle. Give the command to move the cursor from circle to circle in some order. For example, ask the subject to move the cursor from circle 1 to "home" to 2 to "home" to 3 and so on or some variation of this order requiring the subject to memorize the order of circles to move the cursor to.
- Explain the exercise and then have the subject perform the ankle reaching task, which requires forward/backward/sideward/diagonal leaning and partial weight transfer of the subject while standing in front of the computer screen.
- In sessions 2-12, perform an obstacle crossing task with increasing degrees of difficulty.
- In sessions 2-7, utilize an obstacle crossing task with obstacles at 5% and 10% of height of subject. In sessions 9 - 12, add an additional obstacle crossing task with obstacles at 15% and 20% of the height of the subject.
- Have the subject face the computer screen where an avatar of the subject is present showing the hips and lower limbs. Have the subject watch the screen while performing this task.
- After an explanation, have the subject perform the obstacle crossing task (Figure 2). In this task the participant crosses virtual obstacles (boulders) moving on the computer screen from right to left. Real-time feedback is given using a stick figure avatar representing the participant's hip and knee movements. The avatar replicates lower limb movements including lifting the designated leg to an appropriate height to cross an obstacle.
- For each session, include two or four series of obstacle crossings with ten repetitions each. To cognitively challenge participants, the program requires that they cross the obstacle alternatively with the left or the right leg. If the sequence of leg lifting is mistaken, the subject will be notified via audio-visual feedback. The next obstacle is released only after the participant either crosses or hit the previous obstacle and returns to double-stance for at least 2 sec (for safety).
- Give participants audio feedback at the end of each obstacle-crossing trial which indicated whether they successfully crossed the obstacle or not. They could hold on to a sturdy desk for support if required. However, after gaining confidence, encourage them to perform the exercises without support.
Note: The virtual obstacle crossing task is designed to enhance perception of the position of the lower limbs, reduce reaction time and improve single leg balance.
4. Trainer Measures and Records All Interventions
- Collect demographic data post-intervention along with questionnaires assessing fear of falling (FES-I: Short-Falls Efficacy Scale - International),30 and quality of life (Short-Form Health Survey, SF-1231), fall history, pain assessment using Visual Analogue Scale, activities of daily living (Barthel Index of Activities of Daily Living32), and depression with the CES-D questionnaire.27
5. Remunerate Subject For Their Time
6. Perform Statistical Analysis on All Subjects and Their Measured Responses to the Tasks
- Use paired samples student's t-tests and one-way ANOVA tests to compare patient's measurements at baseline and follow-up against themselves and within groups at follow-up (i.e. depressed/not depressed, pre-frail vs. non-frail, etc.), respectively. Report results as +/- SEM.
- Perform univariate linear regression analysis to explore hypothesized factors and outcomes in response to the training such as depression and frailty status with delta and baseline gait speed. Provide results with statistical significance of p <0.05, and coefficient of determination, R2, for the model fit.
Results
Ten adult older people living with HIV (Age: 57.2 ± 9.2 years, BMI: 27.0 ± 2.8) underwent 6 weeks (twice a week) training and successfully completed all sessions and their results were analyzed..
The participants showed a significant reduction in center of mass (CoM) sway (78.2%, p = .045) during the semi-tandem balance stance with eyes closed, one of the more difficult positions for this population subset (Figure 3). Participants show a significant increase in gait speed during a dual task motor-cognitive assessment (9.3%, p = .048) with an increase in stride velocity of over 0.1 m/sec that achieved statistical significance (Figure 4). The pain questionnaire also showed a significant reduction in reported pain (43.5%, p = .041), an important indicator for quality of life assessment (Figure 5).
Those participants who indicated depression (> 16) at baseline, as assessed by the CES-D questionnaire, reported a trend of slower gait speed during single task walk (<1.3 m/sec, R2 = 0.2911). This group with slower baseline gait speed showed a trend for greater improvement in delta gait speed for pre vs. post-intervention (R2 = 0.3906). Another trend was observed relating change in gait speed to frailty status. Non-frail patients reported reductions averaging -0.08 m/sec in their gait speed during initiation and steady state phase at follow-up from baseline (p = 0.125) whereas, patients classified as pre-frail due to depression at baseline reported improvements averaging .09 and .082 m/sec in their gait speed during initiation and steady state phase, respectively, post-intervention versus baseline (p = 0.143).
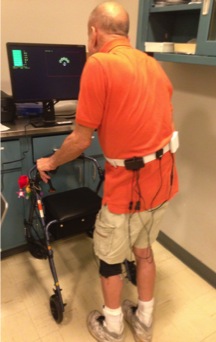
Figure 1: Subject Performing Motor-cognitive Ankle Reaching Task with Support of Walker. Subject is viewing a virtual representation of himself (avatar) on the screen. His motion is in response to the auditory and visual feedback from the screen in front of him provided by the biosensors seen at the ankles, thighs and waist. The individual gave written consent to being photographed.
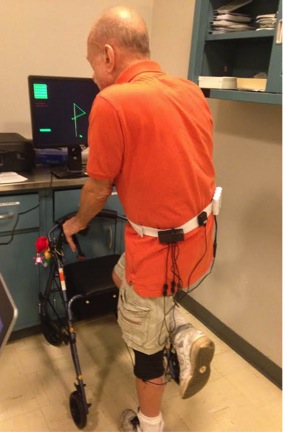
Figure 2: Subject Performing Obstacle-crossing Task with Support of Walker. The subject sees only his lower limbs on the screen and alternates moving his legs to avoid hitting the virtual obstacle displayed on the screen. The individual gave written consent to being photographed.
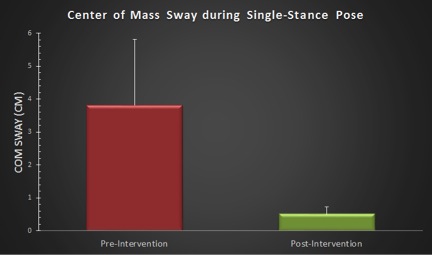
Figure 3: Improvement in Center of Mass Sway during a Single Stance Pose, Pre- and Post-intervention. The subject demonstrates a reduction in movement, i.e., sway, indicating improved balance. Error bars represent SEM.
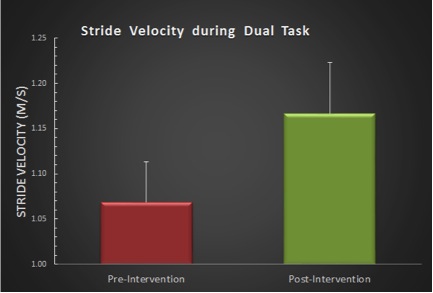
Figure 4: Improvement in Stride Velocity, Pre- and Post-intervention. Stride velocity is measured in units of m/sec. A faster velocity is indicative of better physical performance. The error bars represent SEM.
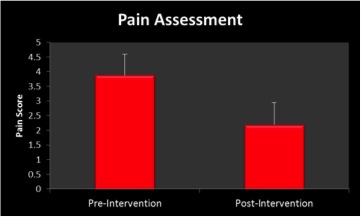
Figure 5: Improvement in Pain Assessment, Pre- and Post-intervention. This is obtained from a self- reported questionnaire noting a reduction in daily pain (on a scale of 0-10). The error bars represent SEM.
| Session | Activities Performed | Time | |
| Baseline | Balance and gait exercises | Total time 20 min; each exercise (6) and balance poses (6) are 2-3 min in duration | |
| Session 1 | Balance and ankle reach exercises | Total time 25 min; balance poses (4) are 2-3 min and 3 sets of 3 of ankle reaching task, each set is 5 min | |
| Sessions 2-7 | Balance, ankle reach and obstacle crossing exercises at 5% and 10% height of subject | Total time 35 min; obstacle crossing, each height is 5 min | |
| Midline | Repeat baseline | Total time 20 min; each exercise (6) and balance poses (6) are 2-3 min in duration | |
| Sessions 9-12 | Same as 2-7 sessions plus motor-cognitive ankle reach and obstacle crossing at 15% and 20% height of subject | Total time is 45 min; additional 10 min for each of the added two heights | |
| Follow up | Repeat baseline | Total time 20 min; each exercise (6) and balance poses (6) are 2-3 min in duration | |
Table 1: Training Sessions and Exercises.
Discussion
We have found that among frail HIV patients, 100% were depressed as measured by the CES-D scale; 30% are mildly depressed and 70% have a major depressive disorder.7 It is important to stress that in a non-frail HIV patient population, depression was very common as well with 38% being depressed. Although all depressed patients availed themselves of counseling and anti-depressive medications they remained depressed, thus contributing to a pre-frail (subject having 1 or 2 of the 5 criteria of Fried for frailty28 or frail state, 3 or more criteria). Because depression is so prevalent among HIV patients we are attempting to ameliorate the mood disorder and frailty with novel interventions such as described here. We are employing exercises requiring cognitive control that involve balance and gait, features in HIV-infected persons that are often compromised in the pre-frail and frail state. The exergaming described here is very low impact in the physical sense and thus, has little risk for frail patients. It is important that all of the exercises and sessions are completed in sequence since they become increasing difficult, particularly in the sphere of cognitive input. For example, in the later sessions memorizing the sequence of moving the cursor by moving the ankle is important for successful completion. It is critical that each task is completed in order for accurate data to be recorded and therefore, meaningful comparisons can be made between subjects.
Virtual reality gaming, such as Nintendo Wii Exergames, can improve physical function, cognition and psychosocial outcomes in the elderly.43 One study of twenty, 60-95 year-old individuals included depression screening. This study did not demonstrate any significant difference in Geriatric Depression Scale scores measured at the beginning and the end of the study. The intervention lasted for 6 weeks and consisted of 3 days a week, 35-45 min sessions with 3 balance games.44 Although the exercise regimen in that study is similar in length to that used in our study, the commercial games require more vigorous movement than the exercises in our study. Furthermore, the exercises in our study are calibrated to each unique individual, whereas, the commercial exergames are intended for use by anyone in the general population and thus, do not have the precision and accuracy that the exercises reported here possess.
Exercise alone has been shown to prevent the onset of depression.45 Exercise can ameliorate depression but, its effects are not long-lasting.46 The intervention in HIV patients reported here involves virtual reality exercises calibrated to each unique patient. Cognitive input in the form of choosing how to change the patient's virtual representation, the speed of action, direction and magnitude are under the subject's cognitive control. Although similar to commercial exergames the methods differ in important ways. For example the commercial games are standardized for use by large numbers of individuals whereas with our protocol measurements are individualized for each patient, biosensors being employed at various body sites which make for precise and accurate measurements. Preliminary data shows promise for this form of technological intervention in making improvements in the depressive and frailty state of HIV-infected individuals. The preliminary results are promising for balance and gait improvements in the HIV population and the effectiveness of this novel wearable sensor virtual-reality based balance training program. Gait is one of the measurements used to assess for frailty28 and balance contributes to the character of gait. The significant reductions in CoM sway and increases in gait speed are promising for an intervention of this duration and shows the potential to ameliorate aspects of frailty.
With ongoing participation we hope to see continuing improvements in overall quality of life of the HIV patient in psychosocial parameters (i.e. pain, depression) as well as objective measures (i.e. frailty status, gait speed, CoM sway, etc.). We believe that along with the physical improvements in balance and gait there could be an associated lower risk and fear of falling. Also, with reduction of pain and encouragement of physical activity and cognitively challenging exercises through introduction of this intervention we hope to see improvements in daily physical and social activity, and a lessening of the depressive state. The study was preliminary but it shows that the intervention may be effective in addressing some aspects of frailty and was well accepted by the subjects. The duration of the intervention was short and will require follow-up at later dates to assess the true value and benefits. One major drawback to subjects participating in the study is the large time commitment on the part of the subjects. Individuals who were interested in the participating were often unable to meet the time commitment needed to complete the exercises (twice a week for 6 weeks) and many could not afford the travel expenses. We are planning on refining the exercises and perhaps reducing the time required for the sessions.
This study provides promising preliminary results for the use of this novel wearable sensor virtual-reality based balance training exercise program in a clinical or home setting to improve postural balance and gait. This study also explores the trend that those who benefit the most or have the greatest improvement in these objective modalities are the depressed or pre-frail individuals. This could improve their overall quality of life by reducing the fear of fall and fall risk and encouraging and increasing overall physical activity.
Disclosures
The authors have no competing financial interests or Conflicts of Interest in this research.
Acknowledgements
Funding for this research was provided by intramural funds from the Division of Infectious Diseases.
Materials
| Name | Company | Catalog Number | Comments |
|---|---|---|---|
| Handhold | Optional; for very frail patients | ||
| 2 sensors: LegSys and Pamsys | Biosensics, Cambridge, MA | ||
| Computer screen | Placed in front of the subject | ||
| Program of exercise protocols | These display objects and avatar on the screen | ||
| Large clinic examination room | Needs to accommodate the activities of subject and trainer | ||
| 1 older HIV-infected subject | |||
| 1 trainer |
References
- High, K. P., et al. HIV and aging: state of knowledge and areas of critical need for research. A report to the NIH Office of AIDS Research by the HIV and Aging Working Group. J Acquir Immune Defic Syndr. 60, S1-S18 (2012).
- Martin, C. P., Fain, M. J., Klotz, S. A. The older HIV-positive adult: a critical review of the medical literature. Am J Med. 121, 1032-1037 (2008).
- Smit, M., et al. Future challenges for clinical care of an ageing population infected with HIV: a modelling study. Lancet Infect Dis. 15, 810-818 (2015).
- Deeks, S. G. Immune dysfunction, inflammation, and accelerated aging in patients on antiretroviral therapy. Top HIV Med. 20, 118-123 (2009).
- Erlandson, K. M., et al. Risk factors for falls in HIV-infected persons. J Acquir Immune Defic Syndr. 61, 484-489 (2012).
- Ianas, V., Berg, E., Mohler, M. J., Wendel, C., Klotz, S. A. Antiretroviral therapy protects against frailty in HIV-1 infection. J Int Assoc Provid AIDS Care. 12, 62-66 (2013).
- Rees, H., Meister, E., Mohler, J., Klotz, S. HIV-related frailty is not characterized by sarcopenia. J Int Assoc Provid AIDS Care. , (2014).
- Klotz, S., Mohler, M. Contemporary HIV patients and the frailty syndrome: A short review. Austin J Infect Dis. 1, 2(2014).
- Effros, R. B., et al. Aging and infectious diseases: workshop on HIV infection and aging: what is known and future research directions. Clin Infect Dis. 47, 542-553 (2008).
- Marzolini, C., et al. Prevalence of comedications and effect of potential drug-drug interactions in the Swiss HIV Cohort Study. Antivir Ther. 15, 413-423 (2010).
- Smyth, K., et al. Prevalence of and risk factors for HIV-associated neuropathy in Melbourne, Australia. HIV Med. 8, 367-373 (2007).
- Cohen, R. A., Seider, T. R., Navia, B. HIV effects on age-associated neurocognitive dysfunction: premature cognitive aging or neurodegenerative disease. Alzheimers Res Ther. 7, 37(2015).
- Gale, J. Physiotherapy intervention in two people with HIV or AIDS-related peripheral neuropathy. Physiother Res Int. 8, 200-209 (2003).
- Harris-Love, M. O., Shrader, J. A. Physiotherapy management of patients with HIV-associated Kaposi's sarcoma. Physiother Res Int. 9, 174-181 (2004).
- Pullen, S. D., Chigbo, N. N., Nwigwe, E. C., Chukwuka, C. J., Amah, C. C., Idu, S. C. Physiotherapy intervention as a complementary treatment for people living with HIV/AIDS. HIV AIDS (Auckl). 6, 99-107 (2014).
- Cruz-Ferreira, A., et al. Effects of Pilates-based exercise on life satisfaction, physical self-concept and health status in adult women. Women Health. 51, 240-255 (2011).
- Gomes, R. D., Borges, J. P., Lima, D. B., Farinatti Lima, P. T. Effects of physical exercise in the perception of life satisfaction and immunological function in HIV-infected patients: Non-randomized clinical trial. Rev Bras Fisioter. 14, 390-395 (2010).
- Farinatti, P. T., Borges, J. P., Gomes, R. D., Lima, D., Fleck, S. J. Effects of a supervised exercise program on the physical fitness and immunological function of HIV-infected patients. J Sports Med Phys Fitness. 50, 511-518 (2010).
- Gutierrez, E. M., Helber, M. D., Dealva, D., Ashton-Miller, J. A., Richardson, J. K. Mild diabetic neuropathy affects ankle motor function. Clin Biomech. 16, 522-528 (2001).
- Simoneau, G. G., Derr, J. A., Ulbrecht, J. S., Becker, M. B., Cavanagh, P. R. Diabetic sensory neuropathy effect on ankle joint movement perception. Arch Phys Med Rehab. 77, 453-460 (1996).
- Ene, L., Goetghebuer, T., Hainaut, M., Peltier, A., Toppet, V., Levy, J. Prevalence of lipodystrophy in HIV-infected children: a cross-sectional study. Eur J Pediatr. 166, 13-21 (2007).
- Agmon, M., Perry, C. K., Phelan, E., Demiris, G., Nguyen, H. Q. A pilot study of Wii Fit exergames to improve balance in older adults. J Geriatr Phys Ther. 34, 161-167 (2011).
- Tanaka, K., Parker, J., Baradoy, G., Holash Sheehan,, Katz, J. R., L, A comparison of exergaming interfaces for use in rehabilitation programs and research. Loading. 6, (2012).
- Grewal, G. S., et al. Sensor-Based Interactive Balance Training with Visual Joint Movement Feedback for Improving Postural Stability in Diabetics with Peripheral Neuropathy: A Randomized Controlled Trial. Gerontol. 61, 567-574 (2015).
- Bisson, E., Contant, B., Sveistrup, H., Lajoie, Y. Functional balance and dual-task reaction times in older adults are improved by virtual reality and biofeedback training. Cyberpsychol Behav. 10, 16-23 (2007).
- Cross, E. S., Kraemer, D. J., Hamilton, A. F. dC., Kelley, W. M., Grafton, S. T. Sensitivity of the action observation network to physical and observational learning. Cereb Cortex. 19, 315-326 (2009).
- Radloff, L. The CES_D Scale: A self report depression scale for research in the general population. Appl Psychol Measurement. 1, 385-401 (1977).
- Fried, L. P., et al. Frailty in older adults: evidence for a phenotype. J Gerontol A Biol Sci Med Sc. 56, M146-M156 (2001).
- Rees, H. C., et al. Measuring frailty in HIV-infected individuals. Identification of frail patients is the first step to amelioration and reversal of frailty. J Vis Exp. , (2013).
- Kempen, G. I., et al. The Short FES-I: a shortened version of the falls efficacy scale-international to assess fear of falling. Age Ageing. 37, 45-50 (2008).
- Gandek, B., et al. Cross-validation of item selection and scoring for the SF-12 Health Survey in nine countries: results from the IQOLA Project. International Quality of Life Assessment. J Clin Epidemiol. 51, 1171-1178 (1998).
- Avlund, K., Vass, M., Hendriksen, C. Onset of mobility disability among community-dwelling old men and women. The role of tiredness in daily activities. Age and Ageing. 32, 579-584 (2003).
- Najafi, B., Horn, D., Marclay, S., Crews, R. T., Wu, S., Wrobel, J. S. Assessing postural control and postural control strategy in diabetes patients using innovative and wearable technology. J Diabetes Sci and Technol. 4, 780-791 (2010).
- Favre, J., Jolles, B., Aissaoui, R., Aminian, K. Ambulatory measurement of 3D knee joint angle. Journal of biomechanics. 41, 1029-1035 (2008).
- Najafi, B., Lee-Eng, J., Wrobel, J. S., Goebel, R. Estimation of center of mass trajectory using wearable sensors during golf swing. J Sports Sci Med. 14, 354-363 (2015).
- Najafi, B., Horn, D., Marclay, S., Crews, R. T., Wu, S., Wrobel, J. S. Assessing postural control and postural control strategy in diabetes patients using innovative and wearable technology. J Diabetes Sci Technol. 4, 780-791 (2010).
- Najafi, B., Helbostad, J. L., Moe-Nilssen, R., Zijlstra, W., Aminian, K. Does walking strategy in older people change as a function of walking distance. Gait Posture. 29, 261-266 (2009).
- Najafi, B., Aminian, K., Loew, F., Blanc, Y., Robert, P. A. Measurement of stand-sit and sit-stand transitions using a miniature gyroscope and its application in fall risk evaluation in the elderly. IEEE Trans Biomed Eng. 49, 843-851 (2002).
- Najafi, B., Aminian, K., Paraschiv-Ionescu, A., Loew, F., Bula, C. J., Robert, P. Ambulatory system for human motion analysis using a kinematic sensor: monitoring of daily physical activity in the elderly. IEEE Trans Biomed Eng. 50, 711-723 (2003).
- Schwenk, M., et al. Wearable sensor-based in-home assessment of gait, balance, and physical activity for discrimination of frailty status: baseline results of the Arizona frailty cohort study. Gerontol. 61, 258-267 (2015).
- Schwenk, G. S., et al. Interactive balance training integrating sensor-based visual feedback of movement performance: a pilot study in older adults. J Neuroeng Rehabil. 11, 164(2014).
- Shabbott, B. A., Sainburg, R. L. Learning a visuomotor rotation: simultaneous visual and proprioceptive information is crucial for visuomotor remapping. Exp Brain Res. 203, 75-87 (2010).
- Chao, Y. -Y., Scherer, Y., Montgomery, C. Effects of using Nintendo Wii Exergames in older adults: a review of the literature. J Aging and Health. 27, 379-402 (2015).
- Rendon, A., Lohman, E., Thorpe, D., Johnson, E., Medina, E., Bradley, B. The effect of virtual reality gaming on dynamic balance in older adults. Age and Aging. 41, 549-552 (2012).
- Mammen, G., Faulkner, G. Physical activity and the prevention of depression. A systematic review of prospective studies. Am J Prev Med. 45, 649-657 (2013).
- Krogh, J., Nordentoft, M., Sterne, J., Lawlor, D. The effect of exercise in clinically depressed adults: systematic review and meta-analysis of randomized controlled trials. J Clin Psychiatry. 36, 529-538 (2011).
Reprints and Permissions
