Zebrafish are an excellent model to study muscle function and disease. During early embryogenesis zebrafish begin regular muscle contractions producing rhythmic swimming behavior, which is altered when the muscle is disrupted. Here we describe a touch-evoked response and locomotion assay to examine swimming performance as a measure of muscle function.
Method Article
Using Touch-evoked Response and Locomotion Assays to Assess Muscle Performance and Function in Zebrafish
* These authors contributed equally
In This Article
Summary
Abstract
Zebrafish muscle development is highly conserved with mammalian systems making them an excellent model to study muscle function and disease. Many myopathies affecting skeletal muscle function can be quickly and easily assessed in zebrafish over the first few days of embryogenesis. By 24 hr post-fertilization (hpf), wildtype zebrafish spontaneously contract their tail muscles and by 48 hpf, zebrafish exhibit controlled swimming behaviors. Reduction in the frequency of, or other alterations in, these movements may indicate a skeletal muscle dysfunction. To analyze swimming behavior and assess muscle performance in early zebrafish development, we utilize both touch-evoked escape response and locomotion assays.
Touch-evoked escape response assays can be used to assess muscle performance during short burst movements resulting from contraction of fast-twitch muscle fibers. In response to an external stimulus, which in this case is a tap on the head, wildtype zebrafish at 2 days post-fertilization (dpf) typically exhibit a powerful burst swim, accompanied by sharp turns. Our method quantifies skeletal muscle function by measuring the maximum acceleration during a burst swimming motion, the acceleration being directly proportional to the force produced by muscle contraction.
In contrast, locomotion assays during early zebrafish larval development are used to assess muscle performance during sustained periods of muscle activity. Using a tracking system to monitor swimming behavior, we obtain an automated calculation of the frequency of activity and distance in 6-day old zebrafish, reflective of their skeletal muscle function. Measurements of swimming performance are valuable for phenotypic assessment of disease models and high-throughput screening of mutations or chemical treatments affecting skeletal muscle function.
Introduction
Over the past decade zebrafish have been increasingly used to study muscle cell biology and disease. The rapid external development of the zebrafish embryo, coupled with its optical clarity, allows the direct visualization of muscle formation, growth, and function. The process of muscle development is highly conserved in zebrafish and this has allowed the successful modeling of a range of muscle diseases including muscular dystrophies and congenital myopathies1-8. Detailed examination of zebrafish models has not only provided novel insights into the pathobiology of these conditions but also provided a platform for the testing of suitable therapies6,9-13.
The analysis of zebrafish models of muscle diseases relies on reliable and reproducible assays to measure muscle performance. Previous studies have successfully measured the force generating capability of the zebrafish trunk muscle in fish between 3 and 7 dpf by electrically stimulating contraction of an immobilized fish attached to a force transduction system14. This can provide detailed measurements of force but are not ideally suited to higher throughput experiments and there are advantages to measuring muscle performance during swimming. At 2 dpf zebrafish muscle is fully functional and the fish can elicit burst swimming movements in response to stimuli. The touch-evoke escape response assay is used to measure acceleration during a burst swimming motion, which can be used as a measure of contractile force.
One of the most utilized measures of muscle function in myopathy patients is the 6 min walk test, which records the total distance walked on a hard flat surface15,16. We have applied a comparable test to measure muscle function in 6 dpf zebrafish larvae, whereby we monitor the total distance swum, and the total number of movements made by each larva over a 10 min period. This is performed using an automated tracking system, which provides reliable and high-throughput measurements of muscle performance. Both muscle tests are highly reproducible and have been used to quantify differences in muscle performance in zebrafish myopathy models8.
Protocol
1. Touch-evoked Response Assay
- Preparation of 2 dpf Embryos for Touch-evoked Response Assay
- Ensure that the time of day at which the test is conducted is consistent between experiments because activity can vary dramatically throughout the day17,18.
NOTE: The experiment should be performed blinded and the order of testing randomized to minimize experimental artifacts. - Assign the fish strains a number, which is unknown to the individual carrying out the experiment. Following this, using freely available online tools generate a random list that dictates the order of testing.
- At least one hour prior to testing, dechorionate embryos by ripping a hole in the chorion and gently pulling the chorion apart using a pair of fine tweezers. Remove any debris from the petri dish before returning to the 28 °C incubator.
- Ensure that the time of day at which the test is conducted is consistent between experiments because activity can vary dramatically throughout the day17,18.
- Performing Touch-evoked Response Assay
- Heat stage to 28 °C at least 15 min prior to starting the testing.
NOTE: This stage is temperature controlled and will remain at 28 °C for the duration of the testing. Temperature will affect activity and it is therefore important to maintain a constant temperature. If a heated stage is not available then the temperature of the water should be monitored and all experiments should be conducted at the same temperature. - Place a petri dish filled with embryo medium (5 mM NaCl, 0.17mM KCl, 0.33 mM CaCl2, 0.33 mM MgSO4 in water) onto an illuminated stage and mount the high-speed camera over the petri dish.
- Launch the video camera recording software (such as Stream Pix 5, described here) and under the "workspace" tab select 1,000 frame per sec (1,000 fps) as the capture speed to ensure that fast swimming action of the fish is recorded.
- Working with one embryo at a time, place the embryo in the middle of the petri dish with the zebrafish clearly visible in the field of view.
NOTE: If the embryo swims away prior to commencement of the experiment replace it with another, as recapturing and positioning of the embryo may result in it becoming desensitized to the stimulus and repeated burst responses may promote muscle weakness in some disease models. - Begin recording by clicking on the "record" button and, deliver the mechanosensory stimulus to the embryo by touching it gently with a blunt needle on the top of the head.
- Stop the recording after the embryo has swum out of the field of view or returned to rest.
NOTE: The acceleration peaks within the first 0.2 sec of the burst escape response following the mechanical stimulus. Therefore, ensure that at least during the first 0.2 sec of the escape response recording the fish is in the field of view. Using the software described in step 1.2.3, the data will automatically be saved as a .avi video file. Alternative video capture software such as Free Video Capture or Softonic, both of which are freely available for download, could also be used. - Return the embryo to a new petri dish and select another embryo for testing. Perform testing on a minimum of 15 fish.
- Heat stage to 28 °C at least 15 min prior to starting the testing.
- Quantification of Swimming Behavior
- To quantify the swimming behavior, launch the software and select the "Single Larvae Locomotion without background subtraction" module to open the saved .avi video file.
- Using the "freehand" or "polygon" tool from the menu bar select areas of the movie to be used for the analysis. Ensure that the region encompasses both the original position of the fish and the area that the fish will swim into. Make sure that the probe is excluded from the area to be analyzed. The software will automatically track the trajectory of the fish within the desired area.
- To perform the analysis, click on "experiment" from the menu bar and select "execute". When prompted save the raw data analysis file (.phr format) in the desired location. Once saved, click on "start" to begin the analysis. End the analysis by clicking on "stop" under the "experiment" drop down menu. A window containing the results will be displayed.
- Scroll to the right to obtain the "maximum acceleration" value. If desired, export this data by closing the results window and clicking on the "export instantaneous results" button under the "results" drop down menu. Select the appropriate raw data analysis file and click on open. A text file that can be opened in a spreadsheet program will be saved in the destination folder.
- Repeat this process for each individual fish and average to obtain the mean maximum acceleration for each strain (see Figure 1).
NOTE: As an alternative to using the software described here, similar packages such as the freely available ImageJ software can be used to extract the relevant movement data. The 3D Particle Tracker plugin can be used to track swimming trajectories.
2. Locomotion Assay — 10-min Swim Test
- Preparation of 6 dpf Embryos for Swimming Analysis
- If required, sort embryos for the required genotype, for example by examining expression of a fluorescent protein or by phenotype, and place into a separate petri dish (25-30 embryos per dish). Alternatively, the genotype can be determined following completion of the locomotion assay.
- At 3 dpf, re-examine petri dishes and remove any unhatched embryos and debris. Return petri dishes to 28 °C incubator until 6 dpf.
- Perform testing of all strains between 9 am and 12 pm, which is the time at which zebrafish larvae are most active. Randomize the order of testing and position in the plate of wildtype and mutant samples to minimize the effects of circadian differences and other experimental bias.
NOTE: It is important that the testing time is consistent between experiments because activity can vary dramatically throughout the day. - At least 30 min prior to testing, place larvae into a 48-well plate with one larva per well. After transfer, fill the wells so that the water surface is just below the top of the well, ensuring there are no bubbles. Return plates to 28 °C incubator.
- Take plates out of the incubator and acclimatize in the light for five minutes prior to testing.
- Performing Locomotion Assay
- Place the 48-well plate into the recording chamber, which is equipped with an infrared digital camera, capturing up to 60 frames/sec, so that larvae can be detected in the dark. Check that all of the wells are placed inside the circular grid on the locomotion software and that all larvae are clearly detectable.
- Launch the software and select the “tracking” module. Under “file” click on “generate new protocol” and edit the number of wells used for the experiment. Set both the experiment duration and the integration period to 10 min by clicking on the "parameters" drop down menu and selecting the "protocol parameters" and subsequently the "time" tab. On the same "protocol parameters" dialogue box click on the "options" tab and ensure the "Numeriscope" checkbox is clicked following which, the "protocol parameters" dialogue box can be closed.
- To set the recording areas highlight the entire grid and double click on one of the wells. Click on the “draw areas” button and draw around the top left, top right, and bottom left wells and click “build”, which allows the software to automatically determine the position of each well. Also draw in a scale bar and click on “apply to group”. Once completed, click on the “draw areas” button.
- Visually determine the detection threshold by sliding the "detection threshold" bar to a level at which only the fish movements are highlighted with no background signals.
NOTE: The detection threshold will vary between strains and thus the thresholds have to be determined whenever a new strain is tested. In the representative data presented a detection threshold of 25 mm/sec was used. - Before commencing testing enter movement thresholds for detection of inactivity, and small and large movements.
NOTE: In the representative data presented an inactivity threshold of 6 mm/sec and an activity burst threshold of 30 mm/sec was used. The thresholds determine the minimum movement to be considered active and the level required to be considered burst activity and allow classification of activity into small (active but below burst activity thresholds) and large (greater than the burst activity threshold) movements. The thresholds can be altered depending on the activity of the particular fish strains analyzed.
NOTE: Although the assay can be performed in either light or dark conditions, zebrafish larvae have been shown to be more active in the dark18. - Set the light intensity inside the chamber to be at 0% by clicking on the "light driving settings" button under the "parameters" drop down menu. On the resulting dialogue box, add the required light settings.
NOTE: The light intensity inside the chamber can be triggered to turn on and off during the testing time to stimulate larval activity - Close the door of the recording chamber and start video recording.
- Quantification of Swimming Behavior
- After the experiment is complete, click on "stop" under the "experiment" drop down menu. A dialogue box with all the results will be displayed.
- To access these results in excel click on "open containing folder" and open the excel file that appears in the resulting folder. The important parameters are "smlct" (small movement count), "larct" (large movement count), "smldist" (total distance covered by the fish in small movements) and "lardist" (total distance covered by the fish in large movements).
NOTE: Following the recording, the software also returns two additional output files in the form of an .avi file (containing a video of the 10 min recording) and a .png image file (containing a visual representation of the locomotion during the 10-min experiment; see Figure 2). - Once the locomotion values are calculated, replay the .avi and .png files to review whether the locomotion values calculated accurately depict the swimming movements of the fish (see Figure 3).
NOTE: As an alternative to using the software described here, packages such as the freely available ImageJ software can be used to track the locomotory behavior.
Results
Touch evoked response assay can be used to determine the speed and acceleration of swimming movements which is a proportional measure of muscle force. In response to a mechanical stimulus, such as a small tap on the head 2 dpf wild type zebrafish exhibit a fast swimming action. Videos were captured and analyzed for two different zebrafish myopathy models: Tg(ACTA1D286G-eGFP), a model of nemaline myopathy that has been shown to have significant muscle weakness, and a model of Duchenne muscular dystrophy in which severe muscle defects have been described at 5 dpf19,20. Images from a video of a typical touch evoked assay are represented in Figure 1A. Acceleration of the zebrafish was examined and found to peak within the first 0.2 sec of the burst swimming escape response (Figure 1B). This peak maximum acceleration provides a measure that is proportional to the force generating capacity of the skeletal muscle. The maximum acceleration values were averaged to obtain a mean maximum acceleration value (± standard error of the mean) for each strain: Tg(ACTA1D286G-eGFP): mean = 276.0 ± 28.8 m/sec2, n = 3 independent replicate experiments comprising 15 individual fish; wildtype control: mean = 500.8 ± 50.28 m/sec2, n = 3 independent replicate experiments comprising 15 individual fish; dmdpc2-/- mutant: mean = 249.9 ± 19.1 m/sec2, n=3 independent replicate experiments comprising 12-19 individual fish; dmdpc2+/- heterozygotes: mean = 235.9 ± 8.7 m/sec2, n = 3 independent replicate experiments comprising 16-27 individual fish; dmdpc2+/+ wildtype homozygotes: mean = 230.9 ± 8.7 m/sec2, n = 3 independent replicate experiments comprising 8-27 individual fish (Figure 1C). As expected, the Tg(ACTA1D286G-eGFP) fish were found to have a significant decrease in maximum acceleration indicating reduced muscle function, which is consistent with mouse models and patient data8,21,22. The dmdpc2-/- mutant fish however, showed no difference in maximum acceleration, at 2 dpf, consistent with the detection of muscle defects from 3 dpf20 (Figure 1D).
Locomotion assays were performed at 6 dpf to determine the activity and distance swum by zebrafish strains as an indication of muscle performance. Following testing, a diagrammatic representation of the swimming movements over the ten-minute testing period was generated, with red and green lines representing periods of slow and fast movement respectively and black lines representing periods of inactivity (Figure 2). Individual wildtype zebrafish show high activity with relatively no periods of inactivity as opposed to Tg(ACTA1D286G-eGFP) fish, which are less active over the testing period (Figure 2B).
The swimming behavior was quantified by averaging the individual values of the number of movements and the distance swum by each fish (Figure 3). Both, Tg(ACTA1D286G-eGFP) fish (Figure 3A and 3B) and dmdpc2-/- mutant fish (Figure 3C and 3D) were found to have a significant decrease in the mean number of movements and distance swum compared to their respective controls: Tg(ACTA1D286G-eGFP) fish: mean number of movements = 94.3 ± 13.6, mean distance swum = 112.9 ± 18.4 mm, n = 3 independent replicate experiments comprising 45 fish; wild type controls: mean number of movements = 177.4 ± 14.0, mean distance swum = 300.2 ± 22.8 mm, n = 3 independent replicate experiments comprising 45 fish; dmdpc2-/- mutant: mean number of movements = 163.3 ± 30.0, mean distance swum: 298.4 ± 60.37 mm, n = 3 independent replicate experiments comprising 12-20 fish; dmdpc2+/- heterozygotes: mean number of movements = 362.3 ± 38.8, mean distance swum: 660.3 ± 86.1mm n = 3 independent replicate experiments comprising 17-27 fish; dmdpc2+/+ wildtype homozygotes: mean number of movements = 341.9 ± 91.6, mean distance swum = 574.3 ± 170.9mm n = 3 independent replicate experiments comprising 8-25 fish.
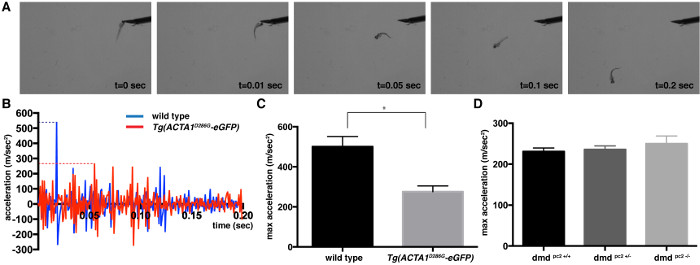
Figure 1: Quantification of touch-evoke response assay for 2 dpf zebrafish embryos. (A) Snapshot images of a control zebrafish during touch-evoke assays at 2 dpf. (B) Acceleration profile for the first 0.2 sec of a single Tg(ACTA1D286G-eGFP) (red) and single control (blue) zebrafish following application of the touch stimulus. The maximum acceleration is represented by the dotted lines. (C, D) Quantification of the maximum acceleration (m/sec2) recorded from touch-evoked response assays of (C) Tg(ACTA1D286G-eGFP) zebrafish and (D) dmdpc2-/- mutant fish compared to control zebrafish at 2 dpf. Error bars represent ± SEM for 3 replicate experiments, *p <0.05. Please click here to view a larger version of this figure.
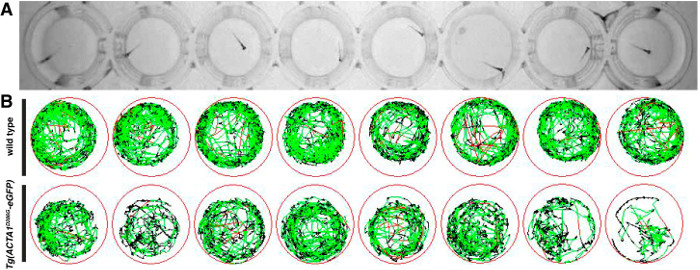
Figure 2: Representation of locomotion assays for zebrafish embryos. (A) Zebrafish embryos are placed in 48-well plates and locomotion is recorded from above using an infrared digital camera. (B) Schematic of zebrafish movement during the testing period with red lines depicting fast movements, green lines depicting slow movements and black lines depicting inactivity (as determined by the detection thresholds entered in the software). Please click here to view a larger version of this figure.

Figure 3: Quantification of locomotion assays for 6 dpf zebrafish larvae. Quantification of the (A) number of movements and (B) distance travelled by Tg(ACTA1D286G-eGFP) zebrafish compared to control zebrafish at 6 dpf. Quantification of the (C) number of movements and (D) distance travelled by dmdpc2-/- mutant fish compared to control zebrafish at 6 dpf. Error bars represent ± SEM for 3 replicate experiments, *p <0.05, **p <0.01. Please click here to view a larger version of this figure.
Discussion
Many different animal models including mice, dogs, zebrafish, flies and worms have contributed towards our understanding of the genetic and molecular basis of muscle diseases, and assisted in the development of therapeutic approaches to combat them. The zebrafish boasts several advantages for the study of muscle disease. The zebrafish provides a genetically manipulable system to assess complex muscle patterning in a suitable physiological environment, which is not possible in in vitro culture systems. Unlike other vertebrate animal models, the large number of fish produced, together with its optical clarity, facilitates rapid, high-throughput in vivo chemical and genetic screening.
Here we describe the development of zebrafish movement assays to provide a high-throughput and automated method to assess muscle performance during zebrafish embryogenesis. For both assays it must be acknowledged that circadian rhythms and external environmental stimuli will significantly affect zebrafish swimming behavior17,18. Repeated testing of the same zebrafish will also lead to habituation causing a decrease in response to the tactile stimulus23. Therefore, in order to achieve reproducible results between experiments each zebrafish embryo should only be tested once, the time of the day and lighting conditions should be standardized, and water temperature needs to be tightly regulated.
Using the touch evoked analysis at 2 dpf we can directly measure the maximum acceleration of a burst swimming action, which is proportional to muscle force. Previous techniques in zebrafish have examined muscle force by tying both ends of the embryos to experimental equipment following which muscle contraction is stimulated using an electric field and the force-generating capability of the muscle14 is measured. Whilst this method measures the force generating capacity of the larval muscle, it does not measure the actual force generated by the larval muscle during swimming. We therefore developed a method to indirectly assess the force generated during the normal larval swimming motion to provide an overall measure of muscle health. The high-speed video system, capable of recording individual zebrafish movements at a frame rate of 1,000 frames/sec can be used to identify small but significant differences in muscle function, which are not directly distinguishable by eye. It will be of interest to see how previously reported changes in electrically stimulated force-generation correlate with changes in swimming performance.
In addition the touch evoked response assays can also be used to assess swimming kinematics, such as the shape and speed of the body wave during the swimming motion24, to give a quantitative measurement of the locomotory behavior.
Due to the spontaneous movement of zebrafish larvae after 3 dpf, we were not able to perform the touch-evoke assays to measure muscle function. Conversely, we measured muscle performance over a longer period by determining the distance swum by zebrafish larvae at 6 dpf. This test, although an indirect measure of muscle function, can be used to identify fish displaying impaired muscle performance8 or neurodegeneration25,26. This test not only provides a measurement analogous to the 6 min walk test but is also suitable for automated high-throughput in vivo drug or mutagenesis screens.
Disclosures
The authors have nothing to disclose.
Acknowledgements
We thank Viewpoint for their kind sponsorship of this manuscript. This work was funded by an Australian National Health and Medical Research Council (NHMRC) Project Grant (APP1010110).
Materials
| Name | Company | Catalog Number | Comments |
|---|---|---|---|
| 21 G x 1' Blunt Needle | Terumo/Admiral Medical Supplies | TE2125 | |
| 48-well plates | Sigma | M8937 | |
| 90 mm Petri Dishes | Pacific Laboratory Products PT | S90001 | |
| High Speed Camera | Baumer | HXC20 | |
| http://www.randomization.com | N/A | Steps 1.1.2, 2.1.3 | |
| Incubator | Thermoline Scientific | TEI-43L | |
| Plastic Pipette | VWR | 16001-188 | |
| StreamPix5 | NorPix | Step 1.2.3 | |
| Temperature Control Unit | Viewpoint | ||
| Tweezers, style 8 | ProSciTech | T04-821 | |
| Zebrabox System | Viewpoint | ||
| Zebralab | Viewpoint | Steps 1.3.1, 2.2.1 |
References
- Bassett, D. I., Bryson-Richardson, R. J., Daggett, D. F., Gautier, P., Keenan, D. G., Currie, P. D. Dystrophin is required for the formation of stable muscle attachments in the zebrafish embryo. Development. 130 (23), 5851-5860 (2003).
- Gupta, V. A., Kawahara, G., et al. A splice site mutation in laminin-α2 results in a severe muscular dystrophy and growth abnormalities in zebrafish. PLoS ONE. 7 (8), e43794(2012).
- Gupta, V., Kawahara, G., et al. The zebrafish dag1 mutant: a novel genetic model for dystroglycanopathies. Hum Mol Genet. 20 (9), 1712-1725 (2011).
- Kawahara, G., Karpf, J. A., Myers, J. A., Alexander, M. S., Guyon, J. R., Kunkel, L. M. Drug screening in a zebrafish model of Duchenne muscular dystrophy. Proc Natl Acad Sci. 108 (13), 5331-5336 (2011).
- Telfer, W. R., Nelson, D. D., Waugh, T., Brooks, S. V., Dowling, J. J. neb: a zebrafish model of nemaline myopathy due to nebulin mutation. Dis Model & Mech. 5 (3), 389-396 (2012).
- Ruparelia, A. A., Oorschot, V., Vaz, R., Ramm, G., Bryson-Richardson, R. J. Zebrafish models of BAG3 myofibrillar myopathy suggest a toxic gain of function leading to BAG3 insufficiency. Acta Neuropathol. 128 (6), 821-833 (2014).
- Sztal, T. E., Sonntag, C., Hall, T. E., Currie, P. D. Epistatic dissection of laminin-receptor interactions in dystrophic zebrafish muscle. Hum Mol Genet. 21 (21), 4718-4731 (2012).
- Sztal, T. E., Zhao, M., et al. Zebrafish models for nemaline myopathy reveal a spectrum of nemaline bodies contributing to reduced muscle function. Acta Neuropathol. 130 (3), 389-406 (2015).
- Pichler, F. B., Laurenson, S., Williams, L. C., Dodd, A., Copp, B. R., Love, D. R. Chemical discovery and global gene expression analysis in zebrafish. Nat Biotechnol. 21 (8), 879-883 (2003).
- Peterson, R. T., Shaw, S. Y., et al. Chemical suppression of a genetic mutation in a zebrafish model of aortic coarctation. Nat Biotechnol. 22 (5), 595-599 (2004).
- Kawahara, G., Serafini, P. R., Myers, J. A., Alexander, M. S., Kunkel, L. M. Characterization of zebrafish dysferlin by morpholino knockdown. Biochem Bioph Res Co. 413 (2), 358-363 (2011).
- Zon, L. I., Peterson, R. T. In vivo drug discovery in the zebrafish. Nat Rev Drug Discov. , (2005).
- Smith, L. L., Beggs, A. H., Gupta, V. A. Analysis of skeletal muscle defects in larval zebrafish by birefringence and touch-evoke escape response assays. J Vis Exp. (82), e50925(2013).
- Sloboda, D. D., Claflin, D. R., Dowling, J. J., Brooks, S. V. Force measurement during contraction to assess muscle function in zebrafish larvae. J Vis Exp. (77), (2013).
- McDonald, C. M., Henricson, E. K., et al. The 6-minute walk test as a new outcome measure in Duchenne muscular dystrophy. Muscle Nerve. 41 (4), 500-510 (2010).
- McDonald, C. M., Henricson, E. K., et al. The 6-minute walk test and other clinical endpoints in duchenne muscular dystrophy: reliability, concurrent validity, and minimal clinically important differences from a multicenter study. Muscle Nerve. 48 (3), 357-368 (2013).
- Hurd, M. W., Debruyne, J., Straume, M., Cahill, G. M. Circadian rhythms of locomotor activity in zebrafish. Physiol Behav. 65 (3), 465-472 (1998).
- MacPhail, R. C., Brooks, J., Hunter, D. L., Padnos, B., Irons, T. D., Padilla, S. Locomotion in larval zebrafish: Influence of time of day, lighting and ethanol. Neurotoxicology. 30 (1), 52-58 (2009).
- Berger, J., Berger, S., Jacoby, A. S., Wilton, S. D., Currie, P. D. Evaluation of exon-skipping strategies for Duchenne muscular dystrophy utilizing dystrophin-deficient zebrafish. J Cell Mol Med. 15 (12), 2643-2651 (2011).
- Berger, J., Sztal, T., Currie, P. D. Quantification of birefringence readily measures the level of muscle damage in zebrafish. Biochem Bioph Res Co. 423 (4), 785-788 (2012).
- Ravenscroft, G., Jackaman, C., et al. Mouse models of dominant ACTA1 disease recapitulate human disease and provide insight into therapies. Brain. 134 (4), 1101-1115 (2011).
- Ravenscroft, G., Wilmshurst, J. M., et al. A novel ACTA1 mutation resulting in a severe congenital myopathy with nemaline bodies, intranuclear rods and type I fibre predominance. Neuromuscular Disord. 21 (1), 31-36 (2011).
- Wolman, M. A., Jain, R. A., Liss, L., Granato, M. Chemical modulation of memory formation in larval zebrafish. Proc Natl Acad Sci. 108 (37), 15468-15473 (2011).
- Müller, U. K., van Leeuwen, J. L. Swimming of larval zebrafish: ontogeny of body waves and implications for locomotory development. J Exp Biol. 207 (Pt 5), 853-868 (2004).
- Cheng, W., Tian, J., Burgunder, J. M., Hunziker, W., Eng, H. L. Myotonia congenita-associated mutations in chloride channel-1 affect zebrafish body wave swimming kinematics. PLoS ONE. 9 (8), e103445(2014).
- Moggio, M., Colombo, I., et al. Mitochondrial disease heterogeneity: a prognostic challenge. Acta Myol. 33 (2), 86-93 (2014).
Reprints and Permissions
