We describe procedures for the preparation and delivery of membrane protein microcrystals in lipidic cubic phase for serial crystallography at X-ray free-electron lasers and synchrotron sources. These protocols can also be applied for incorporation and delivery of soluble protein microcrystals, leading to substantially reduced sample consumption compared to liquid injection.
Method Article
Preparation and Delivery of Protein Microcrystals in Lipidic Cubic Phase for Serial Femtosecond Crystallography
In This Article
Summary
Abstract
Membrane proteins (MPs) are essential components of cellular membranes and primary drug targets. Rational drug design relies on precise structural information, typically obtained by crystallography; however MPs are difficult to crystallize. Recent progress in MP structural determination has benefited greatly from the development of lipidic cubic phase (LCP) crystallization methods, which typically yield well-diffracting, but often small crystals that suffer from radiation damage during traditional crystallographic data collection at synchrotron sources. The development of new-generation X-ray free-electron laser (XFEL) sources that produce extremely bright femtosecond pulses has enabled room temperature data collection from microcrystals with no or negligible radiation damage. Our recent efforts in combining LCP technology with serial femtosecond crystallography (LCP-SFX) have resulted in high-resolution structures of several human G protein-coupled receptors, which represent a notoriously difficult target for structure determination. In the LCP-SFX technique, LCP is recruited as a matrix for both growth and delivery of MP microcrystals to the intersection of the injector stream with an XFEL beam for crystallographic data collection. It has been demonstrated that LCP-SFX can substantially improve the diffraction resolution when only sub-10 µm crystals are available, or when the use of smaller crystals at room temperature can overcome various problems associated with larger cryocooled crystals, such as accumulation of defects, high mosaicity and cryocooling artifacts. Future advancements in X-ray sources and detector technologies should make serial crystallography highly attractive and practicable for implementation not only at XFELs, but also at more accessible synchrotron beamlines. Here we present detailed visual protocols for the preparation, characterization and delivery of microcrystals in LCP for serial crystallography experiments. These protocols include methods for conducting crystallization experiments in syringes, detecting and characterizing the crystal samples, optimizing crystal density, loading microcrystal laden LCP into the injector device and delivering the sample to the beam for data collection.
Introduction
X-ray crystallography is the most successful technique to date for solving atomic-resolution structures of membrane proteins (MPs). Crystallization from lipidic mesophases, also known as lipidic cubic phase (LCP), or in meso crystallization, represents one of the major developments in MP crystallography that has enabled the high-resolution structure determination of challenging targets such as G protein-coupled receptors (GPCRs)1. Recent advancements in LCP tools and technologies have made this technique available to a large community of structural biologists around the world2. However, in many cases the MP crystals that form in LCP are too small to be used even at most advanced microfocus synchrotron beamlines, where the samples suffer from severe radiation damage and deterioration before sufficient signal at high resolution can be obtained3.
A new approach to crystallographic data collection was enabled with the commissioning of the first X-ray free-electron laser (XFEL). The method is based on the principle of "diffraction before destruction", first introduced theoretically4 and then confirmed experimentally on biological samples at the Linac Coherent Light Source (LCLS)3, the world's pioneer in hard XFELs. An XFEL generates high-brightness X-ray pulses within few tens of femtosecond duration that diffract from a pristine crystal before the protein atoms can move in response to radiation damage. In the initial experiments, microcrystals were continuously supplied to the intersection with the XFEL beam in an aqueous stream produced by a liquid injector5. This experimental setup is known as serial femtosecond crystallography (SFX). The main drawback to using liquid injectors for SFX is their high flow rate, which consequently requires tens to hundreds of milligrams of purified protein for collection of a complete dataset. By employing a special injector that can handle the gel-like LCP samples (LCP microextrusion injector)6, we successfully delivered microcrystals of several different human GPCRs grown in an LCP matrix and obtained their high-resolution structures6-9, with a significantly reduced protein consumption to under 0.3 mg per dataset. The injector consists of a reservoir that can hold up to 20, 40 or 100 µl of crystal-laden LCP and a narrow capillary (10-50 µm in diameter) through which the sample is extruded by application of a high pressure (up to 10,000 psi) from a hydraulic plunger with a pressure amplified stage, driven by a liquid from an HPLC (high-performance liquid chromatography) pump. The stream of LCP exiting the capillary nozzle is stabilized by a parallel flow of nonreactive gas (typically helium or nitrogen).
Here we provide visual demonstrations of the steps required to prepare and characterize samples for an LCP-SFX experiment. Additional details can be found in the published protocols10. As an example, we will use adenosine A2A receptor11 and prepare crystals of this protein in LCP for the X-ray data collection using SFX approach. While our protocols are compatible with any injector capable of streaming LCP for data collection by serial crystallography at XFEL and synchrotron sources, for illustration purposes, we will use the LCP injector described in Ref. 6. Optimized precipitant conditions that produce high-density microcrystals in LCP should be identified by high-throughput crystallization screening12,13 before proceeding to this protocol. A typical flowchart for this protocol is shown in Figure 1.
Protocol
1. Filtering Solutions and Lipids
Note: All reagents and tools used in this protocol should be as clean as possible to avoid the introduction of particulate contaminants in the samples, which can clog the LCP injector.
- Filter all precipitant solutions and molten lipids through 5 µm spin-down filters. Clean syringes thoroughly and apply compressed air to dry. Optionally, use a portable clean-room hood to prevent trapping dust particles or fibers during sample preparation procedures.
2. Reconstitution of MP in LCP
Note: The choice of the best LCP host lipid for crystallization depends on the target MP, and is typically identified during host lipid screening crystallization trials14. Monoacylglycerols (MAGs) represent the most common class of lipids used for LCP crystallization15. The protocols are based on using 9.9 MAG (monoolein) as the host lipid, since this is the most successful lipid for in meso crystallization to date16. 9.9 MAG can be substituted by other LCP host lipids or lipid mixtures after taking into account differences in their phase behavior. For instance, in the case of GPCRs, monoolein is typically doped with cholesterol for receptor stabilization. Here, use 9:1 (w/w) 9.9 MAG:cholesterol mixture as the host lipid.
- Mix target MP, which is purified in detergent micelle solution, with the appropriate LCP host lipid using two syringes (#1 and #2) and a coupler, as described previously13.
- Briefly, load syringe #1 with the molten lipid and syringe #2 with the MP solution. Use a ratio between lipid and aqueous MP solution corresponding to the level that is just below the maximal hydration capacity of the corresponding LCP host lipid, e.g., 3:2 v/v lipid/MP solution for 9.9 MAG, 1:1 v/v lipid/MP solution for most other shorter chain MAGs (7.9 MAG, 9.7 MAG, etc.).
- Connect the syringes through a syringe coupler and start mixing the substances by depressing the plungers to move the mixture back and forth between the syringes, until the sample becomes homogeneous and transparent. Prepare approximately 50 µl of the LCP sample for the collection of a complete dataset by LCP-SFX. The final sample volume will typically increase by approximately a factor of two (to ~100 µl) after sample consolidation and lipid titration (Section 5).
3. Setting up Crystallization in Syringes
- After a transparent and homogeneous LCP is formed, move the entire sample into syringe #2. Detach syringe #1, while keeping the coupler connected to syringe #2.
- Connect a removable needle (gauge 26s) to another 100 µl clean syringe (syringe #3) and aspirate approximately 70 µl of the precipitant solution into it. The composition of the precipitant solution that triggers formation of high-density microcrystals is unique for each target MP and should be determined before proceeding to these protocols. Here, use an optimized precipitant solution composition that yields showers of microcrystals of the A2A receptor (40 mM sodium thiocyanate, 100 mM sodium citrate pH 5, 26-28% PEG400).
- Disconnect the needle from syringe #3 while keeping the Teflon ferrule inside the syringe.
- Connect syringes #2 and #3 through the coupler, making sure that Teflon ferrules are correctly in place in both syringes. Carefully screw the coupler tightly into position.
- Orient the coupled syringes vertically with syringe #2 on the bottom and inject the protein-laden LCP sample from syringe #2 into syringe #3 slowly and steadily until the LCP string touches the plunger of syringe #3. The injected LCP volume will amount to about 1/10 of the initial precipitant volume in syringe #3 (~7 µl). Verify the volume by the scale-reading on both syringes (both plungers should move by about 7 µl).
- Disconnect syringe #2. The coupler now is only connected to syringe #3 that contains the sample immersed in the precipitant solution.
- Use Parafilm to completely seal syringe #3, including the plunger syringe interface, the opening end of the coupler and the needle nut. Incomplete sealing during this step can cause the precipitant conditions to change and the sample to dehydrate.
- Repeat steps 3.3-3.7 to set up crystallization in 6 additional syringes (#4-#9) utilizing a total of ~50 µl of the LCP sample (~7 µl of LCP per each syringe).
- Store sealed syringes in a plastic sealable bag with one or two fiber-free cleaning tissues pre-soaked with water to protect against sample dehydration. Seal the bag and store syringes in a 20 °C incubator during crystal growth.
4. Crystal Detection
- Remove the syringes from the incubator to image the LCP samples directly inside the syringes (#3-#9) every 12-24 hr under a stereomicroscope with cross-polarized light. Identify crystals as tightly packed shiny particles or, in the case of smaller crystal size as a uniform glow from the LCP filament.
- Return the sealed syringes to the bag, and store at 20 °C for future use.
5. Sample Consolidation and Titration with 7.9 MAG
Note: The lipid titration step described here serves two purposes: a) to absorb the excess precipitant solution and b) to prevent lipid freezing upon injection into the XFEL beam. When an LCP sample composed of 9.9 MAG is injected into a vacuum chamber for data collection, intensive evaporation can cool the sample down to temperatures below the equilibrium phase transition temperature (~18 °C), converting parts of the sample into a lamellar crystalline phase (Lc). These patches of Lc phase, when hit by the beam, produce intense powder diffraction rings that can damage a sensitive detector6, such as the Cornell-SLAC pixel array detector (CSPAD). Titration of 9.9 MAG sample with a shorter chain lipid (9.7 MAG or 7.9 MAG) alleviates this problem, as such mixtures have lower phase transition temperatures. Here, we describe titration of a LCP composed of 9.9 MAG with a 7.9 MAG. When shorter chain MAGs (9.7 MAG, 7.9 MAG, etc.) are used for crystallization or when serial crystallography data are collected at ambient pressure the titration in step 5.11 is still required, but it can be performed using the original LCP host lipid employed for crystallization.
- About 1 hr before the beginning of data collection, remove syringes with samples from the 20 °C incubator.
- Select 2-4 syringes for sample consolidation based on a similar crystal appearance and similarity of crystallization conditions.
- Carefully remove the Parafilm sealing from the selected syringes.
- Remove the syringe coupler and attach a clean removable needle (gauge 26s) to the first selected syringe. Gently and slowly push the plunger forward to squeeze the precipitant out through the needle into a microcentrifuge tube. Exercise caution at this step because applying a high pressure on the plunger in this step could eject some of the crystal laden LCP along with the precipitant solution, leading to a partial or complete loss of the sample.
- Stop the plunger when most of the precipitant has been removed and the LCP has accumulated at the needle entrance.
- Repeat step 5.4-5.5 with the other selected syringes.
- To consolidate the resultant LCP samples, connect two syringes together through a clean coupler.
- Depress the plunger on one syringe to transfer the entire sample from one of the syringes to another.
- Disconnect the empty syringe.
- Repeat steps 5.7-5.9 to consolidate all of the crystal laden LCP material from the two to four pre-selected syringes into one syringe. Remove as much precipitant as possible.
- Add ~5 µl of 7.9 MAG or the original shorter-chain MAG host lipid to an empty syringe. Connect this syringe to the syringe with the consolidated sample through a syringe coupler and mix by alternatively depressing syringe plungers. Repeat until all residual solution is absorbed and a homogeneous and transparent LCP is formed. The final amount of LCP after titration can vary from 20 to 35 µl depending on the volume of the excess precipitant and its composition.
- Move the entire mixed LCP sample into one syringe and disconnect the empty syringe.
6. Characterization of Microcrystals
- Attach an LCP-injector loading needle (point style 3, gauge 22, one inch in length) to the syringe with consolidated sample.
- Carefully eject ~1 µl of the LCP sample on a glass slide and cover it with a glass cover slip. Gently press on the cover slip to sandwich the sample.
- Take images of the LCP sample under a stereo microscope at the highest possible magnification (typically 100X) using a bright-field illumination and cross-polarizers. If possible, take additional images using a UV-fluorescence microscope and a SONICC (Second Order Nonlinear Imaging of Chiral Crystals)17 imager to confirm the existence of protein microcrystals in the sample.
- Estimate crystal size and density10. The ideal crystal density for a data collection experiment will depend on the crystal size, the diameter of the X-ray beam and the diameter of the LCP stream, and should result in a crystal hit rate of about 10-40%.
7. Adjustment of Crystal Density
Note: If the crystal density found in Step 6.4 is too high, resulting in a large percentage of multiple crystal hits, the crystals should be diluted following the steps outlined below to optimize the sample for data collection. If the crystal density is too low for efficient data collection in all prepared samples, then the crystal growth conditions should be re-optimized, since there is no reliable method for concentrating MP crystals in LCP.
- Prepare the required amount of neat LCP to be used for dilution by mimicking the LCP composition (same lipid and precipitant) of the original sample with crystals that needs to be diluted.
- Move all neat LCP into one syringe. Detach empty syringe but leave the coupler connected.
- Remove the needle from the syringe that contains the LCP sample with microcrystals. Connect the sample syringe to the syringe containing neat LCP through the coupler.
- Mix the content of the syringes by pushing it back and forth through the coupler until homogeneity is achieved.
- Repeat Section 6 to re-evaluate the microcrystal density in the adjusted sample.
8. LCP Injector Loading and LCP-SFX Data Collection
- Disconnect the coupler from the syringe with the sample and attach a 1" loading needle to the syringe.
- Transfer 20-40 µl of the sample into the reservoir of an LCP injector.
- Insert the LCP injector into the sample chamber18, start the injector, adjust the flow rate and collect LCP-SFX data.
9. Incorporation of Soluble Protein Crystals in LCP
Note: Using highly viscous media, such as LCP, for delivery of crystals of soluble proteins allows one to dramatically decrease protein consumption in a serial crystallography experiment. In these steps we describe how to incorporate crystals of soluble proteins in LCP. Crystals can be obtained by any technique, consolidated together in the form of a crystal suspension and filtered if necessary.
- Adjust crystal density in suspension to ensure crystal hit rates of approximately 10-40%.
- Test the compatibility of the precipitant solution with LCP using 7.9 MAG, 9.7 MAG or a 1:1 mixture of 7.9 MAG and 9.9 MAG as the host lipid.
- Mix ~25 µl of the crystal suspension with ~25 µl of the host lipid using a syringe mixer until a homogeneous LCP forms.
- Evaluate crystal size and density as described in Section 6. Load the sample in the LCP injector and collect data as described in Section 8.
Results
Below we describe representative results obtained with samples prepared by following the above protocols, which allowed us to collect SFX data and solve high-resolution structures of five human GPCRs: serotonin receptor 5-HT2B in complex with an agonist ergotamine8 (PDB ID 4NC3), smoothened receptor (SMO) in complex with an antagonist cyclopamine6 (PDB ID 4O9R), δ-opioid receptor in complex with a bi-functional peptide ligand DIPP-NH27(PDB ID 4RWD), angiotensin receptor in complex with a blocker ZD71559 (PDB ID 4YAY), and a complex between rhodopsin and arrestin19 (PDB ID 4ZWJ); and two test soluble proteins: lysozyme (PDB ID 4ZIX) and phycocyanin (PDB ID 4ZIZ).
5-HT2B mediates various central and peripheral physiologic functions of the neurotransmitter serotonin. This receptor was used to establish and validate the LCP-SFX method, by comparing the room temperature structure obtained at LCLS with the cryocooled structure solved by traditional microcrystallography at the Advanced Photon Source (APS). A total of ~100 µl LCP sample with protein microcrystals (average size about 5 µm) was prepared and used for SFX data collection, and the LCP-SFX structure of 5HT2B was successfully solved at 2.8 Å (Figure 2)8. Additional useful details on sample preparation and data collection are provided in Table 1.
Smoothened receptor (SMO) is a member of class F GPCRs and the molecular target of the teratogen cyclopamine, with well-demonstrated functions in embryonic development and tumor growth. Initially, relatively large crystals of SMO/cyclopamine with an average size of 120×10×5 µm were obtained and then used for data collection at a synchrotron source using conventional goniometer-based crystallography. However, these large crystals produced poor diffraction at a micro-focus beamline (10 µm in diameter) suffering from large mosaicity (above 2-3 degrees), probably due to the accumulation of crystal growth defects, or from effects related to cryocooling. LCP-SFX, however, enabled us to collect quality diffraction data at LCLS from 5 µm-sized crystals at room temperature. The structure was solved by molecular replacement at an anisotropic 3.4, 3.2 and 4.0 Å resolution along the three principal axes, clearly identifying the location of cyclopamine in the binding pocket6 (Figure 3).
Alkaloid opiates, such as morphine, targeting µ-opioid receptor (µ-OR) are widely used for severe pain management. However, their extensive usage leads to acquired tolerance and addiction. Co-administration of morphines with δ-opioid receptor (δ-OR) antagonists has been shown to prevent the abovementioned side effects, thus promoting the search for compounds with a mixed δ-OR-antagonist and µ-OR-agonist function. We obtained the initial diffraction data on δ-OR in a complex with a bi-functional tetra-peptide DIPP-NH2 using cryocooled crystals that diffracted to 3.3 Å at a synchrotron X-ray source employing conventional goniometer-based data collection strategy. These data revealed a partially ambiguous electron density for the peptide ligand. Subsequently, XFEL diffraction data at room temperature were obtained and the structure was determined at 2.7 Å resolution showing a clear density for the ligand and the receptor7. This structure offered an opportunity for further understanding opioid receptor function and selectivity and provided valuable insights for the development of new analgesics.
Angiotensin II type 1 receptor (AT1R) is a GPCR serving as a primary regulator of blood pressure. We crystallized AT1R in complex with an antagonist ZD7155 in LCP. Optimized crystals reached a maximum size of 40×4×4 µm3 with the best diffraction reaching only ~4 Å at a synchrotron source. By changing crystallization conditions, we obtained showers of smaller crystals (10×2×2 µm3), which were used to obtain the room temperature structure at 2.9 Å resolution using XFEL radiation. A total of 2,764,739 detector images were collected to make a complete dataset from about 65 µl of crystal-laden LCP corresponding to about 0.29 mg of protein9. Of the total number of frames, 457,275 were identified as crystal hits, corresponding to a hit rate of 17%, of which 73,130 frames (16% of hits) were successfully indexed and integrated.
GPCRs signal through two main pathways mediated by either G proteins or arrestins. The structure of the β2-adrenergic receptor bound to a heterotrimeric Gs protein was solved a few years ago20, whereas the structure of a GPCR in complex with arrestin had remained elusive. We obtained small crystals of a rhodopsin-arrestin fusion protein in LCP that reached 25-30 µm in the longest dimension, but despite extensive optimization, diffracted only to ~7 Å resolution at synchrotron sources. By using the LCP-SFX method, within 12 hours of XFEL beamtime, we collected 22,262 crystal hits, out of which 18,874 patterns were successfully indexed and integrated to anisotropic resolution limits of 3.8 Å / 3.8 Å / 3.3 Å19. Rhodopsin-arrestin is a very challenging protein complex that resisted structure determination using traditional approaches. The successful determination of this structure has demonstrated the huge potential of the LCP-SFX method for tackling difficult problems and provided a unique opportunity to examine the mechanism of arrestin-biased signaling in GPCRs.
Finally, in addition to membrane protein crystals grown in the lipidic phase, our sample preparation and delivery method was successfully adapted for soluble protein crystals, where LCP is used as a carrier medium for the delivery of crystals, allowing us to dramatically decrease the protein consumption required for structure determination. Structures of two model proteins, lysozyme and phycocyanin, were solved at 1.89 Å and 1.75 Å resolution respectively by this method, using less than 0.1 mg of each protein21.
| Serotonin receptor 2B | Smoothened receptor | δ-Opioid receptor | Angiotensin II receptor type 1 | Rhodopsin-Arrestin | Lysozyme | Phycocyanin | |
| PDB ID | 4NC3 | 4O9R | 4RWD | 4YAY | 4ZWJ | 4ZIX | 4ZIZ |
| Total sample used*, μl | 100 | 83 | 50 | 65 | 75 | 10 | 10 |
| Total protein used, μg | 300 | 500 | 300 | 290 | 340 | 100 | 100 |
| Average crystal size, μm | 5×5×5 | <5 | 5×2×2 | 10×2×2 | 5-10 | 5×2×2 | 10×10×5 |
| Hit rate, % | 3.6 | 7.8 | 5.9 | 17 | 0.45 | 40 | 6.5 |
| Total data collection time, hr | 10 | 8 | 4.6 | 6.4 | 12 | 0.75 | 0.67 |
| Number of indexed patterns | 32,819 | 61,964 | 36,083 | 73,130 | 18,874 | 54,544 | 6,629 |
| Space group | C 2 2 21 | P 21 | C 2 | C 2 | P 21 21 21 | P 43 21 2 | H 32 |
| Resolution, Å | 2.8 | 3.2 / 3.4 / 4.0 | 2.7 | 2.9 | 3.3 / 3.8 / 3.8 | 1.89 | 1.75 |
*After lipid titration
Table 1. Summary of the sample preparation and data collection statistics for representative structures solved using the LCP-SFX method.
The amount of sample required for an LCP-SFX experiment depends on the crystal diffraction quality, crystal density, the diameter of the injector nozzle, as well as the XFEL beam size, intensity and pulse repetition rate.
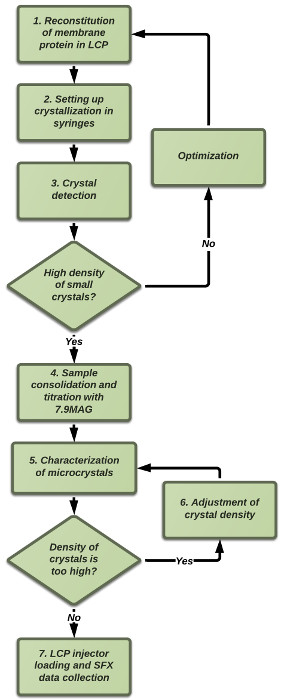
Figure 1. Flowchart of a typical sample preparation procedure for LCP-SFX. Sample preparation starts with LCP crystallization of the target protein in gas-tight glass syringes. After crystals are obtained, the crystal-laden LCP is consolidated in one syringe and titrated with additional lipid, to absorb the excess precipitant solution. Crystals are then characterized using various microscopy methods prior to XFEL data collection. Please click here to view a larger version of this figure.

Figure 2. A representative result, the structure of 5-HT2B in complex with ergotamine. (a) Microcrystals of 5-HT2B/ergotamine imaged using a bright-field microscope mode8. This figure has been reused from reference 8 with copyright permission from Science. (b) Microcrystals of 5-HT2B/ergotamine imaged using a cross-polarized microscope mode8. This figure has been reused from reference 8 with copyright permission from Science. (c) A cartoon representation of the 5-HT2B/ergotamine structure obtained by the LCP-SFX approach. Lipids that were built in the model are shown in stick representation. The ligand ergotamine is shown in spheres representation. Solid lines indicate the approximate membrane boundaries. Please click here to view a larger version of this figure.

Figure 3. A representative result, the structure of SMO in complex with cyclopamine. Left panel, microcrystals of SMO/cyclopamine imaged using a cross-polarized microscope mode6. This figure has been reused from reference 6 with copyright permission from Nature Communications. Right panel, a cartoon representation of the SMO/cyclopamine structure obtained by the LCP-SFX approach. Ligand cyclopamine is shown in spheres representation. Solid lines indicate the approximate membrane boundaries. Please click here to view a larger version of this figure.
Discussion
The protocols described here provide a general outline of the sample preparation procedure for a standard LCP-SFX experiment with an LCP injector. Based on our experience, the total amount of the final microcrystal-laden LCP sample required for collecting a full dataset is typically 50-100 µl (Table 1; 25-50 µl of initial protein-laden LCP sample), depending on the microcrystal size, quality and density. Since each 100 µl gas-tight glass syringe can accommodate about 7 µl of LCP in the form of a fully extended string to ensure proper and even diffusion of the precipitant solution into the LCP, at least four to seven samples in syringes should be prepared for each LCP-SFX experiment.
Since the sample is extruded through a narrow 20-50 µm in diameter capillary, it is crucial to avoid any foreign particulate material in the sample. Dusts and fibers that could be occasionally introduced in the LCP sample or precipitant solutions may clog the injector capillary and increase the down-time during the experiment. Therefore, it is important to filter the lipid and all solutions through a 5 µm pore filter before preparing samples. Optionally, a clean room or a portable clean room hood can be used for sample preparation.
These protocols are based on using 9.9 MAG (monoolein) as the host lipid for MP crystallization. They, however, are not limited to 9.9 MAG and can be easily adapted to any other LCP host lipids or lipid mixtures after taking into account the differences in the lipid phase behavior. Most of the structures of MPs crystallized in LCP were obtained using one of the MAGs, with 9.9 MAG being the most successful representative so far15. The main drawback of using 9.9 MAG for SFX is its transition to lamellar crystal phase upon cooling below 18 °C, which often occurs when the data acquisition is performed in vacuum. The titration with 7.9 MAG described in Section 5 of this protocol provides a good solution to this problem. In our experience, crystals withstand such a titration without any adverse effects. If, however, the addition of 7.9 MAG or another short-chained MAG is not desirable, the titration can be performed with 9.9 MAG. In this case, the gas that stabilizes the flow of LCP during injection into the vacuum should be switched from helium to nitrogen, which can prevent the formation of a crystalline lipid phase in most samples, at the expense of having a less stable sample flow.
The gel-like consistency of LCP has a great advantage for use as a crystal carrier medium, since it allows adjustment of the crystal flow rate across a wide range, suitable for serial crystallography data collection at modern XFEL and synchrotron sources. Matching the crystal flow rate with the XFEL pulse repetition rate results in dramatic reduction in crystal consumption by orders of magnitude compared to liquid injection. LCP is a suitable carrier medium for delivery not only of MP crystals grown in it, but also for crystals of soluble proteins21. Several alternative viscous crystal carrier media have recently been introduced22-24, extending the arsenal of tools and reagents for conducting serial crystallography experiments. Moreover, serial crystallography with LCP as a crystal delivery medium has been demonstrated at conventional synchrotron sources, at least for well-diffracting crystals24,25. Future upgrades of synchrotron sources that boost X-ray intensity by orders of magnitude, as well as improvements in detector technologies, will make serial crystallography an even more accessible and attractive method for structure determination.
LCP-SFX has demonstrated its potency for MP structural determination. For challenging biological systems (such as GPCRs or macromolecular complexes) where large, diffraction-quality crystals are difficult to grow, LCP-SFX may provide an attractive, if not the only, viable option to solve an atomic resolution structure. With all its advantages, i.e., using LCP as the matrix for MP crystallization and crystal delivery, low protein consumption, absence of radiation damage, room temperature data collection, possibilities of time-resolved studies26,27 and no crystal harvesting requirement, LCP-SFX should play an important role in the future of structural biology.
Disclosures
The authors have no conflicts of interest to disclose.
Acknowledgements
This work was supported by the National Institutes of Health grants R01 GM108635 and U54 GM094618, Mayo Clinic-ASU Collaborative Seed Grant Award and NSF STC award 1231306. We thank A. Walker for assistance with manuscript preparation.
Materials
| Name | Company | Catalog Number | Comments |
|---|---|---|---|
| LCP host lipid monoolein (9.9 MAG) | Nu Chek Prep | M239 | Hosting lipid for the protein to be crystallized |
| LCP host lipid monoolein (9.9 MAG) | Sigma | M7765 | Hosting lipid for the protein to be crystallized |
| LCP host lipid monopalmitolein (9.7 MAG) | Nu Chek Prep | M219 | Hosting lipid for the protein to be crystallized |
| LCP host lipid 7.9 MAG | Avanti Polar Lipids | 850534 | Hosting lipid for tiration to avoid lamellar crystal phase (Lc) formation during sample injection |
| Purified protein solution concentrated to 20-50 mg/ml | Target protein | ||
| Chloroform | Fisher Scientific | C606-1 | Used to dissolve lipids |
| Methanol | Sigma-Aldrich | 179337-500ML | Used to wash syringes |
| Eleven 100 μl Hamilton gas-tight syringes without needles | Hamilton | 7656-01 | For LCP preparation |
| Eight syringe couplers | Formulatrix | SKU 209526 | For LCP preparation |
| LCP-injector loading needle | Hamilton | 7804-01 point style 3, length 1 inch | For LCP dispensing and injector loading |
| Removable needle | Hamilton | 7768-01 | For removing precipitant solution |
| Parafilm M | Parafilm | PM992 | Used for syringe sealing |
| Lint free lens cleaning tissues | Fisher | NC9592151 | |
| Centrifugal filter tubes, Ultrafree-MC, 0.5 ml, Durapore 5 µm | Millipore | UFC3 0SV 00 | Used for filtering of precipitant solutions and lipids |
| Microscope slides, 1 inch x 3 inch | GoldSeal | 3010 | |
| Two wash bottles with fine tips. One filled with milli-Q or distilled water, the other with methanol | VWR | 89094-640 | These are used to clean the syringes, needles and coupler. Methanol is used first, then water. |
| Gloves | Microflex | XC-310-L | For blow drying syringes, needles, ferrules, and couplers |
| Safety glasses | |||
| Pressurized air cans | Office Depot (Dust-Off) | 527494 | For syringe cleaning |
| Dry block heater with a digital temperature controller | Fisher | 11-720-10BQ | Used for thawing lipids |
| Benchtop Centrifuge | Fisher | 05-413-340 | Spinning down solutions |
| Clean Room Mini - 12 inch Portable Positive Pressure Hood with HEPA filter | Sentry Air Systems, Inc. | SS-112-PCR | Cleaning sample preparation |
| Stereo zoom microscope equipped with a linear polarizer and rotating analyzer | Nikon | SMZ1500 | Crystal density check |
| UV microscope | JAN Scientific | UVEX-P | Optional, for crystal imaging purposes |
| SHG imager | Formulatrix | SONICC | Optional, for crystal imaging purposes |
References
- Cherezov, V., et al. High-resolution crystal structure of an engineered human beta2-adrenergic G protein-coupled receptor. Science. 318 (5854), 1258-1265 (2007).
- Cherezov, V. Lipidic cubic phase technologies for membrane protein structural studies. Curr Opin Struc Biol. 21 (4), 559-566 (2011).
- Chapman, H. N., et al. Femtosecond X-ray protein nanocrystallography. Nature. 470 (7332), 73-77 (2011).
- Neutze, R., Wouts, R., van der Spoel, D., Weckert, E., Hajdu, J. Potential for biomolecular imaging with femtosecond X-ray pulses. Nature. 406 (6797), 752-757 (2000).
- DePonte, D. P., et al. Gas dynamic virtual nozzle for generation of microscopic droplet streams. J Phys D Appl Phys. 41 (19), 195505(2008).
- Weierstall, U., et al. Lipidic cubic phase injector facilitates membrane protein serial femtosecond crystallography. Nat Commun. 5, 3309(2014).
- Fenalti, G., et al. Structural basis for bifunctional peptide recognition at human δ-opioid receptor. Nat Strcut Mol Biol. 22 (3), 265-268 (2015).
- Liu, W., et al. Serial femtosecond crystallography of G protein-coupled receptors. Science. 342 (6165), 1521-1524 (2013).
- Zhang, H., et al. Structure of the Angiotensin Receptor Revealed by Serial Femtosecond Crystallography. Cell. 161 (4), 833-844 (2015).
- Liu, W., Ishchenko, A., Cherezov, V. Preparation of microcrystals in lipidic cubic phase for serial femtosecond crystallography. Nat Protoc. 9 (9), 2123-2134 (2014).
- Liu, W., et al. Structural basis for allosteric regulation of GPCRs by sodium ions. Science. 337 (6091), 232-236 (2012).
- Caffrey, M., Cherezov, V. Crystallizing membrane proteins using lipidic mesophases. Nat Protoc. 4 (5), 706-731 (2009).
- Liu, W., Cherezov, V. Crystallization of membrane proteins in lipidic mesophases. J Vis Exp. (49), (2011).
- Li, D., Shah, S. T. A., Caffrey, M. Host Lipid and Temperature as Important Screening Variables for Crystallizing Integral Membrane Proteins in Lipidic Mesophases. Trials with Diacylglycerol Kinase. Cryst Growth Des. 13 (7), 2846-2857 (2013).
- Caffrey, M., Lyons, J., Smyth, T., Hart, D. J. Monoacylglycerols: The Workhorse Lipids for Crystallizing Membrane Proteins in Mesophases. Current Topics in Membranes. 63, Elsevier. (2009).
- Kulkarni, C. V., Wachter, W., Iglesias-Salto, G., Engelskirchen, S., Ahualli, S. Monoolein: a magic lipid? Phys Chem Chem Phys. 13 (8), 3004-3021 (2011).
- Kissick, D. J., Gualtieri, E. J., Simpson, G. J., Cherezov, V. Nonlinear optical imaging of integral membrane protein crystals in lipidic mesophases. Anal Chem. 82 (2), 491-497 (2010).
- James, D. Injection Methods and Instrumentation for Serial X-ray Free Electron Laser Experiments. , Arizona State University. 1-126 (2015).
- Kang, Y., et al. Crystal structure of rhodopsin bound to arrestin by femtosecond X-ray laser. Nature. 523 (7562), 561-567 (2015).
- Rasmussen, S. G. F., et al. Crystal structure of the β2 adrenergic receptor-Gs protein complex. Nature. 477 (7366), 549-555 (2011).
- Fromme, R., et al. Serial femtosecond crystallography of soluble proteins in lipidic cubic phase. IUCrJ. 2 (Pt 5), 545-551 (2015).
- Sugahara, M., et al. Grease matrix as a versatile carrier of proteins for serial crystallography. Nat Meth. 12 (1), 61-63 (2014).
- Conrad, C. E., et al. A novel inert crystal delivery medium for serial femtosecond crystallography. IUCrJ. 2 (Pt 4), 421-430 (2015).
- Botha, S., et al. Room-temperature serial crystallography at synchrotron X-ray sources using slowly flowing free-standing high-viscosity microstreams. Acta Crystallogr Sct D. 71 (Pt 2), 387-397 (2015).
- Nogly, P., et al. Lipidic cubic phase serial millisecond crystallography using synchrotron radiation. IUCrJ. 2, 168-176 (2015).
- Tenboer, J., et al. Time-resolved serial crystallography captures high-resolution intermediates of photoactive yellow protein. Science. 346 (6214), 1242-1246 (2014).
- Kupitz, C., Basu, S., Grotjohann, I., Fromme, R. Serial time-resolved crystallography of photosystem II using a femtosecond X-ray laser. Nature. 513, 261-265 (2014).
Reprints and Permissions
