Tandem splicing events occur at sites less than 12 nucleotides apart. Quantifying ratios of such splice variants is feasible using an absolute quantitative PCR approach. This manuscript describes how splice variants of the gene STAT3, in which two splicing events results in Serine-701 inclusion/exclusion and α/β C-termini, can be quantified.
Method Article
Merging Absolute and Relative Quantitative PCR Data to Quantify STAT3 Splice Variant Transcripts
In This Article
Summary
Abstract
Human signal transducer and activator of transcription 3 (STAT3) is one of many genes containing a tandem splicing site. Alternative donor splice sites 3 nucleotides apart result in either the inclusion (S) or exclusion (ΔS) of a single residue, Serine-701. Further downstream, splicing at a pair of alternative acceptor splice sites result in transcripts encoding either the 55 terminal residues of the transactivation domain (α) or a truncated transactivation domain with 7 unique residues (β). As outlined in this manuscript, measuring the proportions of STAT3's four spliced transcripts (Sα, Sβ, ΔSα and ΔSβ) was possible using absolute qPCR (quantitative polymerase chain reaction). The protocol therefore distinguishes and measures highly similar splice variants. Absolute qPCR makes use of calibrator plasmids and thus specificity of detection is not compromised for the sake of efficiency. The protocol necessitates primer validation and optimization of cycling parameters. A combination of absolute qPCR and efficiency-dependent relative qPCR of total STAT3 transcripts allowed a description of the fluctuations of STAT3 splice variants' levels in eosinophils treated with cytokines. The protocol also provided evidence of a co-splicing interdependence between the two STAT3 splicing events. The strategy based on a combination of the two qPCR techniques should be readily adaptable to investigation of co-splicing at other tandem splicing sites.
Introduction
Short-range (tandem) alternative splicing, where alternate acceptor or donor sites are in close proximity to one another, is common in mammals1, invertebrates2 and plants3. It is estimated that 20% of mammalian genes contain alternative splice sites 2-12 nucleotides apart4. Many of these sites are 3 nucleotides apart and result in inclusion or exclusion of a single codon. There is debate about the nature of splicing regulation at these sites5,6 with some arguing that the splicing motif differences are so subtle that selection is stochastic7, while others infer regulation based on tissue specificity8.
Tandem splice site selection has been analyzed semi-quantitatively using modified capillary electrophoresis7, and high-resolution gel electrophoresis8. RNA-Seq (RNA sequencing) reads can be used to quantify the splicing ratios at each splice site. In this way, RNA-Seq data has provided insight into the regulation of tandem splice sites9. It has also enabled prediction of expected splice variant ratios based on nucleotide motif10. Most of the emphasis on splicing that includes or excludes a single codon has been on the more commonly occurring tandem acceptor splice sites, known as NAGNAGs (where N = any nucleotide).
Tandem donor alternative splice sites including or excluding a single codon (GYNGYN recognition motif, where Y = pyrimidine) are less common than tandem acceptors. Signal transducer and activator of transcription 3 (STAT3) is a key gene undergoing tandem donor alternative splicing1,11. The tandem donor splice sites join exons 21 and 22 and result in the inclusion or exclusion of the codon for Serine-701 (S or ΔS respectively)1,11. Downstream alternative acceptor sites (40 nucleotides apart from each other) joining exons 22 and 23a/b result in the inclusion of either the 55 terminal residues of the transactivation domain (α) or a truncated transactivation domain with 7 unique C-terminal residues (β)11. Therefore, four splice variants are possible.
STAT3 protein is a transcription factor and major signal integrator in numerous cell types12 and when mutated its constitutive activation contributes to several cancer phenotypes (reviewed in reference13). Job's Syndrome, an immunodeficiency disorder characterized by high levels of IgE, is also caused by mutations in STAT3 (reviewed in reference14). Distinct roles for STAT3 α and β splice variant proteins have been previously described15. Initially, STAT3 β was thought to act in a dominant-negative manner16, antagonizing STAT3 α's transcriptional activity, but subsequent work suggested it has independent target genes17. Despite the subtlety of tandem splicing, there is reason to believe the absence or presence of Serine-701 (Ser701) influences function. Not only is Ser701 in close proximity to Tyrosine-705 (the residue phosphorylated in STAT3 activation18), but a recent study suggests that STAT3 S and ΔS splice variants are both necessary for viability of STAT3-addicted Diffuse Large B Cell Lymphoma (DLBLCL) cells19. The biological relevance remains to be explored. Given that splice variant composition could influence function, we endeavored to discover whether the ratio was perturbed by cytokine stimulation in eosinophils.
We initially attempted to explore the linkage between the two splicing events by using PCR specific for STAT3 α and β splice variants, followed by cleavage of products with a restriction enzyme specific for the S splice variants, AfeI. Densitometry of products indicated inclusion of Ser701 was roughly ten times more common than its omission (ΔS) in both STAT3 α and β (data not shown). However, this semi-quantitative approach was not sufficiently reproducible, and could not be used effectively to measure all four splice variants simultaneously. To analyze proportions of each of the four splice variants, it was necessary to establish a quantitative PCR (qPCR) protocol that yielded tight technical (several assays of a given sample) replicates.
Relative qPCR relies on comparison of a gene of interest to a standard or housekeeping gene known to be expressed at a particular level20 and is appropriate when the gene of interest and housekeeping gene are amplified with similar efficiency. A double stranded (ds) DNA-binding fluorescent (cyanine) dye binds to PCR amplicons21, and after a certain number of cycles, sufficient amplification has occurred for fluorescence to be detectable. The higher the initial level of the transcript, the lower the threshold cycle (Ct) value. Since the concentration of cDNA preparations differs, one needs to compare the transcript's concentration with the concentration of a transcript known to be expressed at a consistent level in all samples, like glucuronidase-β (GUSB) in eosinophils22.
Relative qPCR is not feasible for highly similar sequences, as seen in splice variants resulting from tandem splicing. The stringent conditions required to specifically amplify the splice variants result in decreased efficiency. Instead, absolute quantification must be used23. This entails preparing a standard curve with known concentrations of the spliced transcript of interest, and ensuring PCR conditions optimize specificity24. As described, absolute and relative qPCR data for a particular gene can be merged to inform understanding of the gene's expression in a particular cell type, in this case STAT3 in variously stimulated eosinophils25.
Herein, STAT3 splice variant quantification is described with the expectation that the method can be adapted to targeted studies of other tandem splicing events. Optimization was a lengthy process, where several primer pairs at various concentrations and numerous iterations of cycling parameters were tested over the course of a few months. The key features of the protocol are primer specificity validation and quantification based on standard curves with known concentrations of the splice variants. Relative qPCR in conjunction proved helpful for our application but is not necessary.
Protocol
NOTE: Peripheral blood eosinophils were received without identifying information in accord with a protocol approved (#2013-1570) by the University of Wisconsin-Madison Center for Health Sciences Institutional Review Board. Signed informed consent from the donor was obtained for the use of each sample in research.
1. Creating Plasmids as Template Standards
- Create primers for an amplicon spanning both STAT3 splice sites, with 5'- KpnI and NheI restriction sites (and 5'-extensions) as per Table 1a.
NOTE: KpnI and NheI sites were chosen to enable inserts to be ligated into a modified pET-28a vector with kanamycin resistance25,26. KpnI site had been added into the multiple cloning site. - Using freshly donated eosinophils, prepare duplicate samples of 2.5 x 10⁶ cells/ml in cell culture medium (Roswell Park Memorial Institute (RPMI)1640 medium). Incubate for 1 hr at 37 °C under 5% CO2 and 10% humidity.
- Prepare complementary (c)DNA from samples (at least 1 x 10⁶ cells per preparation) as per manufacturer's instructions using the RNA extraction and cDNA synthesis kits.
- From template cDNA prepared in step 1.2.1, amplify STAT3 splice variants using amplification PCR as per Table 2a.
- Resolve amplicons in 2% agarose Tris-acetate-ethylenediaminetetraacetate (TAE) gel27. Excise bands from the gel and purify according to gel excision kit instructions.
- Cut amplicons and plasmid with appropriate restriction enzymes (overview of restriction in reference27), using volumes, incubation times and temperatures recommended by enzyme provider; and purify as in step 1.4. Ligate restricted amplicons into plasmid under provider-recommended conditions.
- Prepare a negative control (restricted plasmid DNA without insert but with ligase) and a positive control (unrestricted plasmid with kanamycin resistance). Perform standard plasmid transformations of competent E. coli DH5α28 using ligation mixtures27.
- Incubate transformed E. coli in 1 ml Luria-Broth (LB) medium (prepared as instructed27) shaking for 1 hr at 37 °C. Spread transformants on LB plates containing 50 µg/ml kanamycin and incubate at 37 °C overnight.
- Pick several colonies from the STAT3 α and STAT3 β plates using sterile toothpicks27. Transfer each to 2 ml LB. Grow cultures overnight at 37 °C in a shaking incubator.
- Purify plasmids from bacterial cultures by following instructions provided in a DNA purification kit. Store plasmids at -20 or -80 °C.
- Sequence plasmids from several colonies by preparing 20 µl sequencing reactions. Pipette 3 µl sequencing reaction buffer, 2 µl sequencing reaction mix, 12 µl ultrapure water, 1 µl plasmid as template and 2 µl sequencing primer.
NOTE: If using pET-28a vector, use sequencing primer 5'-TAA TAC GAC TCA CTA TAG GGG-3'.- Assess electrophoretograms of plasmids encoding each variant: Sα, Sβ, ΔSα and ΔSβ25.
- Measure concentration of pure plasmid DNA in ng/µl. If reading absorbance at 260 nm using a spectrophotometer, calculate DNA concentration using the Beer-Lambert law29:

Where c = concentration, A = absorbance, ε (extinction coefficient) = 0.02 (µg/ml)-1 cm-1 for double-stranded DNA and L = path length of light (usually 1 cm). - Using the molecular weights of STAT3 splice variant cDNA amplicons and the vector, calculate the copy number per µl.
NOTE: Molecular weight per base pair (bp) is estimated as 650 Da.

2. Analyzing Primer Specificity for Absolute qPCR
- Prepare 1 in 10 dilution series of STAT3 plasmids, with ~108 to 103 copies per µl (20 µl) using ultrapure water. Measure concentration of most concentrated (~108 copies per µl, see step 1.11).
- Use diluted plasmids to prepare four "non-target" mixes (i.e., STAT3ΔSβ negative control containing equal concentrations of STAT3 Sα, ΔSα, Sβ but no ΔSβ) at 106 copies per µl each. Prepare a "target" mix with equal concentrations of all four templates each at 106 copies per µl.
- Prepare primer pair solutions for each splice variant (see Table 1b and Figure 1) by making ~60 µl of primers each at a 7 µM concentration (final concentration in sample will be 560 nM).
- Dilute DNA polymerase/dsDNA-binding dye mix 7:5 with pure H2O.
- Set up Assay 1 in a 96-well PCR plate as shown in template (Table 3).
- Add 21 µl diluted DNA polymerase/dsDNA-binding dye mix, then 2 µl of primer mix and 2 µl of template (as per Table 2b). Instead of template, add 2 µl filtered H2O to the no template control (NTC) well. Set up reactions in duplicate to assess repeatability30.
- Seal qPCR plate with adhesive cover and centrifuge for 5 min at 1,200 x g at 12 °C.
- If using software listed on Materials, set up experiment as described.
- Turn on qPCR machine and insert sealed qPCR plate. Click File > New > Next > Select "New detector", choose reporter, quencher and provide name. Set up a "new detector" for each splice variant.
- Select Next and set up standards as prompted on the Set Up Sample Plate page, ensuring quantities are entered into the table and appropriate detectors are selected. Click finish.
- Set up cycling as per Table 2b. Ensure that fluorescence reading (to determine Ct) occurs during the 72 °C step of each cycle. Select Run.
- When run is complete, click the Results tab > Amplification plot tab. Evaluate output amplification plot to assess data quality (look for an exponential plot, as in Figure 2).
NOTE: Ensure amplification plots are mostly exponential and that the cycle threshold can be set at the exponential part of the plot. Ensure NTCs are not amplified and other standard points demonstrate a low Ct value with a high ΔRn. - To export results to spreadsheet software, click File > Export > Results.
3. Assessing Absolute qPCR Assay Specificity and Repeatability
- Repeatability
- Use the data from Step 2.7.5 to calculate standard deviation of Ct (threshold cycle for fluorescence) values.
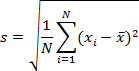
Where N = number of samples (2 if done in duplicate), = sample's Ct and
  = sample Ct mean. Check that the standard deviation of Ct values of duplicates is ≤0.2. Check that Ct values in all but NTC wells are smaller than 38.
 - If repeatability is poor optimize cycling parameters by either increasing or decreasing annealing time.
- Use the data from Step 2.7.5 to calculate standard deviation of Ct (threshold cycle for fluorescence) values.
- Plot log copy number (as determined in Step 1.12 and prepared in Step 2.1) vs Ct value to create a standard curve; yielding the following equation:

Where y is Ct, m is the gradient, x is log(copy number) and b is the intercept value.
NOTE: The R2 value of the linear regression will be ≥0.95 for good data. - Calculate amplification efficiency using standard curve and the equation:

NOTE: Aim for efficiency ≥75%. - Calculate specificity from qPCR assay 1 using Too's formula:

Where ΔCtToo = Cttarget - Ctnon-target , describing the difference in threshold cycle number for specific and non-specific amplification
NOTE: Specificity should exceed four orders of magnitude (i.e., specificity factor ≥4).- If specificity is poor, optimize by lowering primer concentration. Set up assays (as described in steps 2.5-2.7) with final primer concentrations ranging from 100 nM to 500 nM.
4. Performing Relative qPCR Assays
- Treat Cells with Cytokines to Promote Transcription.
- For freshly donated eosinophils, prepare duplicate samples of 2.5 x 10⁶ cells/ml in cell culture medium (RPMI 1640 medium) and treat with 50 ng/ml interleukin-3 (IL3) and/or 50 ng/ml tumor necrosis factor α (TNFα) for periods of 3, 6, 9 and 20 hr at 37 °C under 5% CO2 and 10% humidity.
- Prepare cDNA from eosinophil samples (at least 1 x 10⁶ cells per preparation) as per manufacturer's instructions using the RNA extraction and cDNA synthesis kits.
- Prepare serial dilutions of two sample cDNA aliquots (control or resting samples), with a dilution range from "1" to "1 in 1024" dilution.
- For the 1 in 4 dilution, pipette 1 µl cDNA and 3 µl ultrapure water.
- For the 1 in 16 dilution, pipette 1 µl of the 1 in 4 dilution and 3 µl ultrapure water, etc.
- Set up PCR in 96-well plate with 25 µl reactions as described steps 2.3-2.5 but with several primer concentrations for pan-STAT3 and GUSB (see template in Table 4).
- Add "new detector" for GUSB and follow steps 2.6-2.7, using the cycling parameters described in Table 2c.
- Generate standard curves (see steps 3.2 and 3.3) to determine which primer concentrations result in 95-100% amplification efficiency.
- Set up plate with prepared cDNA samples (from Step 4.2) and optimized primer concentrations (see Table 2c for cycling parameters, reagents and Table 5 96-well plate template).
- Perform steps 2.6-2.7. Repeat assay at least once and check data quality.
- Calculate the average Ct value of duplicate sample Cts for both STAT3 and housekeeping gene GUSB.
- Obtain ΔCt values for each sample.

- Designate resting sample (usually has lowest concentration of transcript of interest) as Sample 0. Calculate ΔΔCt31 for each sample (here designated as sample X):

- Calculate fold-increase for each sample:

- Reproducibility
- Calculate the coefficient of variation (CV) of copy number for pan-STAT3 and GUSB.
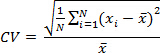
Where N = number of samples, = sample's calculated copy number and = sample mean. Check that CV of each sample (multiple assays) is ≤10%.
- Calculate the coefficient of variation (CV) of copy number for pan-STAT3 and GUSB.
5. Analyzing Absolute qPCR Data for Unknown Samples
- Compare Ct values obtained in relative qPCR (as described in step 4.9) for housekeeping gene GUSB to ensure samples' cDNA concentrations are within one order of magnitude.
- Dilute cDNA accordingly (e.g., if sample 1 has a Ct value of ~17.5, and other samples' Ct values are ~21, sample 1 is roughly 2(21-17.5) = 11 times more concentrated. Perform a 1:1 dilution with ultrapure water within the same range without diluting more than necessary).
NOTE: Vastly different starting concentrations will bias the linear regression analysis (step 4.12).
- Dilute cDNA accordingly (e.g., if sample 1 has a Ct value of ~17.5, and other samples' Ct values are ~21, sample 1 is roughly 2(21-17.5) = 11 times more concentrated. Perform a 1:1 dilution with ultrapure water within the same range without diluting more than necessary).
- Set up absolute qPCR assay of samples. Prepare assay 2a template plate for Sα and Sβ as per Table 6; and prepare assay 2b for ΔSα and ΔSβ as per Table 7. Carry out assays as described in steps 2.6-2.7.3 (and Table 2b). Repeat assays at least once.
- Check data quality and export as described in steps 2.7.4-2.7.5.
- Set up absolute qPCR 96 well plate with 25 µl reactions using pan-STAT3 primers (primers in Table 1c, template in Table 8) at 400 µM and a mix of all four plasmids or a single plasmid at listed total concentrations.
NOTE: Efficiency does not matter for absolute qPCR, but optimizing efficiency of these primers is important for relative qPCR (Step 4). - Seal qPCR plate with adhesive cover and centrifuge for 5 min at 1,200 x g at 12 °C.
- Set up "new detector" for pan-STAT3 as in steps 2.7.1-2.7.3.
- Set up cycling for pan-STAT3 as per Table 2c (same conditions as relative qPCR). Ensure that fluorescence reading (to determine Ct) occurs during the 72 °C step of each cycle. Repeat assay at least once to ensure reproducibility.
- Check data quality and export (see steps 2.7.4-2.7.5).
- If amplification plots are not exponential (see Figure 2), dilute sample cDNA (1:10) and repeat assay as described (step 5.7).
- Using the equation of the standard curve (see 3.2, Figure 3) and the Ct values of samples, calculate the copy number of each splice variant and of pan-STAT3 in each sample.
![Runoff curve number equation, CN=10[(Ct-b)/m], formula diagram, hydrology analysis tool.](/files/ftp_upload/54473/54473eq13.jpg "figure-protocol-13")
- Plot log (absolute qPCR copy number values obtained for pan-STAT3) vs log (cumulative absolute qPCR copy number values for STAT3 splice variants).
NOTE: Ideal linear regression and slope values would both be ~1. - Calculate repeatability (Step 3.1) and reproducibility (Step 4.13).
6. Merging Absolute and Relative qPCR Data
- Multiply the proportion of variant with the total STAT3 fold-increase to calculate fold-increase of each splice variant.
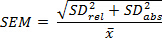
- Calculate the standard deviations (see Step 3.1.1) of the absolute and relative values to account for propagation of error. Determine standard error of measurement (SEM) as shown:
Results
Good quality qPCR data will generate a sigmoidal amplification plot (Figure 2a), signifying exponential increase in transcripts over the course of cycling. The presence of too much template can result in a high fluorescence background, meaning an inappropriate baseline is established in the first few cycles. If the data do not provide an exponential curve (Figure 2b), further optimization is necessary (outlined in steps 3.1 and 3.4). For further information about troubleshooting qPCR results, refer to reference32. The standard curves generated for the template calibrator plasmids will indicate the efficiency of amplification (curve for STAT3 Sα shown in Figure 3). Efficiencies between 83 and 95% were observed under the conditions described. The equation for specificity (Step 3.4) assumes equal efficiency, which is unlikely25, so the specificity is likely to be greater than specificity factor suggests.
In order to evaluate the congruency of STAT3 levels, the absolute values of each of the four splice variants were measured as well as the level of total STAT3, the latter using primers amplifying a region common to all four splice variants (Figure 4). Ideally the linear regression (indication of correlation) and slope (ratio of pan-STAT3 to summed splice variants) should both be close to 1.
The absolute qPCR data are presented as pie charts to show the proportions of the four splice variants over time post-stimulation with cytokines (Figure 5a). Resting eosinophils (0 hr) had the smallest proportion of STAT3 Sα, although this variant was always the most abundant. Multiplying the fraction of STAT3 β splice variants (Sβ+ΔSβ) by the fraction of STAT3 ΔS splice variants (ΔSα+ΔSβ) consistently gave a value lower than the experimentally-recorded value for ΔSβ. If the splicing events were independent, one would expect that multiplying fraction of ΔS variants by the fraction of β variants would give a value that agrees with the experimentally-determined value. Higher levels of ΔSβ than expected from independent splicing events suggests a co-splicing bias exists.
Merging absolute and relative qPCR data demonstrated that levels of all STAT3 splice variants increased post-stimulation with cytokines IL3 and TNFα, with levels peaking 6 hr post-stimulation (Figure 5b-e). For three of the four splice variants, transcript levels were roughly 3 times higher in IL3+TNFα treated eosinophils (6 hr) compared to eosinophils in media at the same time point. STAT3 Sα levels were 3.5 times higher in IL3+TNFα treated eosinophils compared to eosinophils in media at this time point. The greatest uncertainty (largest standard error of measurement) was seen in ΔSβ (Figure 5e), which comprises the smallest fraction of total STAT3 in all samples. This was not surprising, as lower levels are associated with higher Ct values. Requiring more cycles to reach the threshold cycle will compound uncertainty due to cycle-to-cycle variation in efficiency of amplification.
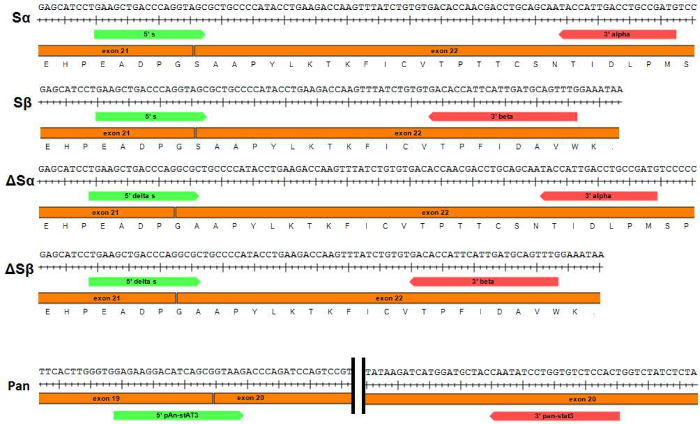
Figure 1: Schematic of primer pairs used to perform qPCR of STAT3 splice variants and pan-STAT3. Primers used to specifically amplify each of the STAT3 splice variants (Sα, Sβ, ΔSα and ΔSβ respectively) are shown. Forward primers (STAT3 "S" and "ΔS") span the junction between exons 21 and 22. Please click here to view a larger version of this figure.
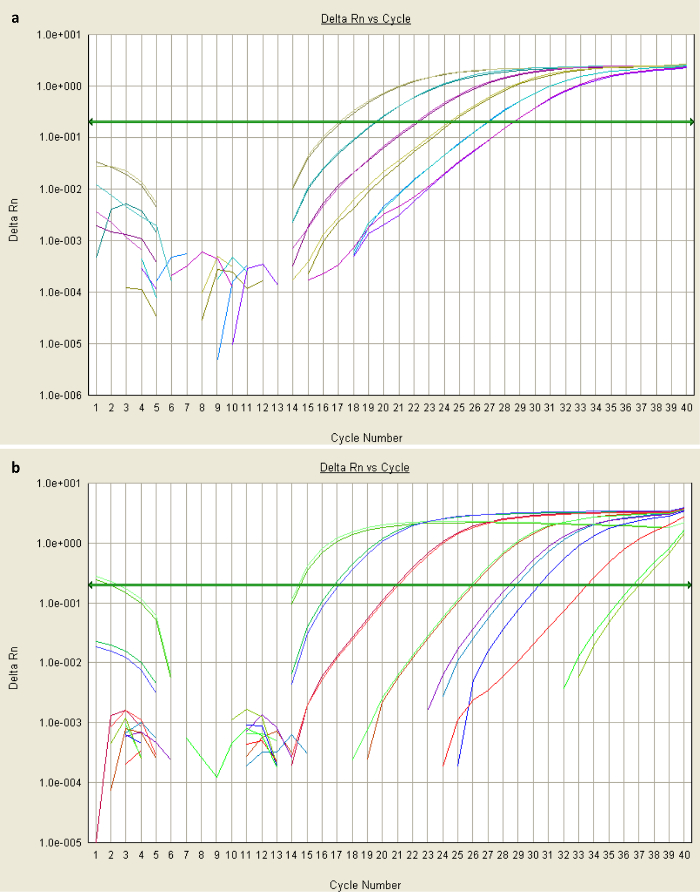
Figure 2: Amplification plots of qPCR data. (a) Sigmoidal amplification plots means reliable amplification. These data were obtained from qPCR of two serial dilutions of plasmid containing STAT3 Sα, with each pair of colored lines representing the fluorescence levels of duplicate diluted samples over the course of 40 cycles (x-axis). The most concentrated sample (green-grey) was sufficiently amplified by cycle 17 (with dsDNA-binding dye proportional to fluorescence, shown on the y-axis) to exceed the threshold fluorescence value (baseline shown as green arrow). Its Ct value would be 17. (b) Non-exponential plots suggest that the background-fluorescence threshold was not correctly established in the first few cycles. This could be due to the presence of an inhibitor, or highly-concentrated template or primers. Please click here to view a larger version of this figure.
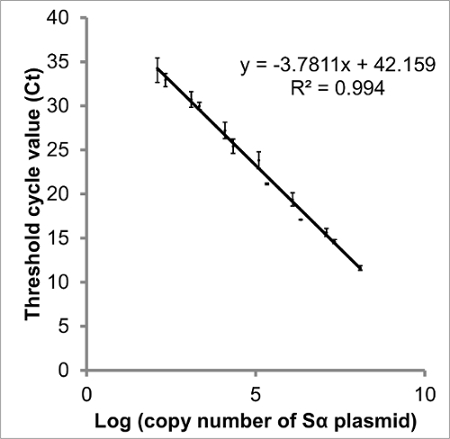
Figure 3: Standard curve of log (copy number of STAT3 Sα) vs Ct. There is a linear relationship between the log of each STAT3 splice variant's copy number and threshold cycle (Ct). Creating a standard curve from plasmid DNA imitates the cDNA of samples and thus provides a better measurement than a curve created from diluted PCR amplicons. The data presented are Ct values obtained from qPCR of two serial dilutions of plasmid containing STAT3 Sα. From this curve, the copy number present in each sample can be interpolated, and amplification efficiency calculated (83.9%). Although y-intercepts are less reproducible than slope, the intercept suggests 42.2 cycles would be necessary to be certain no target DNA is present. Error bars indicate SEM, n = 3. Comparable curves were constructed for STAT3 Sβ, ΔSα and ΔSβ (not shown). Please click here to view a larger version of this figure.
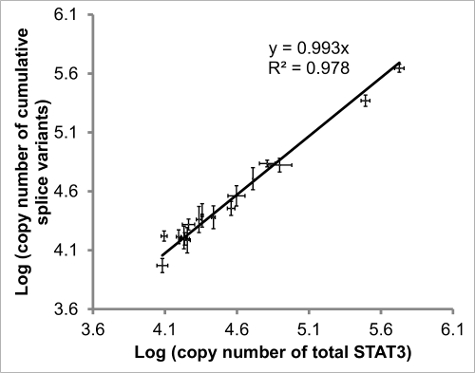
Figure 4: Comparison of quantified pan-STAT3 vs cumulative STAT3 splice variants. The regression of added STAT3 splice variants vs total STAT3 should have slope (ratio of pan- to cumulative) and R2 value (correlation) close to 1. Values from 17 samples (eosinophils and DLBCL) included. Error bars indicate SEM of x-to-y determinations, n ≥ 2 for each. Figure adapted from reference20. Please click here to view a larger version of this figure.
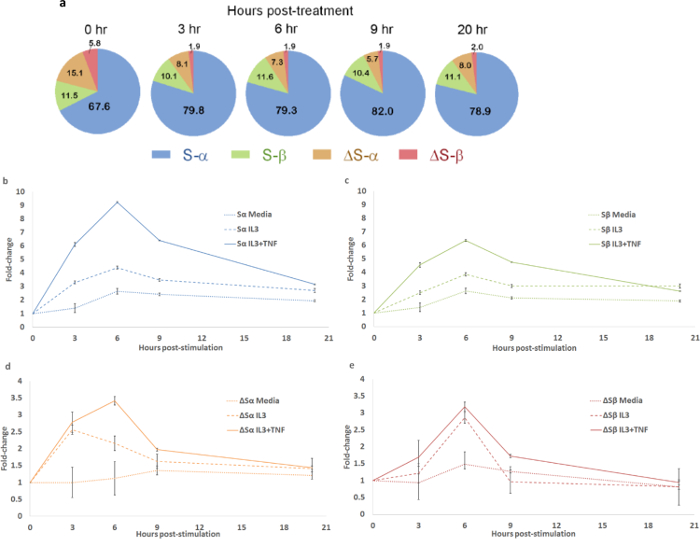
Figure 5: STAT3 splice variant levels fluctuated over the course of cytokine treatment. (a) Pie charts indicating percentages of each STAT3 splice variant in eosinophils during treatment with IL3 and TNFα. (b-e) Changes in STAT3 splice variants in eosinophils treated with various combinations of cytokines, measured by combining relative and absolute qPCR data. STAT3 Sα (b), Sβ (c), ΔSα (d), and ΔSβ (e) levels fluctuated over time post-stimulation. Levels initially increased, peaking 6 hr post-stimulation. The IL3+TNFα combination elicited higher expression of all four STAT3 splice variants than IL3 alone. SEM calculated for each data point accounting for propagation of error. Please click here to view a larger version of this figure.
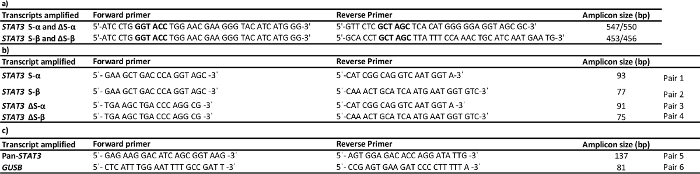
Table 1: Primers used for amplification (a), absolute (b) and relative (c) quantitative PCR. Cloning primers have restriction sequences and 5'-extensions for efficient cutting. KpnI and NheI restriction sites are indicated in bold. Please click here to view a larger version of this table.
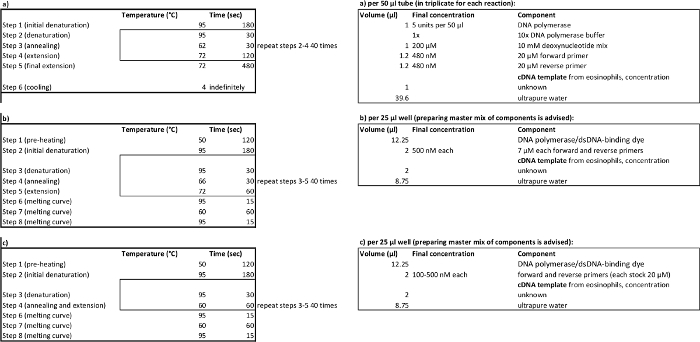
Table 2. PCR cycling parameters (left) and reagent volumes (right) for amplification (a), relative (b), absolute (c) quantitative PCR. Please click here to view a larger version of this table.
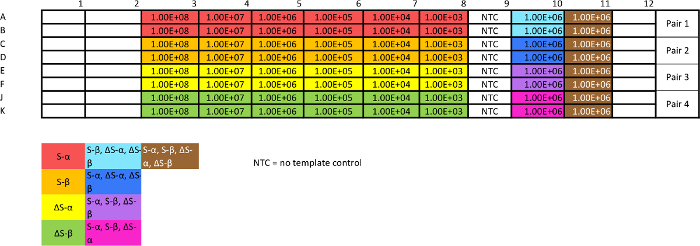
Table 3: Template for absolute qPCR plasmid calibration assay. This assay is necessary to assess reproducibility and efficiency, as well as generating standard curves from which to interpolate data. The "non-target" mixes will give an estimate of specificity. Optimization may be necessary to achieve consistency. Please click here to view a larger version of this table.
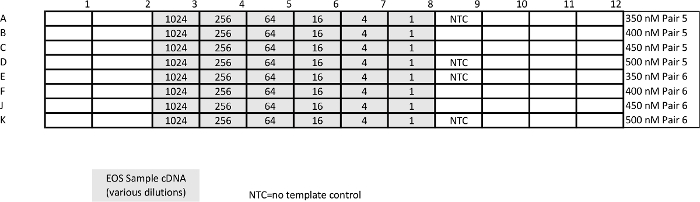
Table 4: Template for relative qPCR (pan-STAT3 and housekeeping gene GUSB) calibration assay. Unlike absolute qPCR, the point of this assay is to determine conditions at which amplification efficiency is ~100%. Please click here to view a larger version of this table.
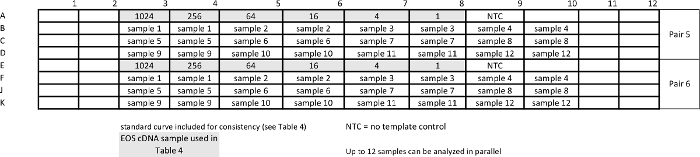
Table 5: Template for relative qPCR sample assay for measuring pan-STAT3 and housekeeping gene GUSB. Standard curves are repeated together with samples to ensure comparable efficiency of the assays. Please click here to view a larger version of this table.
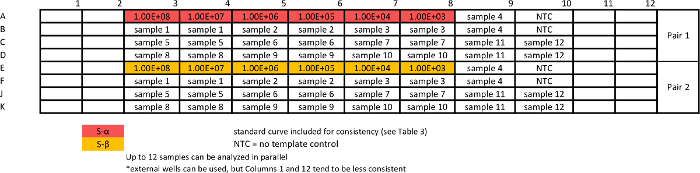
Table 6: Template for absolute qPCR sample assay for measuring S variants. Standard curves are repeated together with samples to ensure comparable efficiency of the assays. Please click here to view a larger version of this table.
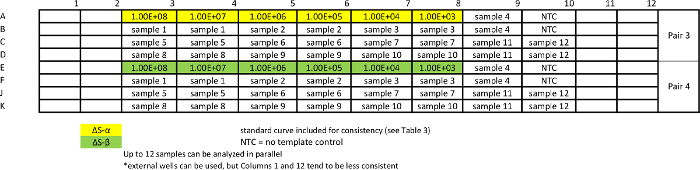
Table 7: Template for absolute qPCR sample assay for measuring ΔS variants. Standard curves are repeated together with samples to ensure comparable efficiency of the assays. Please click here to view a larger version of this table.
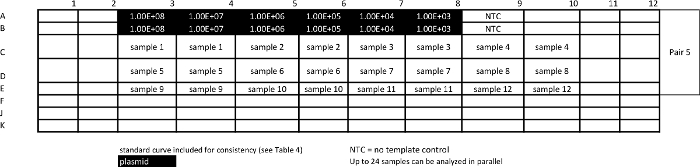
Table 8: Template for absolute qPCR sample assay for measuring pan-STAT3. Please click here to view a larger version of this table.
Discussion
We developed this protocol in order to assess the levels and proportions of STAT3 splice variant transcripts in eosinophils and lymphoma cells and learn whether cytokine stimulation affected the levels and proportions. STAT3 is of particular interest because of its pleiotropic and uncertain functionality, with conflicting reports on whether it acts as an oncoprotein or tumor suppressor in cancer (reviewed in reference33). Differences in STAT3 α and β splice variant function had been characterized previously34,35, and our protocol facilitated a knock-down/re-expression analysis that suggests a need for an optimal ratio of S and ΔS transcripts19.
Accurate quantification of distinct splice variants will facilitate further investigations of relating heterogeneous STAT3 function to splice variant composition. The protocol integrates absolute and relative qPCR data, combining the ability of absolute qPCR to calculate splice variant proportions, and relative qPCR to measure changes in overall STAT3 expression. This approach allows one to distinguish subtle differences in sequence and simultaneously measure splicing ratios at two alternative splice sites more than 50 nucleotides apart. Determining the ratios of the splicing events individually would not have yielded the remarkable finding that a co-splicing bias existed such that ΔSβ levels are higher than anticipated if uses of the two sites are randomly spliced25.
Critically, absolute qPCR with the use of plasmid calibration curves enables quantification (at sub-optimal efficiency) of splice variations that result in highly similar sequences. We anticipate a novel subtle splicing qPCR assay should take roughly two months to optimize. Key steps in assay development are the creation of STAT3 plasmids used in generating standard curves for absolute qPCR; experimentally determining optimal primer sequences and cycling parameters to ensure specificity and reproducibility; and the integration of relative qPCR data derived from quantifying pan-STAT3 expression relative to GAPDH expression. The correlation of copy number quantified by pan-STAT3 versus cumulative quantification (Sα+ΔSα+Sβ+ΔSβ) shows that the protocol produces reliable results.
A caveat of the technique is the extensive validation process. It is necessary to assess intra-assay variability (repeatability), interassay variability (reproducibility) and specificity. The protocol outlines ways to get numeric outputs for these parameters. We deemed efficiency ≥75%, specificity factor ≥4, coefficient of variation (reproducibility) ≤10% and Ct standard deviation (repeatability) ≤0.2 as suitable thresholds30. Mutations or deletions in the STAT3 sequence amino acids 1-690 will not be discovered by this protocol, although they may influence splicing ratios. Transcript proportions might not be proportional to proteoform proportions36.
Since samples have differing starting amounts of total cDNA, absolute qPCR is suitable for comparing copy numbers of splice variants within a sample but not for inter-sample comparison unless coupled with relative qPCR using an established housekeeping gene. The method described conforms to MIQE qPCR guidelines for reproducibility30. PCR cycling parameters and primer concentrations may need to be modified to obtain reproducible data if other equipment is used. Perfect specificity is not possible without drastically compromising efficiency, but the target was amplified more efficiently by greater than four of orders of magnitude.
Linear DNA is more easily amplified than circular. If an alternate plasmid does not provide satisfactory standard curves (R2 < 0.95), consider linearizing the plasmid by single site restriction prior to quantification. Optimizing qPCR is crucial for obtaining good quality data (Figure 1). Most qPCR protocols rely on two-step cycling, and machines are optimized accordingly. Non-uniform heating of the heating block may be exacerbated in three-step cycling, contributing to poor repeatability. Assays must be set up under sterile conditions with filter pipette tips and ultrapure water, ideally in a dedicated laminar flow hood. Because contaminants can lead to inconsistent results, assays should be set up under sterile conditions with filter pipette tips and ultrapure water, ideally in a dedicated laminar flow hood. For more information about qPCR optimization, refer to Bustin et al.32
Quantifying STAT3 may lead to greater insight in a number of contexts. STAT3 auto-regulates its own expression37, and the protocol described above may help to elucidate whether ratios of STAT3 splice variants contribute to regulating this positive feedback loop. The protocol could be used to study shifts in splice variant ratios as observed in cells at differing densities38 or over the course of development: it is known that the STAT3 α/β ratio changes at the protein level during hematopoiesis16. Sundin et al. found that an intronic single nucleotide polymorphism biased splicing of exon 12 in STAT3 of a patient with Job's syndrome39. It is conceivable that one of the many SNPs present in the introns between exon 21 and 22, or exon 22 and 23 may contribute to splicing ratios of ΔS/S and α/β respectively. The assay could be used to quantify STAT3 transcripts in cancerous cells, where mutations or changes in splicing regulation may introduce bias to the splicing process40. Mutations in splicing factors (like SF3B1), as observed in myelodysplastic syndromes41 may also lead to changes that can be measured by this protocol.
More broadly, this approach specifically detects co-association in splicing, which is not feasible with conventional RNA-Seq, nor standard qPCR. While the phenomenon of mutually exclusive exon splicing demonstrates coordination of splicing decisions, the co-association of other splicing events has not been well-researched. A recently described alternative method, in which RNA-Seq was modified so as to interrogate full-length cDNA, suggests distant splicing events are more co-dependent than previously thought42.
STAT3 contains a donor tandem splice site. Acceptor tandem splice sites are more frequent43 and the principles of the outlined protocol could serve as a starting point for developing assays for coincidence detection of NAGNAG splicing and other splicing events within 200 nucleotides. Other potential applications include quantification of coincidence of other subtle sequence differences, like indels or double/triple nucleotide polymorphisms44.
Disclosures
The authors have nothing to disclose.
Acknowledgements
The authors would like to acknowledge the National Institutes of Health-NHLBI for the Program Project Grant on the Role of Eosinophils in Airway Inflammation and Remodeling: P01HL088584 (PI: N. Jarjour), and the University of Wisconsin Carbone Cancer Center and Department of Medicine for intramural funding. We thank Douglas Annis for cloning the four STAT3 variants.
Materials
| Name | Company | Catalog Number | Comments |
|---|---|---|---|
| MJ Research PTC-200 Thermal Cycler | GMI | N/A | Used for standard PCR |
| 7500 Real-Time PCR System | Applied Biosystems | N/A | qPCR machine |
| GS-6R | Beckman Coulter | N/A | centrifuge for 96-well plates |
| Nanodrop 2000 sprectrophotometer | ThermoFisher Scientific | N/A | |
| RPMI-1640 medium | Sigma Aldrich | R8758 | cell culture medium |
| PfuTurbo DNA Polymerase | Agilent Technologies | 600410 | DNA polymerase for standard PCR |
| KpnI | New England Biosciences | R0142S | |
| NheI | New England Biosciences | R0131S | |
| SYBR Green PCR Master Mix | Qiagen | 330523 | qPCR, DNA polymerase/dsDNA-binding dye mix |
| Rneasy Mini Kit | Qiagen | 74204 | RNA extraction kit |
| SuperScript III First-Strand Synthesis System | Invitrogen (ThermoFisher Scientific) | 18080-044 | cDNA synthesis kit |
| Primers | Integrated DNA Technology | N/A | |
| NEBuffer 1.1 | New England Biosciences | B7201S | |
| GenePure LE Agarose | ISC BioExpress | E-3120-500 | component of TAE gel |
| Pipettors | Major lab suppliers (MLS) | N/A | |
| Filter pipette tips | Neptune Scientific | BT10XL, BT20, BT200 | |
| EU One Piece Thin Wall Plate | MidSci | ABI7501 | |
| ThermalSeal A Sealing Film | MidSci | TSA-100 | 96 well plate seal |
| pET-Elmer (variant of pET-28a) | Novagen; modified in Mosher lab | N/A | Details in PMID: 20947497 |
| Wizard Plus SV Minipreps DNA purification system | Promega | A1460 | Plasmid purification |
| BigDye Terminator v3.1 Cycle Sequencing Kit | ThermoFisher Scientific | 4337455 | Sequencing kit |
| QIAEX II Gel Extraction kit | Qiagen | 20021 | Amplicon purification |
| DH5α competent cells | ThermoFisher Scientific | 18265-017 | available from several providers, see PMID: 2162051 |
| kanamycin | Research Products International Corp. | K22000-5.0 | |
| Tris base | ThermoFisher Scientific | BP152-5 | component of TAE buffer |
| Acetic acid, glacial | ThermoFisher Scientific | A38C-212 | component of TAE buffer |
| EDTA (Ethylenediaminetetraacetic acid) | Sigma Chemical Company (Sigma Aldrich) | E-5134 | component of TAE buffer |
| Bacto Tryptone | BD Biosciences | 211705 | component of Luria Broth |
| Bacto Yeast extract, technical | BD Biosciences | 288620 | component of Luria Broth |
| Sodium chloride | ThermoFisher Scientific | S271-10 | component of Luria Broth |
| Sodium hydroxide | ThermoFisher Scientific | SS255-1 | component of Luria Broth |
| Bacto Agar | BD Biosciences | 214010 | component of Luria Broth plate |
| Lasergene SeqBuilder | DNASTAR | Figure 1 generated using Lasergene SeqBuilder software version 12.2.0 (DNASTAR) |
References
- Hiller, M., et al. Phylogenetically widespread alternative splicing at unusual GYNGYN donors. Genome Biol. 7 (7), R65(2006).
- Treacy, M. N., et al. Twin of I-POU: a two amino acid difference in the I-POU homeodomain distinguishes an activator from an inhibitor of transcription. Cell. 68 (3), 491-505 (1992).
- Schindler, S., et al. Alternative splicing at NAGNAG acceptors in Arabidopsis thaliana SR and SR-related protein-coding genes. BMC Genomics. 9, 159(2008).
- Szafranski, K., Kramer, M. It's a bit over, is that ok? The subtle surplus from tandem alternative splicing. RNA Biol. 12 (2), 115-122 (2015).
- Wang, M., et al. Alternative splicing at GYNNGY 5' splice sites: more noise, less regulation. Nucleic Acids Res. 42 (22), 13969-13980 (2014).
- Hiller, M., Platzer, M. Widespread and subtle: alternative splicing at short-distance tandem sites. Trends Genet. 24 (5), 246-255 (2008).
- Tsai, K. W., Lin, W. C. Quantitative analysis of wobble splicing indicates that it is not tissue specific. Genomics. 88 (6), 855-864 (2006).
- Tadokoro, K., et al. Frequent occurrence of protein isoforms with or without a single amino acid residue by subtle alternative splicing: the case of Gln in DRPLA affects subcellular localization of the products. J Hum Genet. 50 (8), 382-394 (2005).
- Bradley, R. K., Merkin, J., Lambert, N. J., Burge, C. B. Alternative splicing of RNA triplets is often regulated and accelerates proteome evolution. PLoS Biol. 10 (1), e1001229(2012).
- Zheng, C. L., Fu, X. D., Gribskov, M. Characteristics and regulatory elements defining constitutive splicing and different modes of alternative splicing in human and mouse. RNA. 11 (12), 1777-1787 (2005).
- Schaefer, T. S., Sanders, L. K., Nathans, D. Cooperative transcriptional activity of Jun and Stat3 beta, a short form of Stat3. Proc Natl Acad Sci U S A. 92 (20), 9097-9101 (1995).
- Waitkus, M. S., et al. Signal integration and gene induction by a functionally distinct STAT3 phosphoform. Mol Cell Biol. 34 (10), 1800-1811 (2014).
- Srivastava, J., DiGiovanni, J. Non-canonical Stat3 signaling in cancer. Mol Carcinog. , (2015).
- Holland, S. M., et al. STAT3 mutations in the hyper-IgE syndrome. N Engl J Med. 357 (16), 1608-1619 (2007).
- Maritano, D., et al. The STAT3 isoforms alpha and beta have unique and specific functions. Nat Immunol. 5 (4), 401-409 (2004).
- Hevehan, D. L., Miller, W. M., Papoutsakis, E. T. Differential expression and phosphorylation of distinct STAT3 proteins during granulocytic differentiation. Blood. 99 (5), 1627-1637 (2002).
- Yoo, J. Y., Huso, D. L., Nathans, D., Desiderio, S. Specific ablation of Stat3beta distorts the pattern of Stat3-responsive gene expression and impairs recovery from endotoxic shock. Cell. 108 (3), 331-344 (2002).
- Stahl, N., et al. Choice of STATs and other substrates specified by modular tyrosine-based motifs in cytokine receptors. Science. 267 (5202), 1349-1353 (1995).
- Zheng, M., et al. A mix of S and DeltaS variants of STAT3 enable survival of activated B-cell-like diffuse large B-cell lymphoma cells in culture. Oncogenesis. 4, 184(2016).
- Livak, K. J., Schmittgen, T. D. Analysis of relative gene expression data using real-time quantitative PCR and the 2(-Delta Delta C(T)) Method. Methods. 25 (4), 402-408 (2001).
- Zipper, H., Brunner, H., Bernhagen, J., Vitzthum, F. Investigations on DNA intercalation and surface binding by SYBR Green I, its structure determination and methodological implications. Nucleic Acids Res. 32 (12), e103(2004).
- Kelly, E. A., Liu, L. Y., Esnault, S., Quinchia Johnson, B. H., Jarjour, N. N. Potent synergistic effect of IL-3 and TNF on matrix metalloproteinase 9 generation by human eosinophils. Cytokine. 58 (2), 199-206 (2012).
- Whelan, J. A., Russell, N. B., Whelan, M. A. A method for the absolute quantification of cDNA using real-time PCR. J Immunol Methods. 278 (1-2), 261-269 (2003).
- Too, H. P. Real time PCR quantification of GFRalpha-2 alternatively spliced isoforms in murine brain and peripheral tissues. Brain Res Mol Brain Res. 114 (2), 146-153 (2003).
- Turton, K. B., Annis, D. S., Rui, L., Esnault, S., Mosher, D. F. Ratios of Four STAT3 Splice Variants in Human Eosinophils and Diffuse Large B Cell Lymphoma Cells. PloS One. 10 (5), e0127243(2015).
- Maurer, L. M., et al. Extended binding site on fibronectin for the functional upstream domain of protein F1 of Streptococcus pyogenes. J Biol Chem. 285 (52), 41087-41099 (2010).
- Current protocols in molecular biology. Ausubel, F. M., et al. , Greene Pub. Associates; J. Wiley. (1987).
- Grant, S. G., Jessee, J., Bloom, F. R., Hanahan, D. Differential plasmid rescue from transgenic mouse DNAs into Escherichia coli methylation-restriction mutants. Proc Natl Acad Sci U S A. 87 (12), 4645-4649 (1990).
- Kocsis, L., Herman, P., Eke, A. The modified Beer-Lambert law revisited. Phys Med Biol. 51 (5), N91-N98 (2006).
- Bustin, S. A., et al. The MIQE guidelines: minimum information for publication of quantitative real-time PCR experiments. Clin Chem. 55 (4), 611-622 (2009).
- Pfaffl, M. W. A new mathematical model for relative quantification in real-time RT-PCR. Nucleic Acids Res. 29 (9), e45(2001).
- A-Z of quantitative PCR. Bustin, S. A. , International University Line. (2004).
- Zhang, H. F., Lai, R. STAT3 in cancer-friend or foe. Cancers (Basel). 6 (3), 1408-1440 (2014).
- Caldenhoven, E., et al. STAT3beta, a splice variant of transcription factor STAT3, is a dominant negative regulator of transcription. J Biol Chem. 271 (22), 13221-13227 (1996).
- Zammarchi, F., et al. Antitumorigenic potential of STAT3 alternative splicing modulation. Proc Natl Acad Sci U S A. 108 (43), 17779-17784 (2011).
- Liu, Y., Beyer, A., Aebersold, R. On the Dependency of Cellular Protein Levels on mRNA Abundance. Cell. 165 (3), 535-550 (2016).
- Narimatsu, M., et al. Tissue-specific autoregulation of the stat3 gene and its role in interleukin-6-induced survival signals in T cells. Mol Cell Biol. 21 (19), 6615-6625 (2001).
- Szafranski, K., et al. Physiological state co-regulates thousands of mammalian mRNA splicing events at tandem splice sites and alternative exons. Nucleic Acids Res. 42 (14), 8895-8904 (2014).
- Sundin, M., et al. Novel STAT3 mutation causing hyper-IgE syndrome: studies of the clinical course and immunopathology. J Clin Immunol. 34 (4), 469-477 (2014).
- Oltean, S., Bates, D. O. Hallmarks of alternative splicing in cancer. Oncogene. 33 (46), 5311-5318 (2014).
- Boultwood, J., Dolatshad, H., Varanasi, S. S., Yip, B. H., Pellagatti, A. The role of splicing factor mutations in the pathogenesis of the myelodysplastic syndromes. Adv Biol Regul. 54, 153-161 (2014).
- Tilgner, H., et al. Comprehensive transcriptome analysis using synthetic long-read sequencing reveals molecular co-association of distant splicing events. Nat Biotechnol. 33 (7), 736-742 (2015).
- Hiller, M., et al. Widespread occurrence of alternative splicing at NAGNAG acceptors contributes to proteome plasticity. Nat Genet. 36 (12), 1255-1257 (2004).
- Rosenfeld, J. A., Malhotra, A. K., Lencz, T. Novel multi-nucleotide polymorphisms in the human genome characterized by whole genome and exome sequencing. Nucleic Acids Res. 38 (18), 6102-6111 (2010).
Reprints and Permissions
